Digital Thread Market Size and Share
Market Overview
| Study Period | 2020 - 2031 |
|---|---|
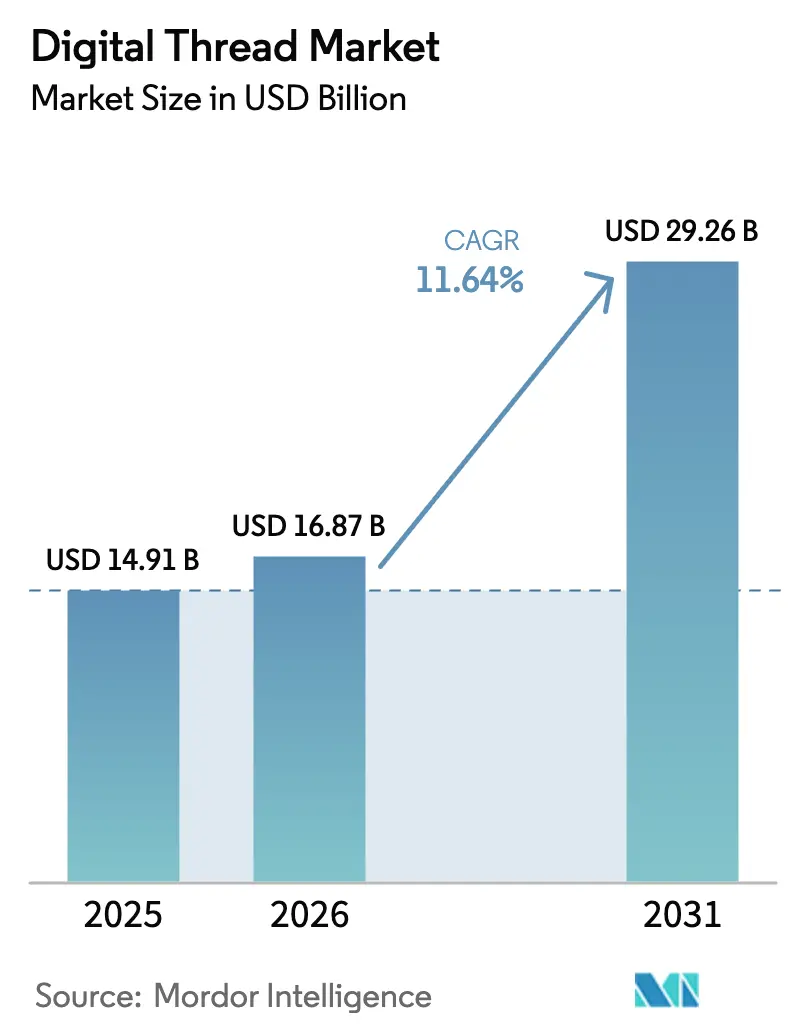
| Market Size (2026) | USD 16.87 Billion |
| Market Size (2031) | USD 29.26 Billion |
| Growth Rate (2026 - 2031) | 11.64% CAGR |
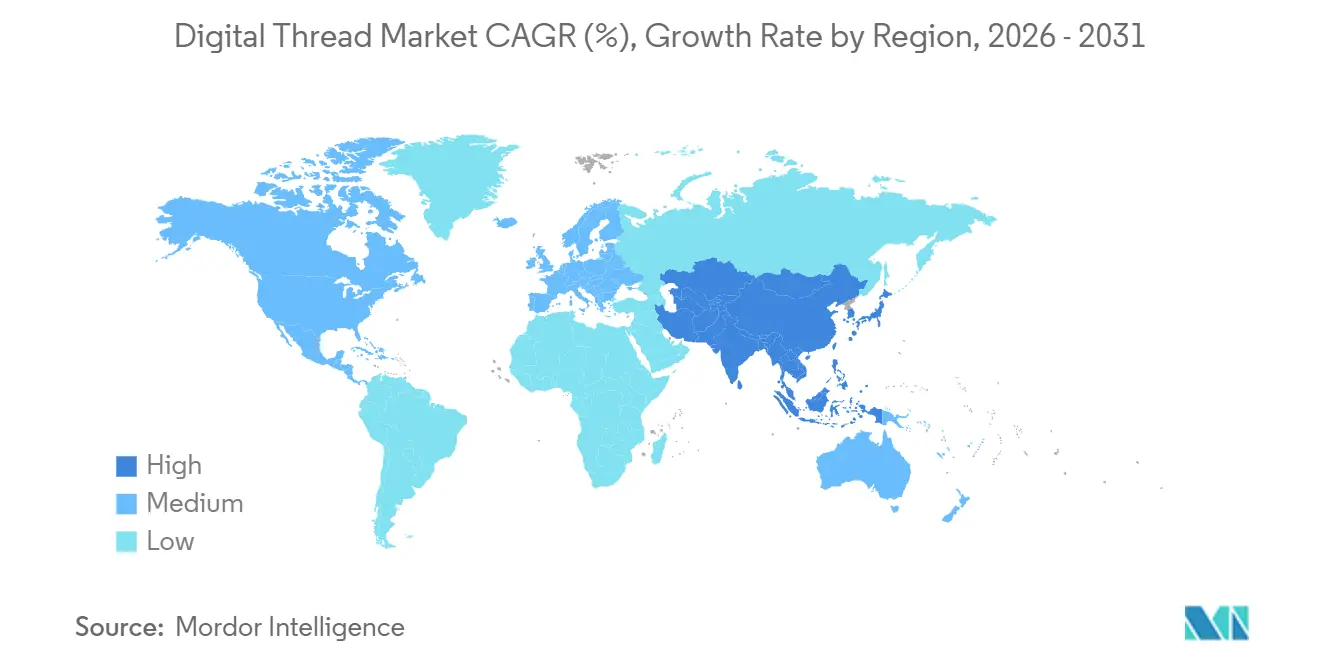
| Fastest Growing Market | Asia Pacific |
| Largest Market | North America |
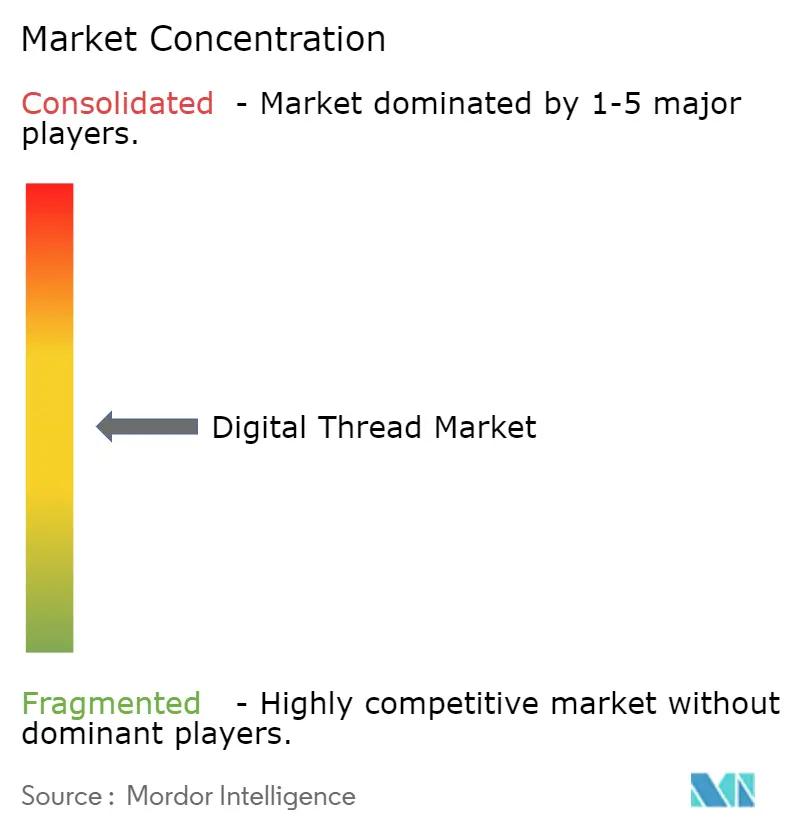
| Market Concentration | Medium |
Major Players *Disclaimer: Major Players sorted in no particular order Image © Mordor Intelligence. Reuse requires attribution under CC BY 4.0. | |
Digital Thread Market Analysis by Mordor Intelligence
The digital thread market size is projected to be USD 14.91 billion in 2025, USD 16.87 billion in 2026 and reach USD 29.26 billion by 2031, growing at a CAGR of 11.64% from 2026 to 2031. Convergence of traceability regulations, sub-USD 0.30 IIoT sensor economics and generative-AI annotation engines is widening the addressable base beyond aerospace into healthcare and automotive. North America’s 37.84% 2025 revenue share reflects early compliance with U.S. Department of Defense digital-engineering directives, while Asia-Pacific is on a steeper 12.59% trajectory as China’s Digital China 2035 and India’s production-linked incentives accelerate smart-factory build-outs. Vendors are responding with vertical integration, Siemens folded Altair’s simulation stack into Teamcenter and PTC embedded large-language-model co-pilots into Windchill, compressing design-to-manufacture loops and lowering total cost of ownership for mid-market adopters. Cyber-insurance premium spikes and sovereign-cloud mandates temper full-cloud migration, prompting a pivot toward hybrid deployments that keep sensitive intellectual property inside national borders.
Key Report Takeaways
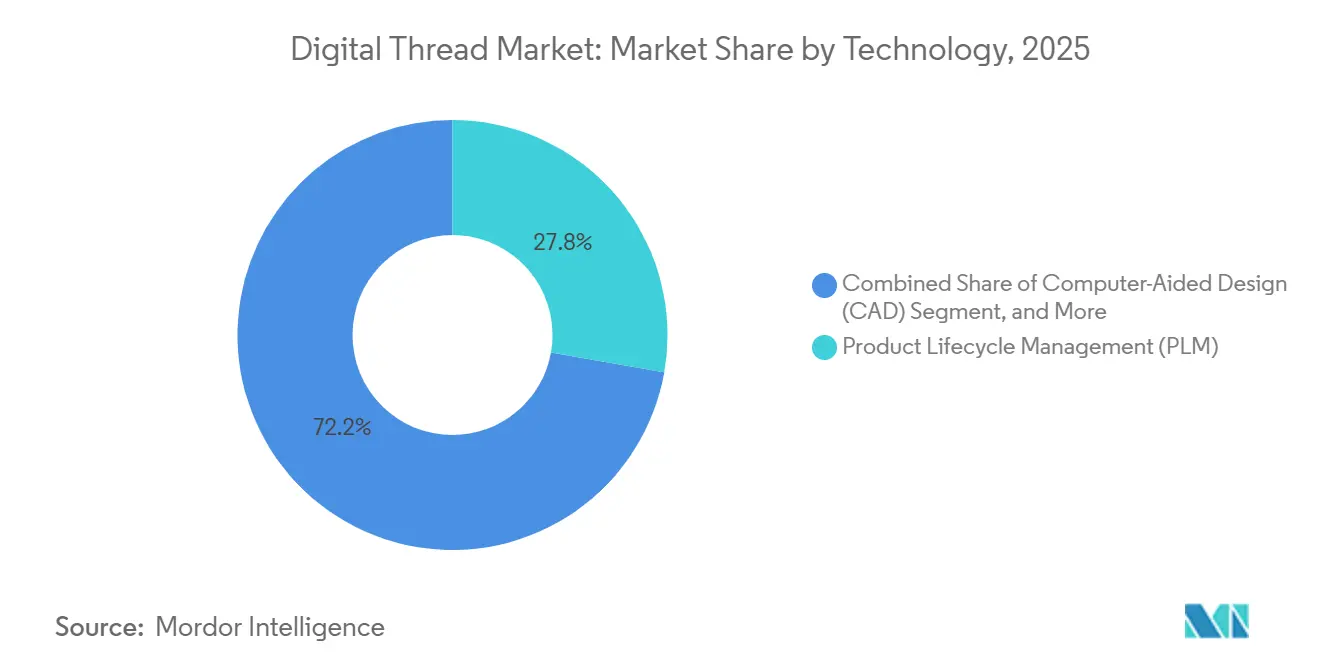
- By technology, Product Lifecycle Management led with 27.78% of 2025 digital thread market share, while Application Lifecycle Management is projected to record the fastest 13.41% CAGR through 2031.
- By deployment mode, cloud deployments accounted for 53.84% of 2025 revenue, but hybrid architectures are forecast to expand at a 12.34% CAGR to 2031.
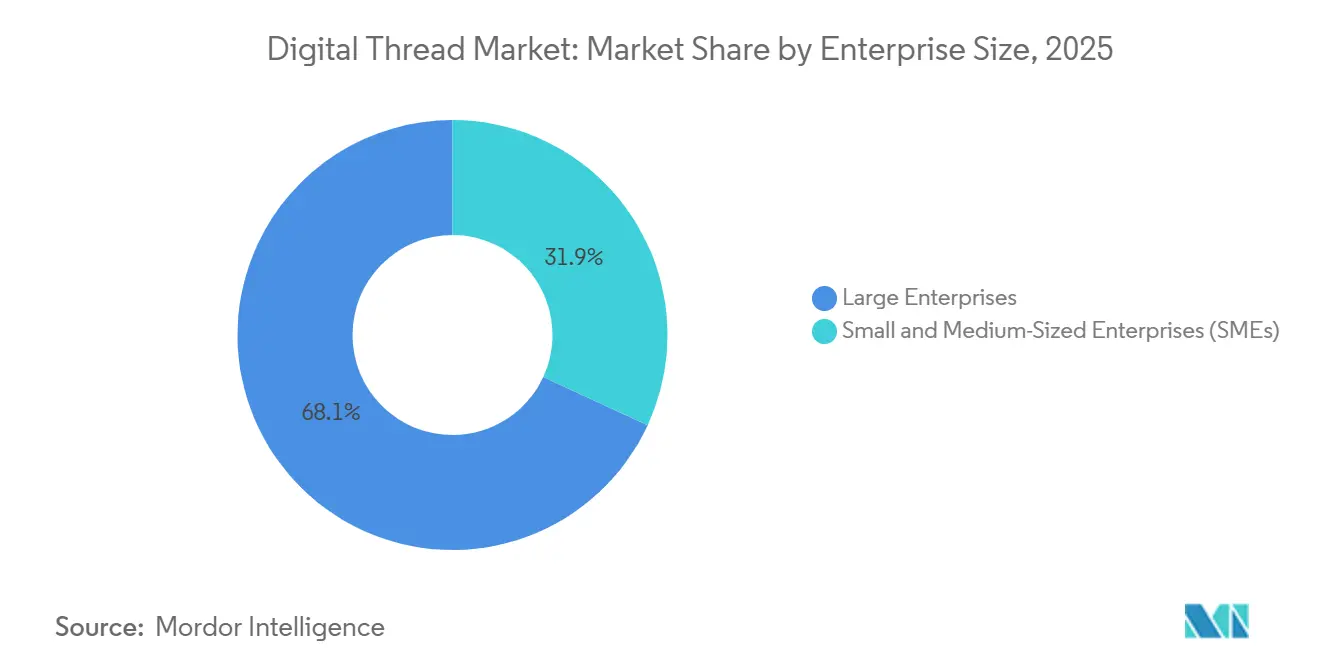
- By enterprise size, large organizations captured 68.11% of 2025 spending, whereas small and medium-sized enterprises are advancing at an 11.86% CAGR through 2031.
- By industry, aerospace and defense dominated with 41.79% of 2025 revenue, while healthcare and medical devices is the fastest riser at a 13.72% CAGR to 2031.
- By region, North America held 37.84% of 2025 revenue; Asia-Pacific is predicted to post the highest 12.59% CAGR over the forecast horizon.
Note: Market size and forecast figures in this report are generated using Mordor Intelligence’s proprietary estimation framework, updated with the latest available data and insights as of 2026.
Global Digital Thread Market Trends and Insights
Drivers Impact Analysis*
| Driver | (~) % Impact on CAGR Forecast | Geographic Relevance | Impact Timeline |
|---|---|---|---|
| Cloud-Native PLM Adoption Surge | +2.3% | Global, early concentration in North America and Western Europe | Medium term (2-4 years) |
| IIoT Sensor Cost Declines Below USD 0.30 | +1.9% | Global, accelerated deployment in Asia-Pacific | Short term (≤ 2 years) |
| Aerospace Decarbonization Compliance Push | +1.7% | Europe and North America, spillover to Middle East aviation markets | Long term (≥ 4 years) |
| Rapid-Cycle Additive Manufacturing Loops | +1.4% | North America and Europe, expanding to Asia-Pacific | Medium term (2-4 years) |
| Defense Digital Thread Mandates (U.S. DoD MBSE) | +1.6% | United States, adoption by NATO allies and Five Eyes partners | Medium term (2-4 years) |
| Gen-AI Automated Model Annotation Engines | +1.5% | Global, initial uptake in automotive and electronics | Short term (≤ 2 years) |
| Source: Mordor Intelligence | |||
Cloud-Native PLM Adoption Surge
Cloud-native Product Lifecycle Management platforms are replacing on-premises systems because global engineering teams need instant, low-latency access to the same data set. SaaS subscription pricing removes large capital outlays, and vendors now deliver pre-configured industry templates that cut deployment time from months to weeks. Early adopters report 30% lower total cost of ownership over five years since they no longer refresh hardware or manage middleware stacks. Seventy percent of manufacturers expect to migrate at least one PLM module to the cloud within two years, up from 52% in 2023, according to Aras’s 2025 survey.[1]Aras Corporation, “State of PLM Survey 2025,” Aras.com Outages at major hyperscalers in late 2024 highlighted availability risks, so manufacturers are negotiating multicloud fail-over clauses before full migration. The mix of agility and predictable costs keeps this driver the single largest uplift to the digital thread market.
IIoT Sensor Cost Declines Below USD 0.30
When Bluetooth LE and LoRaWAN modules fell under USD 0.30 at 100,000-unit volumes after semiconductor foundries moved to 22-nm nodes, enabling plant-wide instrumentation at marginal cost, manufacturers could justify placing sensors on every tool, pallet and sub-assembly rather than a sampling subset. Cheaper nodes stream continuous telemetry into PLM environments, enabling closed-loop quality control that catches defects in real time instead of during end-of-line inspection. Rockwell and Honeywell now bundle edge gateways that auto-map sensor tags to bill-of-materials IDs, eliminating manual data-entry errors. Rockwell’s FactoryTalk Edge Gateway ships at USD 0.28 per sensor and maps tags directly to PLM IDs, removing USD 5,000 per line integration fees.[2]Rockwell Automation, “Investor Presentation February 2025,” Rockwellautomation.com Factory data volumes routinely exceed 10 TB per day, so most users park raw streams in data lakes while synchronizing key metrics back to PLM for auditability. The falling price curve therefore enlarges the digital thread market without proportionally raising infrastructure budgets.
Aerospace Decarbonization Compliance Push
EU ETS Phase IV caps and ReFuelEU Aviation fuel mandates compel airframers to embed cradle-to-grave carbon accounting inside their digital threads. Airbus and Rolls-Royce already calculate part-level footprints in PLM so they can prove compliance and help airlines earn offset credits. Airbus now embeds carbon-footprint modules in its Dassault 3DEXPERIENCE environment to track Scope 3 emissions for every A320neo component.[3]Airbus SE, “Sustainability Report 2024,” Airbus.com U.S. Inflation Reduction Act tax incentives for sustainable aviation fuel mirror the European pressure, pushing North American OEMs toward similar traceability. Integrating lifecycle-assessment engines into PLM costs up to USD 5 million for a midsize supplier, yet non-compliance fines run higher, so investment is the cheaper path. Carbon reporting therefore turns sustainability into a must-have feature that expands the addressable digital thread market.
Rapid-Cycle Additive Manufacturing Loops
Digital threads shrink design-to-test cycles when additive manufacturing is tightly integrated with generative design, simulation and in-situ monitoring. Aerospace teams now iterate complex fuel-nozzle geometries in days because metrology feedback from printed parts flows straight back to the CAD model. Real-time layer inspection allows printers to auto-adjust laser power, cutting scrap and rework. Although regulators demand full traceability of powder batches and print parameters, that very requirement locks additive data firmly into PLM, driving higher software stickiness. Faster physical validation accelerates product launches and underpins a steady expansion of the digital thread market.
Restraints Impact Analysis*
| Restraint | (~) % Impact on CAGR Forecast | Geographic Relevance | Impact Timeline |
|---|---|---|---|
| SME Talent Gap in Model-Based Engineering | -1.2% | Global, acute in North America and Europe | Medium term (2-4 years) |
| Sovereign-Cloud and Data-Residency Barriers | -0.9% | Europe, China, India, spillover to Middle East and Africa | Long term (≥ 4 years) |
| PLM/SaaS Vendor Lock-In Concerns | -0.6% | Global, heightened in automotive and aerospace | Medium term (2-4 years) |
| Cyber-Attack Insurance Premium Spikes | -0.7% | North America and Europe, expanding to Asia-Pacific | Short term (≤ 2 years) |
| Source: Mordor Intelligence | |||
SME Talent Gap in Model-Based Engineering
Only a small share of production engineers can model systems in SysML, and retirement rates outpace the arrival of new graduates with digital twin skills. Integrators bill USD 220-440 per hour and carry backlogs that delay projects by six months or more, stretching payback periods for small suppliers. Community colleges cover model-based engineering in fewer than one-fifth of manufacturing programs, so employers must fund in-house upskilling at premium overtime rates. Prolonged hiring cycles raise total implementation costs and make return-on-investment calculations less attractive for firms below USD 100 million in revenue. The skills shortfall therefore keeps the digital thread market from reaching broader SME penetration.
Sovereign-Cloud and Data-Residency Barriers
The EU Data Act, China’s Data Security Law and India’s privacy rules force manufacturers to keep intellectual property inside national borders, fragmenting global PLM rollouts. Vendors build local instances with data-trust partners, but smaller regions lack hyperscale capacity, pushing up subscription prices by 25-35%. Extra compliance testing and dual hosting agreements lengthen deployment timelines, and some defense primes will not allow any cloud at all, cementing on-premises holdouts. Multinationals end up running separate PLM stacks that cannot openly sync designs, undercutting the “single source of truth” value proposition. Data-residency friction thus slows the digital thread market’s shift to full SaaS. Germany’s BSI mandates that defense IP reside on EU-controlled servers. China’s 2024 Data Security Law amendments require security reviews for manufacturing data exports. Capgemini estimates sovereign-cloud PLM deployments cost 25-35% more than public-cloud equivalents.[4]Capgemini SE, “Cloud Sovereignty Study 2024,” Capgemini.com
*Our forecasts treat driver/restraint impacts as directional, not additive. The impact forecasts reflect baseline growth, mix effects, and variable interactions.
Segment Analysis
By Technology: ALM Surge Builds on PLM Foundation
Product Lifecycle Management platforms accounted for 27.78% of 2025 revenue, anchoring the digital thread market share around mechanical design control and change-management workflows. Application Lifecycle Management, however, is expanding at a 13.41% CAGR through 2031 because software now dominates functionality in electric vehicles and connected medical devices. CAD and CAM modules remain indispensable, yet browser-native tools such as Onshape lower licensing friction for new entrants. Simulation stacks gained new importance after Siemens folded Altair’s HyperWorks into Teamcenter, letting engineers run topology optimization and feed results straight into manufacturing execution.
ALM momentum reflects regulatory standards like ISO 26262 and IEC 62304 that mandate bidirectional traceability from software requirements to validation results. Unified PLM-ALM environments let teams manage mechanical configurations and embedded code under a single change order, cutting release cycles by weeks. Service Lifecycle Management also grows as original-equipment makers seek post-sale revenue based on in-field data. IoT platforms extend this loop, streaming sensor telemetry into design archives so next-generation products launch with higher reliability. Together these shifts widen the digital thread market by blending physical and digital disciplines inside one governed chain.


By Deployment Mode: Hybrid Rises Alongside Cloud Dominance
Cloud deployments held 53.84% of 2025 revenue, reflecting early cost savings and rapid onboarding that lifted the digital thread market size across global programs. Vendors deliver pre-configured SaaS templates that reduce provisioning from months to days, appealing to suppliers pressed for time. Yet hybrid architectures are posting a 12.34% CAGR as manufacturers wall off crown-jewel intellectual property to satisfy sovereign-cloud mandates in the European Union, China and India.
Hybrid splits workloads, keeping sensitive CAD files on premises while collaboration portals run in public regions, which balances latency, compliance and vendor lock-in exposure. Siemens, PTC and SAP now offer data-residency tiers that guarantee storage within specific jurisdictions, reassuring risk-averse aerospace and defense clients. The arrangement costs 15-20% more than pure cloud because firms must still refresh local servers, but executives accept the premium to maintain audit trails and cyber-resilience. As regulations tighten, this middle path is expected to draw additional investment, strengthening the digital thread industry’s overall resilience.
By Enterprise Size: Large Firms Lead, SMEs Accelerate on SaaS
Large enterprises commanded 68.11% of 2025 spending, leveraging scale to integrate design, supplier quality and shop-floor execution across dozens of global sites. Programs such as Boeing’s Dreamliner funnel data from 5 400 suppliers into a single Teamcenter tenant, illustrating how size amplifies return on digital threads. These firms also possess internal centers of excellence that absorb model-based engineering skills gaps, shortening deployment timelines.
Small and medium-sized enterprises are advancing at an 11.86% CAGR as modular SaaS pricing drops entry costs to USD 200-500 per user per month and 90-day onboarding schedules. Open-architecture platforms like Aras Innovator appeal by removing upfront license fees, letting SMEs start with change-control basics and layer complexity later. Public incentives from NIST’s Manufacturing Extension Partnership and Germany’s Mittelstand Digital reimburse training hours and subscription fees, further tilting economics. Broader SME participation spreads the digital thread market across a wider manufacturing base, improving network effects for supplier collaboration.
By Industry Vertical: Aerospace Dominates, Healthcare Fastest Growing
Aerospace and defense generated 41.79% of 2025 revenue, cementing its role as the core adopter thanks to U.S. Department of Defense model-based mandates and the sector’s 30-year asset life cycles. Digital threads track every rivet and software patch through design, production, sustainment and eventual decommissioning, enabling faster retrofit decisions and regulatory audits. Defense primes also require tier-two suppliers to deliver real-time quality data, extending platform usage through the supply chain.
Healthcare and medical devices post the quickest 13.72% CAGR because the FDA Unique Device Identification system and EU Medical Device Regulation compel cradle-to-patient traceability. Battery manufacturers, industrial machinery builders and energy utilities likewise embed end-to-end data flows to satisfy Scope 3 carbon accounting under the EU Corporate Sustainability Reporting Directive. Electronics and semiconductor fabs implement wafer-level yield reporting to unlock U.S. CHIPS Act subsidies. Together these verticals reinforce the digital thread market as a cross-sector backbone for compliance, profitability and sustainability objectives.
Geography Analysis
North America held a 37.84% share of 2025 revenue, driven by U.S. defense spending that ties contract awards to compliant model-based systems engineering and by automaker investments in electric-vehicle battery provenance. The Inflation Reduction Act links USD 7 500 tax credits to verified domestic content, spurring new digital threads that certify mineral sourcing. Canada’s aerospace cluster uses Dassault 3DEXPERIENCE to coordinate multi-site jet programs, while Mexico’s near-shore plants sync with U.S. design centers to cut lead times on powertrain components.
Asia-Pacific is forecast to expand at a 12.59% CAGR as China channels CNY 10 trillion (USD 1.4 trillion) into Digital China 2035 smart-factory upgrades and India releases INR 1.97 trillion (USD 24 billion) production-linked incentives across electronics, automotive and pharmaceuticals. Japan’s Society 5.0 budget backs digital twins for aging infrastructure, and South Korea earmarked KRW 2 trillion (USD 1.5 billion) to seed 5 000 smart factories. ASEAN members, led by Vietnam and Thailand, couple foreign direct investment with tax holidays for cloud PLM, pushing regional suppliers onto shared collaboration portals.
Europe anchors adoption through regulation that forces digital audit trails. Germany’s EUR 2.2 trillion (USD 2.4 trillion) industrial base reports 54% module-level penetration, buttressed by the EU Data Act and Corporate Sustainability Reporting Directive. The United Kingdom’s Aerospace Technology Institute funnels GBP 685 million (USD 870 million) into net-zero aircraft requiring digital threads, while France’s EUR 8 billion (USD 8.8 billion) France 2030 plan co-funds traceability software. Italy and Spain extend Industria 4.0 tax credits for PLM upgrades, and Nordic utilities integrate sensor data with design archives to support life-extension licenses. Collectively, regulatory stringency and financial incentives deepen digital thread market integration across the continent.

Competitive Landscape
The digital thread market remains moderately fragmented, with Dassault Systèmes, Siemens, PTC, SAP and Oracle holding about 40% of revenue. Each leader is assembling full-stack offerings that span design, simulation, manufacturing execution and service to lock in account footprints. Siemens purchased Altair for USD 10.6 billion in 2024, combining HyperWorks simulation with Teamcenter PLM and Opcenter MES so customers run topology optimisation and post-processing within one environment. PTC embedded large-language-model copilots in Windchill during 2025, letting engineers request “show affected fasteners” and receive a pre-built change package in minutes rather than hours, a time saver that boosts user stickiness.
Specialists fill capability gaps that broad suites overlook. Aras attracts mid-market manufacturers with an open-source core that eliminates license fees, while Hexagon links metrology data to PLM for closed-loop quality, and Onshape delivers browser-native CAD that suits distributed startups. Systems integrators, Accenture, Capgemini, Tata Consultancy Services and DXC Technology, capture roughly one-quarter of total spend by bundling software with process re-design, especially for automotive suppliers moving toward software-defined vehicles.
Innovation intensity continues to rise. The United States Patent and Trademark Office granted 1 247 digital-thread-related patents in 2024, up 52% year on year, with Siemens, IBM and GE filing heavily for blockchain traceability and federated learning across multi-party supply chains. Rockwell Automation’s 2025 Azure Digital Twins integration shows how operational-technology vendors plug real-time plant data into PLM, and Honeywell forecasts USD 1 billion in Forge revenue by 2027 from similar linkups. These moves indicate that competitive advantage will hinge less on core PLM features and more on how seamlessly vendors connect edge telemetry, AI simulation and supply-chain partners inside one expandable digital thread.
Digital Thread Industry Leaders
Dassault Systèmes SE
Aras Corporation
Rockwell Automation, Inc.
Hexagon AB
International Business Machines Corporation
- *Disclaimer: Major Players sorted in no particular order

Recent Industry Developments
- February 2026: Siemens Digital Industries Software released Teamcenter X 2.0 with federated data-lake querying that cut PLM query latency by 80% during aerospace pilots.
- January 2026: PTC and ServiceNow partnered to embed Windchill data into field-service workflows, targeting 15 000 joint customers this year.
- December 2025: Dassault Systèmes finalized the USD 5.8 billion Medidata acquisition, extending 3DEXPERIENCE from device design into clinical-trial oversight.
- November 2025: SAP launched Sustainability Footprint Management integrated with S/4HANA Cloud, enrolling 120 pilot customers ahead of CSRD deadlines.


Global Digital Thread Market Report Scope
The Digital Thread Market Report is Segmented by Technology (PLM, CAD, CAM, SLM, ALM, MRP, ERP, Other Technologies), Deployment Mode (Cloud, On-Premises, Hybrid), Enterprise Size (Large Enterprises, SMEs), Industry Vertical (Aerospace and Defense, Automotive, Industrial Machinery, Energy, Healthcare, Electronics, Other Verticals), and Geography (North America, South America, Europe, Asia-Pacific, Middle East, Africa). The Market Forecasts are Provided in Terms of Value (USD).
| Product Lifecycle Management (PLM) |
| Computer-Aided Design (CAD) |
| Computer-Aided Manufacturing (CAM) |
| Service Lifecycle Management (SLM) |
| Application Lifecycle Management (ALM) |
| Material Requirements Planning (MRP) |
| Enterprise Resource Planning (ERP) |
| Other Technologies |
| Cloud |
| On-Premises |
| Hybrid |
| Large Enterprises |
| Small and Medium-Sized Enterprises (SMEs) |
| Aerospace and Defense |
| Automotive and Transportation |
| Industrial Machinery |
| Energy and Utilities |
| Healthcare and Medical Devices |
| Electronics and Semiconductors |
| Other Industry Verticals |
| North America | United States |
| Canada | |
| Mexico | |
| South America | Brazil |
| Argentina | |
| Rest of South America | |
| Europe | Germany |
| United Kingdom | |
| France | |
| Italy | |
| Spain | |
| Rest of Europe | |
| Asia-Pacific | China |
| Japan | |
| India | |
| South Korea | |
| ASEAN | |
| Rest of Asia-Pacific | |
| Middle East | Saudi Arabia |
| United Arab Emirates | |
| Turkey | |
| Rest of Middle East | |
| Africa | South Africa |
| Nigeria | |
| Rest of Africa |
| By Technology | Product Lifecycle Management (PLM) | |
| Computer-Aided Design (CAD) | ||
| Computer-Aided Manufacturing (CAM) | ||
| Service Lifecycle Management (SLM) | ||
| Application Lifecycle Management (ALM) | ||
| Material Requirements Planning (MRP) | ||
| Enterprise Resource Planning (ERP) | ||
| Other Technologies | ||
| By Deployment Mode | Cloud | |
| On-Premises | ||
| Hybrid | ||
| By Enterprise Size | Large Enterprises | |
| Small and Medium-Sized Enterprises (SMEs) | ||
| By Industry Vertical | Aerospace and Defense | |
| Automotive and Transportation | ||
| Industrial Machinery | ||
| Energy and Utilities | ||
| Healthcare and Medical Devices | ||
| Electronics and Semiconductors | ||
| Other Industry Verticals | ||
| By Geography | North America | United States |
| Canada | ||
| Mexico | ||
| South America | Brazil | |
| Argentina | ||
| Rest of South America | ||
| Europe | Germany | |
| United Kingdom | ||
| France | ||
| Italy | ||
| Spain | ||
| Rest of Europe | ||
| Asia-Pacific | China | |
| Japan | ||
| India | ||
| South Korea | ||
| ASEAN | ||
| Rest of Asia-Pacific | ||
| Middle East | Saudi Arabia | |
| United Arab Emirates | ||
| Turkey | ||
| Rest of Middle East | ||
| Africa | South Africa | |
| Nigeria | ||
| Rest of Africa | ||


Key Questions Answered in the Report
How large is the digital thread market today and in 2031?
The digital thread market size stands at USD 16.87 billion in 2026 and is projected to reach USD 29.26 billion by 2031.
Which region grows the fastest over the forecast period?
Asia-Pacific posts the highest 12.59% CAGR thanks to China's Digital China 2035 investments and India's incentive-driven factory upgrades.
Which technology segment is expanding quickest?
Application Lifecycle Management records a 13.41% CAGR as software-defined products demand synchronized code, test and deployment workflows.
Why are hybrid deployments gaining popularity?
Sovereign-cloud rules in the EU, China and India require that sensitive intellectual property stay local, so manufacturers split workloads between on-premises and cloud to balance compliance with scalability.
What is the chief barrier for small and medium-sized manufacturers?
A shortage of model-based engineering talent pushes integration backlogs to six months and raises implementation costs, slowing SME adoption despite lower SaaS pricing.
Who are the main vendors in the space?
Dassault Systèmes, Siemens, PTC, SAP and Oracle collectively hold about 40% of the market, while Aras, Hexagon and Altair address niche requirements with open architectures, metrology links and high-speed simulation.
Page last updated on:


