Distributed Control System Market Size and Share
Market Overview
| Study Period | 2020 - 2031 |
|---|---|
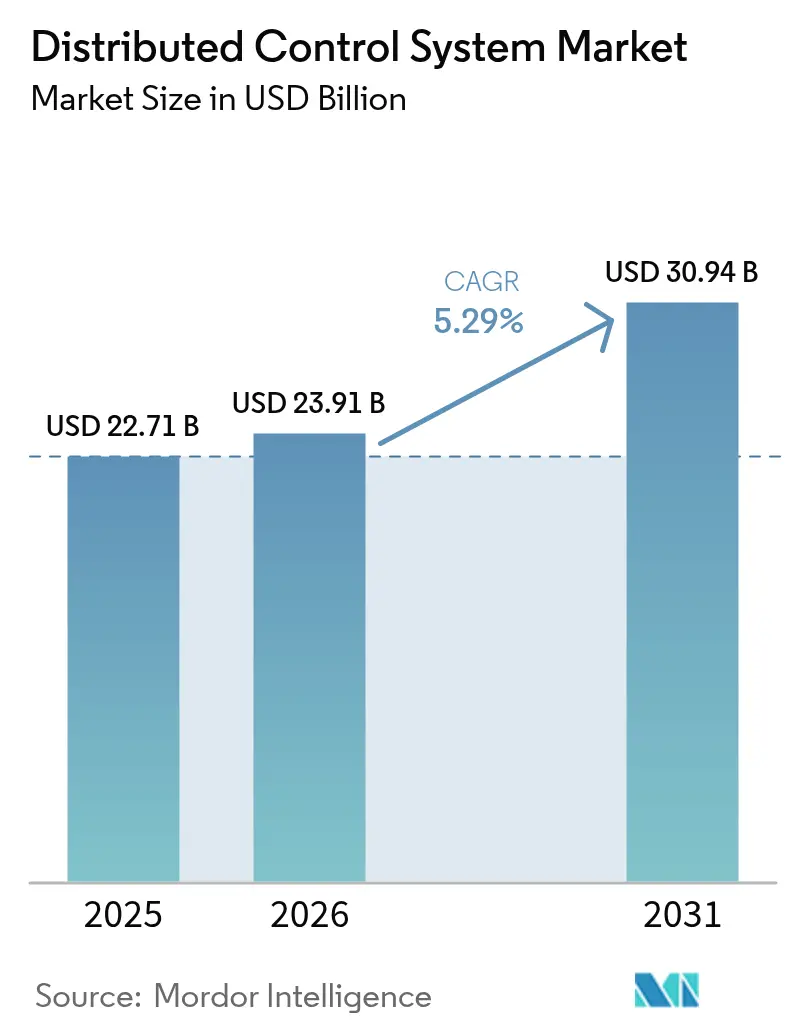
| Market Size (2026) | USD 23.91 Billion |
| Market Size (2031) | USD 30.94 Billion |
| Growth Rate (2026 - 2031) | 5.29% CAGR |
| Fastest Growing Market | Middle East |
| Largest Market | Asia Pacific |
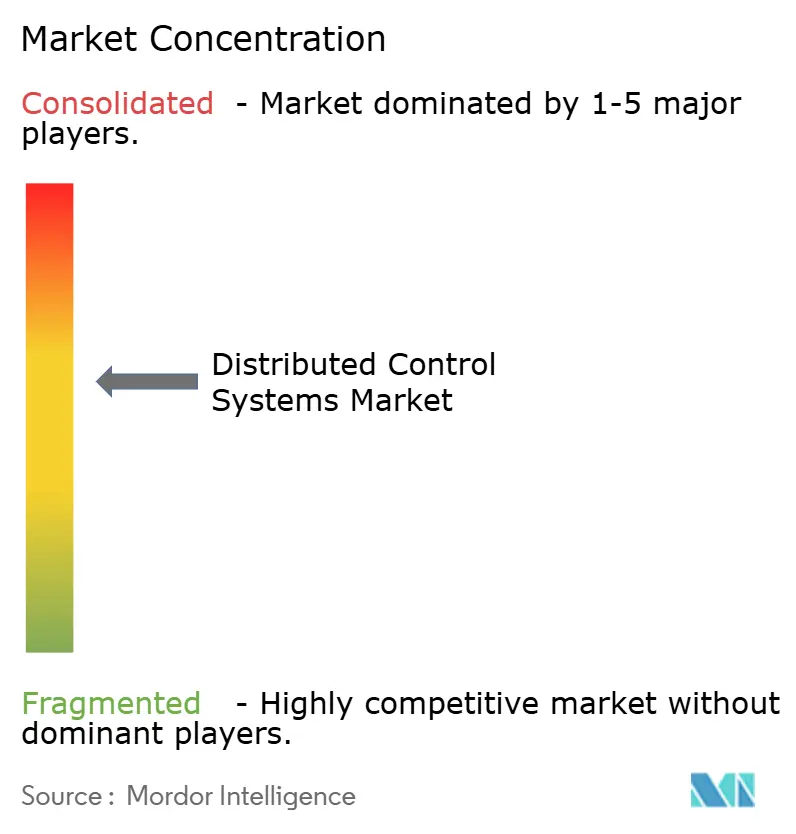
| Market Concentration | Medium |
Major Players *Disclaimer: Major Players sorted in no particular order Image © Mordor Intelligence. Reuse requires attribution under CC BY 4.0. | |
Distributed Control System Market Analysis by Mordor Intelligence
The distributed control system market size is projected to expand from USD 22.71 billion in 2025 and USD 23.91 billion in 2026 to USD 30.94 billion by 2031, registering a 5.29% CAGR between 2026 and 2031. Strong retrofit demand from aging refineries, green-hydrogen electrolyzer build-outs, and the roll-out of edge-connected historian software keep capital flowing despite macroeconomic uncertainty. Asia-Pacific’s brown-to-green energy pivot, North American carbon-capture retrofits, and Europe’s continuous-manufacturing push in pharmaceuticals lift multi-vertical order books for both incumbent automation majors and fast-moving regional specialists. At the same time, hyperscale cloud providers deepen alliances with controller vendors so small plants can shift supervisory workloads to consumption-based platforms, compressing up-front capital requirements and shortening commissioning schedules. Hardware remains the revenue anchor, yet containerized analytics modules and digital-twin subscriptions capture a rising share of spend as operators seek payback through predictive maintenance rather than periodic control-room upgrades.
Key Report Takeaways
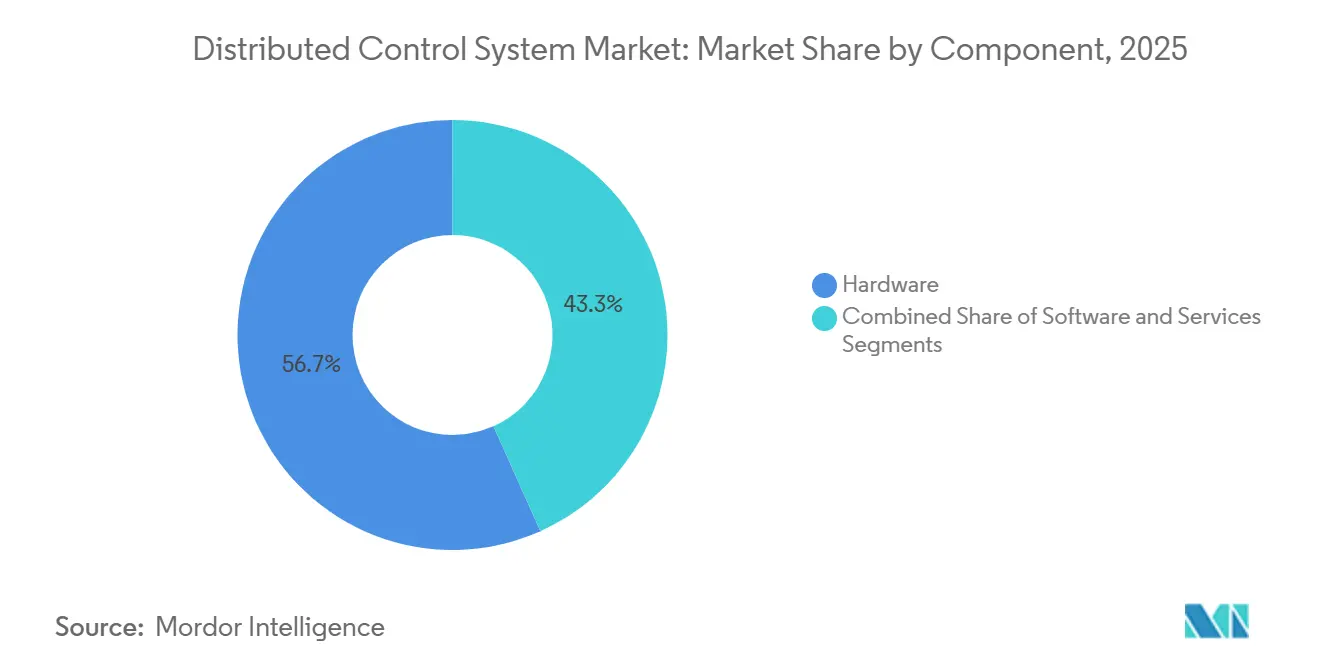
- By component, hardware accounted for 56.71% of the distributed control system market share in 2025, while software is projected to grow at a 5.89% CAGR through 2031.
- By architecture, hybrid and distributed-hybrid systems accounted for 47.33% of 2025 revenue, and the same category is set to expand at a 5.83% CAGR through 2031.
- By deployment model, on-premises installations accounted for 86.23% of the distributed control system market share in 2025, whereas cloud- and edge-hosted configurations are forecast to grow at a 5.67% CAGR through 2031.
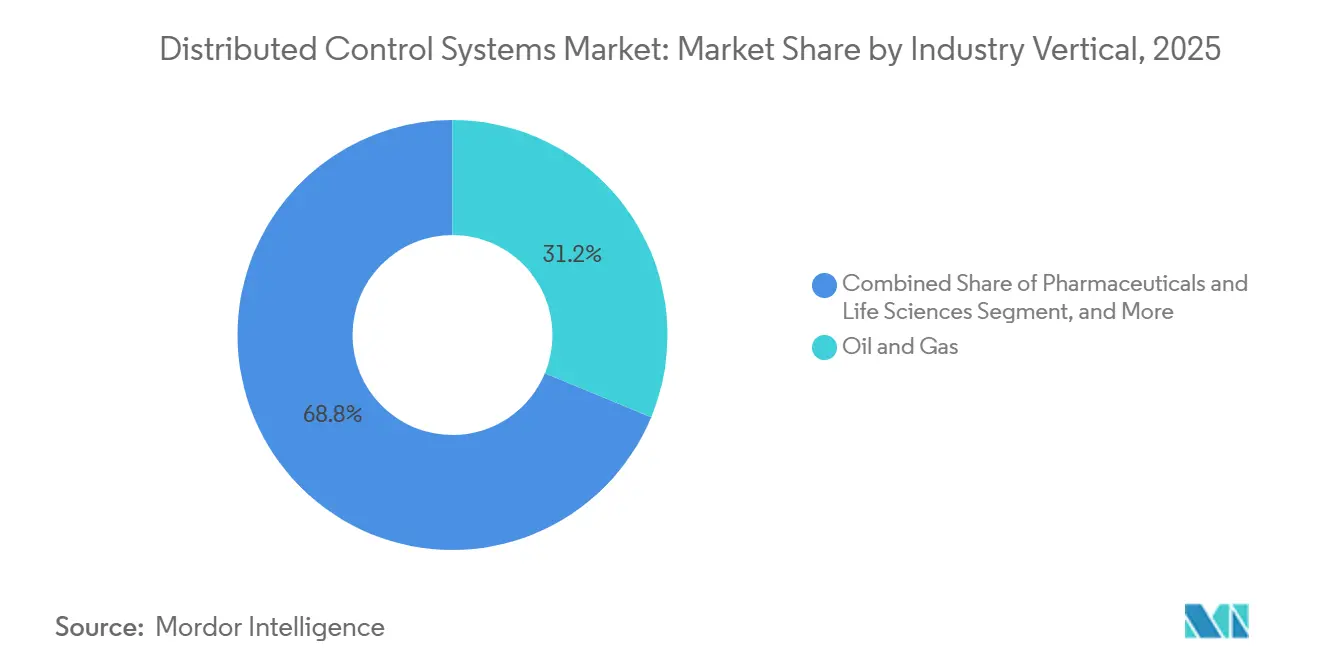
- By industry vertical, oil and gas accounted for 31.24% of 2025 revenue, while pharmaceuticals and life sciences are expected to register a 7.09% CAGR to 2031.
- By plant size, installations above 15,000 I/O captured 46.74% of the distributed control system market share in 2025, and plants below 5,000 I/O are poised to post a 5.86% CAGR through 2031.
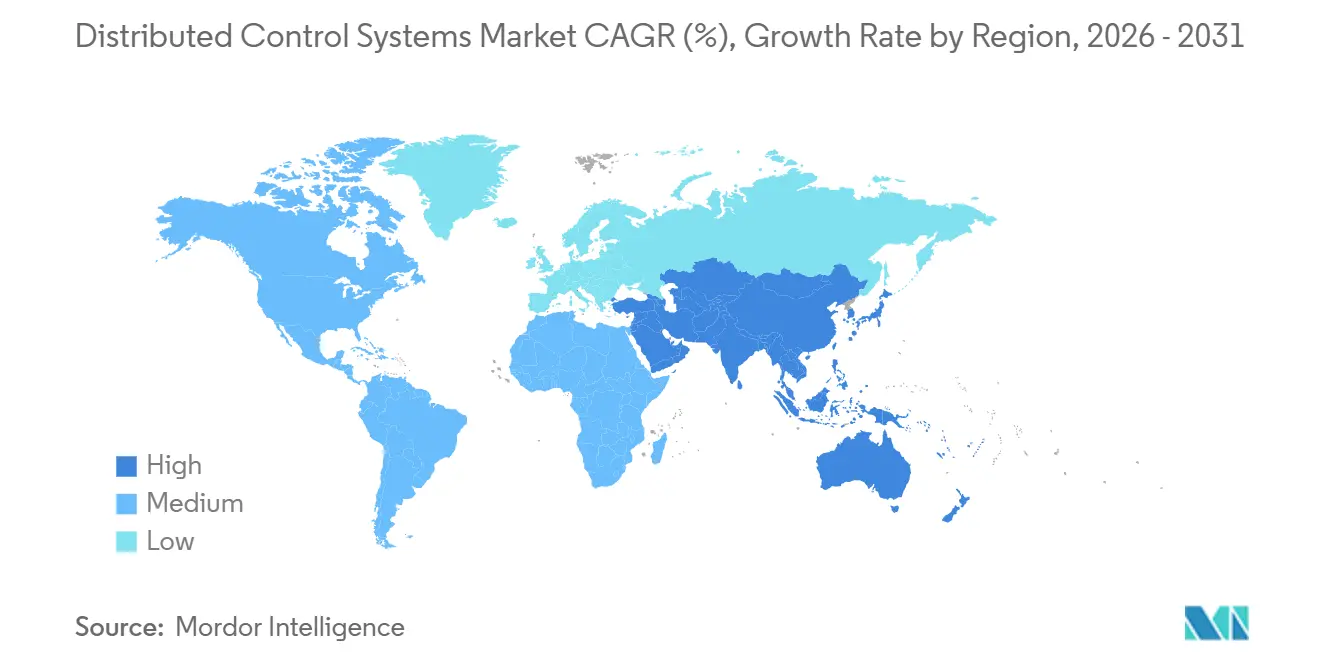
- By geography, Asia-Pacific led with 38.92% of 2025 revenue, whereas the Middle East is projected to log the fastest 6.22% CAGR to 2031.
Note: Market size and forecast figures in this report are generated using Mordor Intelligence’s proprietary estimation framework, updated with the latest available data and insights as of 2026.
Global Distributed Control System Market Trends and Insights
Drivers Impact Analysis*
| Driver | (~) % Impact on CAGR Forecast | Geographic Relevance | Impact Timeline |
|---|---|---|---|
| Energy Transition Drives DCS Demand in Green Hydrogen and CCUS Facilities | +1.2% | Europe, Middle East, North America, Asia-Pacific | Medium term (2-4 years) |
| Nuclear and SMR Projects Requiring Cyber-secure Safety-Classified DCS | +0.8% | North America, Europe, Asia-Pacific | Long term (≥ 4 years) |
| Offshore Floating LNG Complexity Elevates High-Reliability DCS Adoption | +0.7% | Asia-Pacific, Middle East, Africa | Medium term (2-4 years) |
| Pharma Continuous Manufacturing Spurs Modular Batch DCS Installations | +0.9% | North America, Europe, India | Short term (≤ 2 years) |
| Digital-Twin-Integrated DCS for Predictive Maintenance in Brownfields | +0.6% | North America, Europe | Medium term (2-4 years) |
| Remote Operations Centres in Mining Accelerate Edge-Connected DCS | +0.5% | Asia-Pacific, South America, Africa | Short term (≤ 2 years) |
| Source: Mordor Intelligence | |||
Energy Transition Drives DCS Demand in Green Hydrogen and CCUS Facilities
Green-hydrogen hubs and carbon-capture plants add fast-cycling electrolyzers and amine scrubbers that require millisecond power-grid response, so operators specify safety-instrumented DCS platforms rather than piecemeal controllers. Honeywell configured its Experion PKS for the HyNet North West project, linking proton-exchange-membrane stacks and carbon-capture skids to hold 95% CO₂ removal while grid frequency swings.[1]John Carter, “HyNet North West Hydrogen Production Hub,” Honeywell Process Solutions, honeywell.com ABB’s Symphony Plus now manages a blue-hydrogen complex at Port Arthur, coordinating reformers and adsorption units to secure U.S. tax credits tied to verified capture rates. Siemens deployed SIMATIC PCS neo at the Hamburg Green Hydrogen Hub, where real-time electrolyzer control trimmed grid-balancing costs by 18%. These reference sites demonstrate that DCS architecture turns compliance tasks into revenue-generating opportunities by qualifying projects for subsidies and for markets for ancillary services. As more regions roll out similar incentives, green-fuel developers are writing DCS functionality into front-end engineering designs rather than adding it later.
Nuclear and SMR Projects Requiring Cyber-Secure Safety-Classified DCS
Small modular reactors and new large units must meet IAEA SSG-39 and national nuclear codes that call for triple-redundant, diversity-qualified controllers verified through formal software testing.[2]International Atomic Energy Agency, “Safety Classification of Structures, Systems and Components in Nuclear Power Plants,” iaea.org NuScale’s VOYGR design isolates protection, heat-removal, and containment loops on separate networks to prevent common-cause failure, and the approach passed a Canadian pre-licensing review in 2024. Emerson’s Ovation platform now anchors the Darlington refurbishment, embedding deterministic Ethernet to deliver sub-10-millisecond trip signals. These projects increase DCS content per megawatt by up to 60% compared to fossil plants. Although certification adds several years to the sales cycle, vendors that clear the nuclear bar lock in decades of high-margin lifecycle service.
Offshore Floating LNG Complexity Elevates High-Reliability DCS Adoption
Floating LNG vessels combine cryogenic processing, dynamic positioning, and cargo transfer on a single hull, pushing the limits of reliability and marine-class vibration. Kongsberg’s K-Chief controls Shell Prelude, using quadruple-redundant controllers and fiber-optic rings rated for 15 years of service in salt spray.[3]Maria Cruz, “Shell Prelude FLNG K-Chief Automation,” Kongsberg Maritime, kongsberg.com ABB’s 800xA steers BW Opal FLNG, integrating well control, gas treatment, and nitrogen refrigeration while the vessel maintains a three-meter station-keeping window. Siemens equipped Malaysia’s PFLNG Dua with model-predictive control, which helped the unit reach 92% nameplate utilization, well above the average for fixed onshore trains. Because hull motions and simultaneous liquefaction push risk far above shore plants, owners budget 2.5 times more DCS spend per ton of capacity. This premium shields automation suppliers from price erosion in the broader LNG market.
Pharma Continuous Manufacturing Spurs Modular Batch DCS Installations
FDA Process Validation Guidance and ICH Q13 encourage drug makers to move from campaign batches to continuous lines, which need real-time quality checks and electronic signatures. Pfizer’s portable facility in Connecticut relies on Emerson DeltaV with inline spectroscopy to cut batch-release time from 14 days to 24 hours. Eli Lilly adopted Rockwell PlantPAx for its Indianapolis tableting line, unifying granulation and compression under one historian to streamline regulatory audits. Novartis uses SIMATIC Batch to connect perfusion bioreactors with downstream purification, boosting volumetric productivity by 35%. The modular skid model halves engineering hours while increasing the number of cyber-exposed endpoints, so vendors bundle monitoring services to extend revenue beyond hardware sales. Continuous production, therefore, converts DCS from a utility expense into a strategic lever for speed-to-market.
Restraints Impact Analysis*
| Restraint | (~) % Impact on CAGR Forecast | Geographic Relevance | Impact Timeline |
|---|---|---|---|
| High Up-front CAPEX Versus Modern PLC and SCADA Alternatives | -0.9% | Global (higher sensitivity in South America, Africa, Southeast Asia) | Short term (≤ 2 years) |
| Scarcity of DCS-Certified Engineers and Lifecycle Service Staff | -0.7% | North America, Europe, Australia | Medium term (2-4 years) |
| Semiconductor Supply Crunch for High-Performance Controller Hardware | -0.4% | Global (supply-chain concentration in Asia-Pacific) | Short term (≤ 2 years) |
| Lengthy Cyber-security Certification and Compliance Cycles | -0.5% | North America, Europe, Middle East | Medium term (2-4 years) |
| Source: Mordor Intelligence | |||
High Up-Front CAPEX Versus Modern PLC and SCADA Alternatives
A mid-scale food or chemical plant still needs USD 15 million to USD 25 million for a greenfield DCS package, while a PLC-SCADA bundle can deliver most functions at half the cost. Gartner’s 2025 survey showed that 38% of projects with fewer than 3,000 I/O chose PLC architectures to conserve capital for later digital analytics. The gap narrows in plants above 10,000 I/O, where shared historians reduce per-loop DCS costs to levels lower than those of distributed PLC networks, yet small operators often lack the balance-sheet strength to fund the larger initial outlay. Hybrid topologies that pair PLCs for discrete tasks with a slimmed-down DCS core ease the burden but introduce integration complexity. Until equipment vendors or lenders offer new financing models, sticker shock will keep some brownfield owners on aging control systems.
Scarcity of DCS-Certified Engineers and Lifecycle Service Staff
Universities in North America and Europe graduated 22% fewer control-engineering majors in 2024 than in 2019, while retirement among legacy-system veterans accelerates. Emerson’s 2025 workforce survey found that 43% of users now outsource alarm rationalization and patching because internal teams lack the skills. Recruiting a DCS specialist can take 18 to 24 months, inflating project timelines and forcing reliance on vendor service contracts that raise annual maintenance costs by up to 35%. Training academies run by Yokogawa and ABB shorten the learning curve, but the programs still pull engineers off revenue work for half a year. The talent gap, therefore, slows modernization rollouts and heightens switching costs, reinforcing incumbent vendor positions.
*Our forecasts treat driver/restraint impacts as directional, not additive. The impact forecasts reflect baseline growth, mix effects, and variable interactions.
Segment Analysis
By Component: Hardware Anchors Spending While Software Accelerates
Hardware accounted for 56.71% of 2025 revenue, capturing the largest distributed control system market share because controller cabinets, I/O racks, and redundant power supplies remain top priorities in every greenfield budget. Vendors defend those margins by bundling pre-wired marshalling panels and marine-rated enclosures that withstand extreme temperatures, vibration, and corrosive gases. Even so, software posted the swiftest compound growth of 5.89% as edge historians and containerized analytics displace monolithic on-premises databases. Operators now stream-filter high-frequency sensor data on-site, forward only anomalies to cloud data lakes, and subscribe to model-predictive control or digital twin apps on demand. This shift converts capex into opex, extends customer lock-in, and smooths suppliers' revenue.
Services, wrapped around lifecycle support, cybersecurity patching, and alarm management, rise steadily but face price pressure as user teams learn to perform basic firmware updates in-house. Software’s ascent therefore reshapes vendor profit pools, pushing differentiation toward intellectual property rather than sheet metal. Looking ahead, the distributed control system market size for software is set to widen as green-hydrogen, carbon-capture, and continuous-manufacturing projects specify historian-as-a-service contracts in bid documents. Hardware will remain essential, yet its share will inch lower as controller density grows and prices flatten.


By Architecture: Hybrid Configurations Balance Uptime And Flexibility
Hybrid and distributed-hybrid systems accounted for 47.33% of 2025 revenue, reflecting user demand for field-level resilience combined with centralized optimization. In these topologies, basic regulatory loops run on ruggedized controllers near the process, while advanced analytics run on high-availability servers in the control room or in the cloud. The arrangement cuts plantwide network traffic by 30%, eases phased upgrades, and slots neatly into IEC 62443 zone-and-conduit models. Centralized legacy platforms remain in older refineries and power plants, but most brownfields now move toward hybrid as soon as turnaround windows open.
Fully redundant high-availability designs remain mandatory for nuclear, offshore LNG, and large petrochemical facilities, preserving a premium hardware tier complete with triple-modular voting and dual-ring networks. Yet the cost gap narrows as hybrid deployments layer software redundancy on commodity compute nodes, making them attractive to midsize mines and pulp mills. Over the forecast, hybrid growth at a 5.83% CAGR will keep its distributed control system market share in the lead, while centralized systems gradually taper as spares become scarce. The mix ultimately favors modular, service-heavy revenue streams and shortens patch cycles from annual to quarterly cadence.
By Deployment Model: Cloud And Edge Carve Out A Viable Niche
On-premises installations accounted for 86.23% of 2025 revenue because deterministic latency and air-gap rules dominate in oil, gas, power, and chemicals. Plants running 10,000 control loops with sub-50-millisecond response times simply cannot tolerate variable internet delays. Nonetheless, cloud and edge-hosted configurations expanded at a 5.67% CAGR from a 13.77% base, driven by water utilities, food processors, and modular biopharma skids. These users offload historian storage, alarm analytics, and reporting to Amazon Web Services or Microsoft Azure, yet keep safety-instrumented logic local.
The hybrid cloud pattern lowers capital outlay by up to 45% for sub-5,000 I/O sites, compressing commissioning timelines from 18 to nine months. Cyber-insurance carriers, however, now demand encrypted VPNs, intrusion-detection appliances, and annual penetration tests, adding new opex lines that flow to managed-service providers. Over the outlook, on-premises will still capture the bulk of the distributed control system market, but cloud-tethered edge nodes will capture most incremental growth, especially in regions where grid tariffs favor flexible production.
By Industry Vertical: Pharmaceuticals Sets The Pace, Oil And Gas Keeps Scale
Oil and gas accounted for 31.24% of 2025 revenue, driven by upstream well control, midstream pipeline automation, and refinery modernization. Yet pharmaceuticals and life sciences are sprinting ahead with a 7.09% CAGR as continuous manufacturing, inline release testing, and 21 CFR Part 11 compliance become standard line-item requirements. Each new bio-reactor train embeds skid-mounted controllers linked via deterministic Ethernet, lifting the distributed control system market size per square foot versus older batch suites.
Power generation, chemicals, and mining still contribute double-digit percentages, propelled by coal-to-wind conversions, ethylene-cracker revamps, and remote-operations centers controlling autonomous fleets. Pulp, paper, food, and water follow, with sustainability mandates that justify DCS retrofits in plants formerly run on PLC-SCADA systems. The vertical mosaic raises switching costs and allows incumbents to tailor domain libraries, amine scrubbers for carbon capture, perfusion loops for biologics, mixed refrigerant for LNG to lock in long-run service revenue. Pharmaceuticals will keep the growth crown, yet oil and gas will remain the volume backbone, stabilizing supplier order books during commodity cycles.
By Plant Size: Small Installations Embrace Subscription Economics
Large facilities above 15,000 I/O retained 46.74% of 2025 revenue because refineries, LNG trains, and combined-cycle stations still require triple-modular voting and hot-standby consoles to meet 99.99% uptime covenants. Even so, plants under 5,000 I/O are expanding at the fastest 5.86% clip as modular hydrogen stations, micro-liquefaction skids, and specialty-chemical batches favor cloud-native packages billed by the tag. Vendors ship controller firmware that auto-registers with a secure tenant in the cloud, letting users stand up historian dashboards in days.
The pay-as-you-go model trims upfront spend by 40% but adds a steady subscription stream that strengthens supplier lifetime value. Medium plants spanning 5,000 to 15,000 I/O occupy the middle ground, blending edge gateways with centralized servers and often adopting hybrid architectures during phased retrofits. As more start-ups and regional players chase energy transition niches, the distributed control system market share attributable to small-plant packages will widen, even if absolute hardware outlays stay skewed to mega-sites. Long term, size‐based segmentation will mirror cloud adoption, with the smallest facilities leading every new consumption-based experiment and the largest holding fast to deterministic, on-premise resilience.
Geography Analysis
Asia-Pacific led the distributed control System market share with 38.92% of 2025 revenue, supported by a wave of petrochemical mega-complexes in China, India’s coal-to-renewables conversions, and Japan’s aging-plant upgrades. Zhejiang Petrochemical’s 40-million-ton-per-year complex in Zhoushan runs a domestic WebField platform, validating cost-focused regional suppliers. In India, NTPC’s retrofit program for 18 GW of coal capacity adopted indigenized SIMATIC PCS 7 builds to satisfy Make-in-India rules, while Japanese refiners deploy Yokogawa digital twins to extend asset life and defer multibillion-dollar rebuilds.
North America and Europe each supplied roughly one quarter of global spending as operators overlaid digital twins on brownfields and built new green-hydrogen and carbon-capture units. U.S. Gulf Coast plants integrated amine-scrubber loops with existing controllers to secure Internal Revenue Service 45Q tax credits, while Canadian nuclear refurbishments selected safety-qualified Ovation systems that lift per-megawatt automation budgets by 50%. Europe’s Fit for 55 carbon-border plan forced refiners to automate emissions monitoring, prompting BASF to adopt PCS 7 upgrades that auto-generate EU ETS reports.
The Middle East recorded the fastest 6.22% regional CAGR, driven by Saudi Aramco’s Jafurah unconventional gas project, ADNOC’s Ruwais refinery expansion, and Qatar’s North Field East LNG trains. Each site specified quadruple-redundant, marine-class hardware to handle high ambient temperatures and sour-gas corrosion, inflating the regional distributed control system market size even as volumes remain lower than in Asia. South America and Africa contributed a smaller but rising share: Petrobras wired pre-salt platforms for remote operations from Rio de Janeiro, and copper mines in Chile and Zambia adopted edge-connected architectures to cut on-site headcount.

Competitive Landscape
Five incumbents, ABB, Emerson, Honeywell, Siemens, and Yokogawa, held about 60% to 65% of global revenue in 2025, securing the core of the market through proprietary fieldbuses, multi-decade service contracts, and extensive installed bases. Each vendor now bundles edge analytics, historian subscriptions, and cybersecurity monitors, converting episodic capital sales into recurring revenue streams. The strategy shields margins even as average selling prices for hardware flatten.
Regional challengers such as Supcon, Hollysys, and Valmet win cost-sensitive bids in China, pulp, and forestry, yet their global reach is limited by narrower service networks and slower IEC 62443 certification. Hyperscale cloud providers, Amazon Web Services, Microsoft Azure, and Google Cloud, capture supervisory workloads but still rely on deterministic field controllers supplied by the automation majors, creating a co-opetition dynamic rather than direct substitution. Cybersecurity specialists like Claroty and Dragos offer vendor-agnostic intrusion detection that overlays legacy systems, pressuring the big five to embed similar functions in flagship releases.
Mergers and acquisitions continue to tighten portfolios: Emerson absorbed AspenTech to fold advanced process control into DeltaV, and Schneider consolidated AVEVA to align historian, visualization, and analytics with Foxboro hardware. Patent activity focuses on domain-specific libraries, such as ABB’s amine-scrubber optimization or Honeywell’s LNG mixed-refrigerant control, raising switching costs for end users. With the top players controlling roughly two-thirds of spend yet facing credible regional and niche software rivals, overall rivalry remains moderate rather than cut-throat, and service differentiation outweighs price as the primary competitive lever.
Distributed Control System Industry Leaders
ABB Ltd.
Emerson Electric Co.
Honeywell International Inc.
Siemens AG
Yokogawa Electric Corporation
- *Disclaimer: Major Players sorted in no particular order

Recent Industry Developments
- February 2026: Yokogawa won a USD 210 million order from Saudi Aramco for CENTUM VP across Jafurah’s gas-processing trains, embedding edge analytics for predictive maintenance and meeting local-content rules.
- January 2026: Emerson released DeltaV Edge Environment 2.0 on Amazon Web Services, cutting initial capital by 45% for sub-5,000 I/O plants and halving commissioning time.
- December 2025: Siemens finished a EUR 95 million (USD 102 million) SIMATIC PCS 7 upgrade at BASF’s Ludwigshafen site, boosting ethylene yield by 1.8 percentage points and automating EU ETS compliance reporting.
- November 2025: Honeywell secured a USD 175 million Experion PKS contract for ADNOC’s Ruwais refinery expansion, adding marine-class I/O cards and quadruple-redundant controllers.


Global Distributed Control System Market Report Scope
The Distributed Control System Report is Segmented by Component (Hardware, Software, Services), Architecture (Centralized Controller Systems, Hybrid/Distributed Hybrid Systems, Fully Redundant High-Availability Systems), Deployment Model (On-Premise, and Cloud/Edge-Hosted), Industry Vertical (Power Generation, Oil and Gas, Chemicals and Petrochemicals, Mining and Metals, Pulp and Paper, Pharmaceuticals and Life Sciences, Food and Beverage, Water and Wastewater, Other Industry Verticals), Plant Size (Small (Below 5,000 I/O), Medium (5,000–15,000 I/O), Large (Above15,000 I/O)), and Geography (North America, South America, Europe, Asia-Pacific, Middle East and Africa). The Market Forecasts are Provided in Terms of Value (USD).
| Hardware |
| Software |
| Services |
| Centralized Controller Systems |
| Hybrid / Distributed Hybrid Systems |
| Fully Redundant High-Availability Systems |
| On-Premise |
| Cloud / Edge-Hosted |
| Power Generation |
| Oil and Gas |
| Chemicals and Petrochemicals |
| Mining and Metals |
| Pulp and Paper |
| Pharmaceuticals and Life Sciences |
| Food and Beverage |
| Water and Wastewater |
| Other Industry Verticals |
| Small (Below 5,000 I/O) |
| Medium (5,000–15,000 I/O) |
| Large (Above15,000 I/O) |
| North America | United States | |
| Canada | ||
| Mexico | ||
| South America | Brazil | |
| Argentina | ||
| Rest of South America | ||
| Europe | United Kingdom | |
| Germany | ||
| France | ||
| Italy | ||
| Rest of Europe | ||
| Asia-Pacific | China | |
| Japan | ||
| India | ||
| South Korea | ||
| Rest of Asia-Pacific | ||
| Middle East and Africa | Middle East | United Arab Emirates |
| Saudi Arabia | ||
| Rest of Middle East | ||
| Africa | South Africa | |
| Egypt | ||
| Rest of Africa | ||
| By Component | Hardware | ||
| Software | |||
| Services | |||
| By Architecture | Centralized Controller Systems | ||
| Hybrid / Distributed Hybrid Systems | |||
| Fully Redundant High-Availability Systems | |||
| By Deployment Model | On-Premise | ||
| Cloud / Edge-Hosted | |||
| By Industry Vertical | Power Generation | ||
| Oil and Gas | |||
| Chemicals and Petrochemicals | |||
| Mining and Metals | |||
| Pulp and Paper | |||
| Pharmaceuticals and Life Sciences | |||
| Food and Beverage | |||
| Water and Wastewater | |||
| Other Industry Verticals | |||
| By Plant Size | Small (Below 5,000 I/O) | ||
| Medium (5,000–15,000 I/O) | |||
| Large (Above15,000 I/O) | |||
| By Geography | North America | United States | |
| Canada | |||
| Mexico | |||
| South America | Brazil | ||
| Argentina | |||
| Rest of South America | |||
| Europe | United Kingdom | ||
| Germany | |||
| France | |||
| Italy | |||
| Rest of Europe | |||
| Asia-Pacific | China | ||
| Japan | |||
| India | |||
| South Korea | |||
| Rest of Asia-Pacific | |||
| Middle East and Africa | Middle East | United Arab Emirates | |
| Saudi Arabia | |||
| Rest of Middle East | |||
| Africa | South Africa | ||
| Egypt | |||
| Rest of Africa | |||


Key Questions Answered in the Report
What is the projected CAGR for distributed control systems through 2031?
Global revenue is forecast to grow at a 5.29% CAGR between 2026 and 2031.
Which region currently generates the largest share of revenue?
Asia-Pacific contributed 38.92% of worldwide revenue in 2025.
Which geography is expected to grow the fastest over the forecast period?
The Middle East is projected to deliver the highest regional expansion, registering a 6.22% CAGR through 2031.
Why is software spending rising more quickly than hardware?
Operators are adopting containerized analytics and cloud-hosted historian modules, driving software to the fastest 5.89% CAGR while hardware remains the revenue anchor.
How are pharmaceuticals influencing demand?
Continuous-manufacturing lines and real-time release testing requirements push pharmaceuticals and life sciences to the leading 7.09% CAGR, outpacing traditional oil and gas projects.
What major obstacle limits adoption in smaller plants?
High up-front capital still deters many sub-5,000 I/O facilities, although cloud and edge-hosted deployments reduce initial costs by up to 45%.
Page last updated on:


