Digital BSS Market Size and Share
Market Overview
| Study Period | 2019 - 2030 |
|---|---|
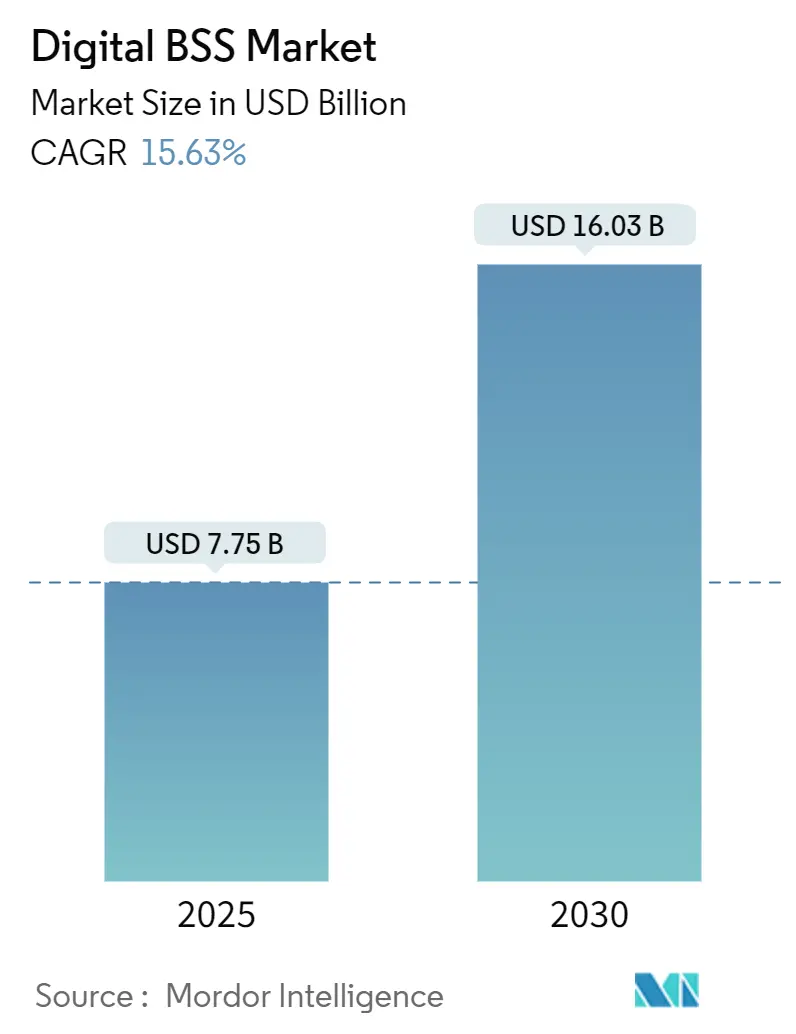
| Market Size (2025) | USD 7.75 Billion |
| Market Size (2030) | USD 16.03 Billion |
| Growth Rate (2025 - 2030) | 15.63% CAGR |
| Fastest Growing Market | Asia Pacific |
| Largest Market | North America |
| Market Concentration | Medium |
Major Players *Disclaimer: Major Players sorted in no particular order Image © Mordor Intelligence. Reuse requires attribution under CC BY 4.0. | |
Digital BSS Market Analysis by Mordor Intelligence
The Digital BSS market size stands at USD 7.75 billion in 2025 and is projected to reach USD 16.03 billion by 2030, advancing at a 15.63% CAGR. Robust demand for cloud-native monetization platforms, rapid 5G standalone roll-outs, and the emergence of multi-party settlement models are accelerating vendor revenue streams. Operators are dismantling legacy billing stacks that cannot process millisecond-level events, while hyperscale cloud alliances reduce time-to-market for new services. Heightened revenue-leakage risks, estimated at USD 38.95 billion in 2023, amplify spending on fraud management and convergent revenue assurance. Across verticals, smart-meter roll-outs in utilities, subscription growth in media, and usage-based pricing in transport broaden the Digital BSS market opportunity. Strategic consolidation illustrated by Oracle, Ericsson, and Amdocs—accelerates platform innovation and ecosystem depth.
Key Report Takeaways
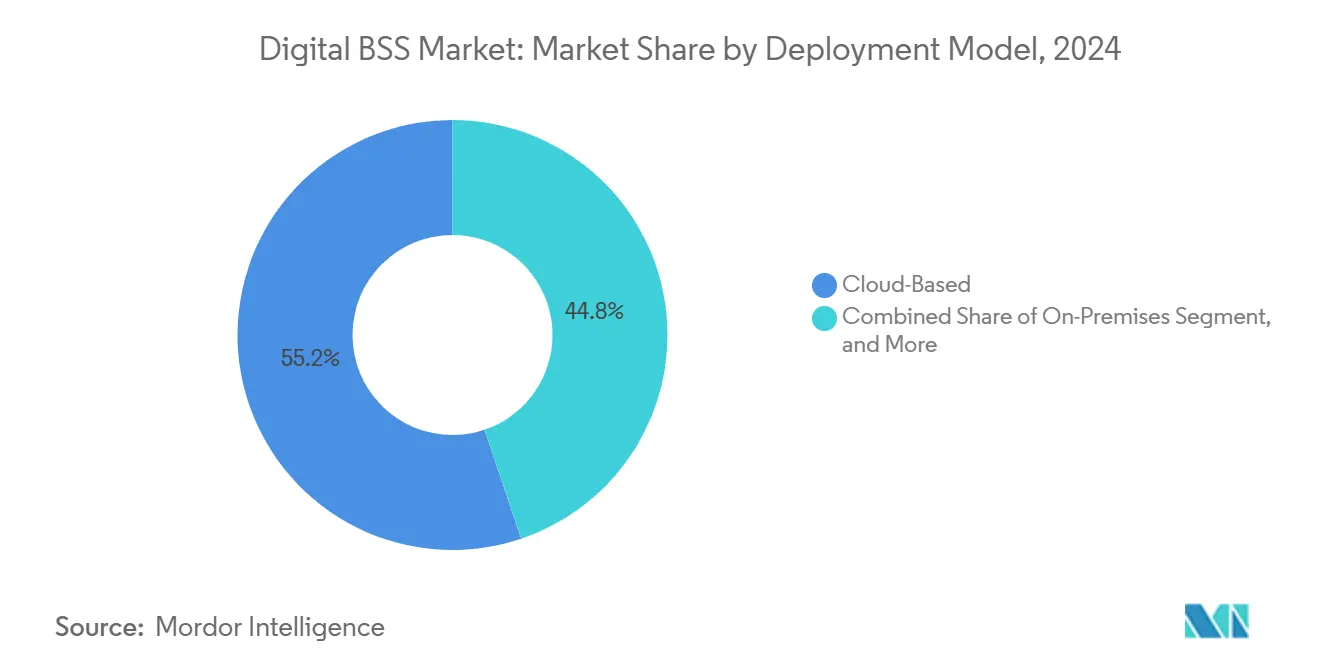
- By deployment model, cloud-based solutions led with 55.19% revenue share in 2024, whereas hybrid architectures are expanding at a 16.36% CAGR through 2030.
- By solution type, billing and charging held 68.46% of Digital BSS market share in 2024, while fraud management is advancing at a 15.79% CAGR.
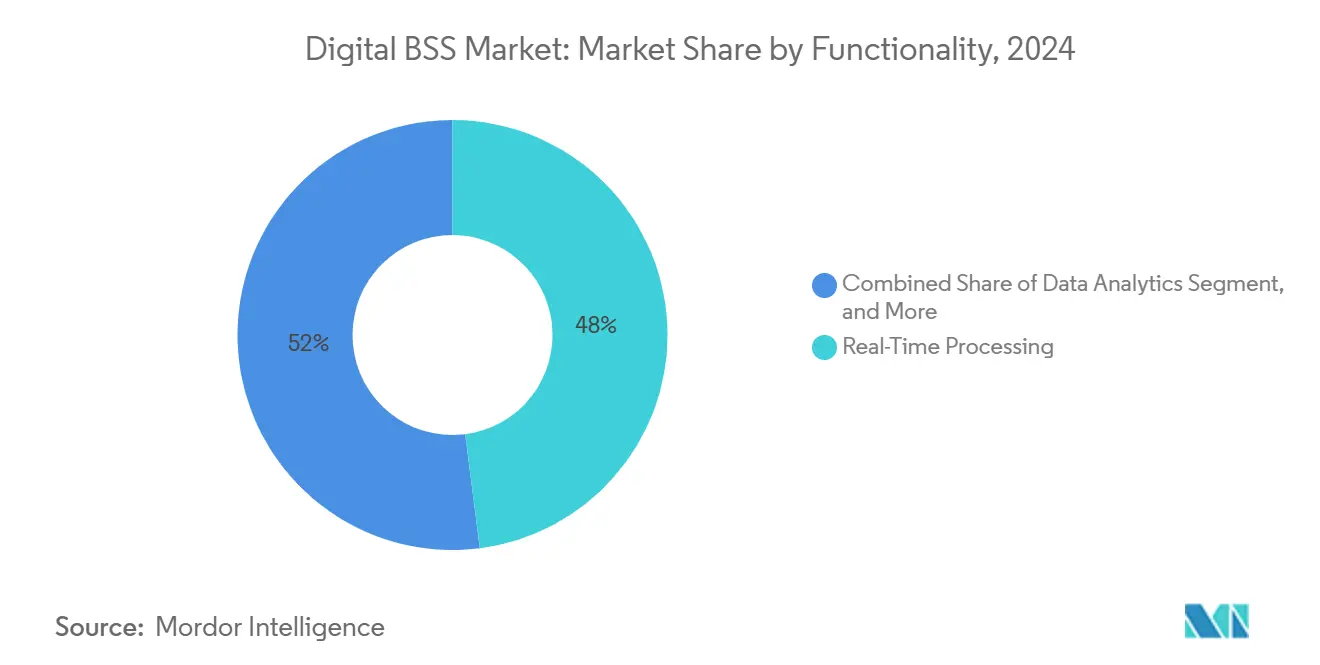
- By functionality, real-time processing accounted for 47.98% of the Digital BSS market size in 2024; data analytics is projected to scale at a 16.13% CAGR to 2030.
- By end user, telecommunications retained 61.73% share of the Digital BSS market size in 2024, whereas utilities segment demand is growing at a 16.77% CAGR.
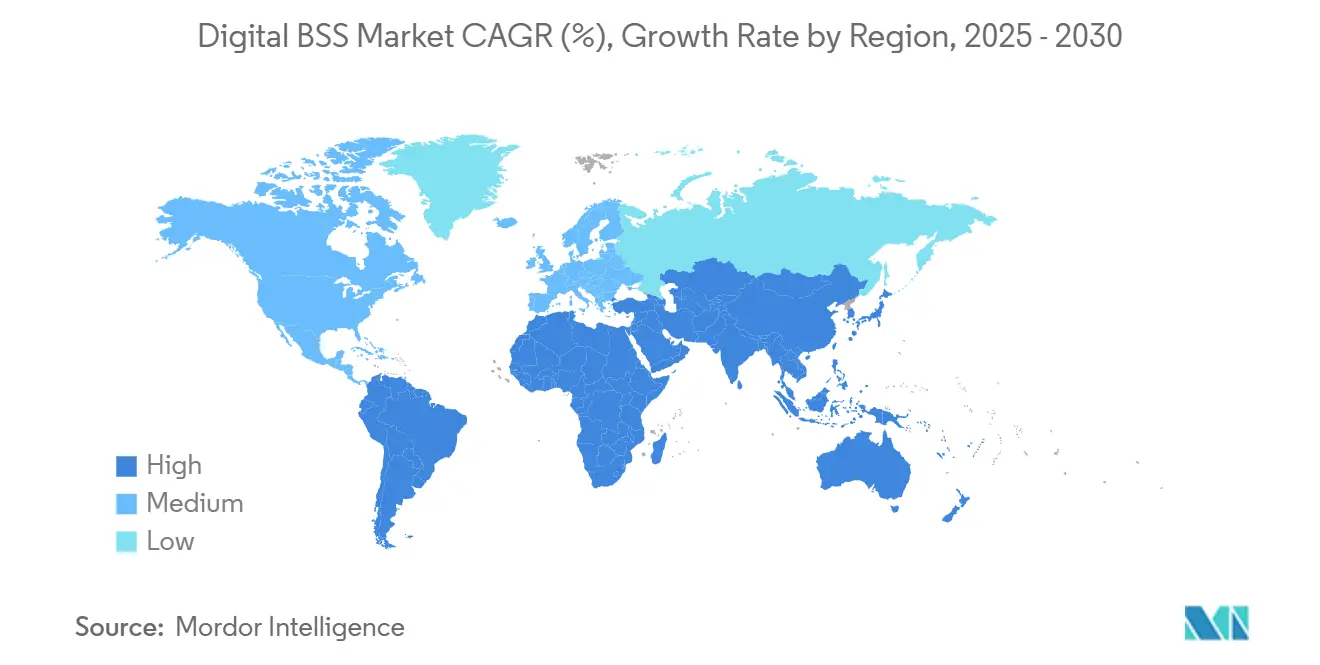
- By geography, North America commanded 32.89% Digital BSS market share in 2024; Asia-Pacific is expected to rise at a 15.84% CAGR through 2030.
Global Digital BSS Market Trends and Insights
Drivers Impact Analysis*
| Driver | ( ~ ) % Impact on CAGR Forecast | Geographic Relevance | Impact Timeline |
|---|---|---|---|
| Rapid 5G roll-outs requiring real-time monetization | +3.2% | Global; early gains in Asia-Pacific and North America | Medium term (2-4 years) |
| Accelerated shift to cloud-native BSS architectures | +2.8% | Global | Medium term (2-4 years) |
| Rising demand for convergent billing and revenue assurance | +2.1% | Global | Short term (≤ 2 years) |
| Digital-first CX programs across CSPs | +1.9% | Global | Short term (≤ 2 years) |
| B2B2X ecosystems demanding multi-party settlement | +1.7% | North America and EU; spill-over to Asia-Pacific | Long term (≥ 4 years) |
| Usage-based pricing in utilities and transport | +1.4% | Global; early gains in Europe, North America | Long term (≥ 4 years) |
| Source: Mordor Intelligence | |||
Rapid 5G Roll-outs Requiring Real-Time Monetization
Edge-enabled 5G slicing mandates millisecond-level charging to bill dynamic resource allocations. Ericsson surpassed its 50th 5G charging customer, supporting 3 billion subscribers on multi-party schemes. [1]“Ericsson Celebrates 50th 5G Charging CSP Customer,” Ericsson, ericsson.com Indosat Ooredoo Hutchison migrated 100 million subscribers to a full-stack digital platform in 18 days, showcasing operational agility in Asia-Pacific. Network-as-a-service models for manufacturing and autonomous vehicles amplify the Digital BSS market’s revenue upside. Operators now prioritize charging engines that integrate network exposure APIs, unlocking granular QoS-linked tariffs. These monetization capabilities redefine BSS procurement criteria toward real-time policy enforcement at the edge.
Accelerated Shift to Cloud-Native BSS Architectures
Operators gain up to 75% OPEX savings by containerizing billing workloads and leveraging public cloud elasticity. [2]“Next-Gen BSS: Billing in the Cloud Brings Performance & Cost Benefits,” Netcracker, netcracker.comTelefónica Germany executed a full core shift to AWS, validating public cloud readiness for mission-critical telecom loads. Microservices frameworks such as Amdocs Microservices360 simplify continuous delivery and blue-green upgrades. Elastic scaling during traffic peaks curbs costly over-provisioning that plagued monolith architectures. Collectively, these efficiencies compress service-launch cycles from months to weeks, sustaining double-digit Digital BSS market growth.
Rising Demand for Convergent Billing and Revenue Assurance
SIM-box and roaming fraud drained USD 38.95 billion from operator revenues in 2023. [3]“How ActivML Detects SIM Box Fraud with Machine Learning,” Neural Technologies, neuralt.comActivML analytics attain 98% anomaly-detection accuracy, demonstrating real-time loss protection. Convergent billing unifies prepaid, postpaid, and digital-service charges within single customer hierarchies, reducing reconciliation delays. Utilities such as BSES Delhi recorded a 50% jump in online payments after adopting digital billing portals. Unified ledgers also enable cross-service discounts that lift ARPU and reduce churn.
Digital-First CX Programs Across CSPs
Generative AI assistants personalize care journeys and streamline ticket resolution. Amdocs’ amAIz Suite improved customer satisfaction by 45% while automating 60% of queries at Vodafone. Predictive models forecast usage spikes, facilitating proactive bandwidth allocation. DNA processed 98% of orders in 35 seconds after migrating to TCS HOBS, underscoring the latency savings inherent in digital processes. Superior CX directly correlates with lower churn, sharpening competitive differentiation in saturated markets.
Restraints Impact Analysis*
| Restraint | ( ~ ) % Impact on CAGR Forecast | Geographic Relevance | Impact Timeline |
|---|---|---|---|
| Legacy IT complexity and integration risk | -2.4% | Global; acute in North America, Europe | Short term (≤ 2 years) |
| High capex/opex of large-scale transformations | -1.8% | Global | Medium term (2-4 years) |
| Scarcity of cloud-native BSS talent | -1.1% | Global; critical shortages in Asia-Pacific | Medium term (2-4 years) |
| CSP tech-debt and vendor lock-in | -0.9% | Global; mature markets | Long term (≥ 4 years) |
| Source: Mordor Intelligence | |||
Legacy IT Complexity and Integration Risk
Airtel Sri Lanka sunset 35 applications while reducing hardware by 60%, illustrating the migration burden legacy stacks impose. Operators juggle parallel run periods to prevent subscriber disruption, heightening project risk. Regulatory audits further complicate data-migration timelines, especially under multi-country mandates. Custom in-house OSS at Deutsche Telekom shows how bespoke compliance needs prolong modernization. These intricacies delay Digital BSS market deployments and inflate consulting expenditure.
High Capex/Opex of Large-Scale Transformations
Tier-1 transformations surpass USD 100 million over 3–5 years amid shrinking capital-intensity ratios. Energy-price inflation added 43% to network operating costs between 2020 and 2023, crowding budgets for BSS upgrades. Nevertheless, unified platforms can repay investments quickly; one European carrier saved EUR 4 million in year-one OPEX after deploying a consolidated BSS stack. Smaller operators remain capital-constrained, widening the modernization gap.
*Our forecasts treat driver/restraint impacts as directional, not additive. The impact forecasts reflect baseline growth, mix effects, and variable interactions.
Segment Analysis
By Deployment Model: Hybrid Architectures Drive Strategic Flexibility
Hybrid deployments constitute the fastest-growing model at a 16.36% CAGR, reflecting a nuanced response to sovereignty and latency requirements. Although cloud-based platforms held 55.19% of 2024 revenue, many operators retain critical rating engines on-premises to mitigate regulatory exposure. This blended stance supports elastic scaling and micro-burst billing without surrendering sensitive data. The Digital BSS market size tied to hybrid models is poised to expand as telcos emulate Deutsche Telekom’s Google Cloud alliance for 5G Core.
Operators with entrenched private infrastructures are re-architecting toward container clusters that federate across private and public clouds. Ericsson’s hybrid solutions orchestrate workload placement by policy, aligning compute cost with revenue yield. On-premises footprints persist for ultra-low-latency edge charging, yet their growth curve lags due to high refresh costs. Consequently, the Digital BSS market will increasingly skew toward hybrid services that optimize compliance and efficiency in tandem.


By Solution Type: Fraud Management Accelerates Amid Revenue Protection Urgency
Billing and charging platforms dominated at 68.46% market share in 2024, anchoring enterprise-grade monetization. However, fraud management is scaling fastest at 15.79% CAGR as operators confront mounting leakage. The Digital BSS market size attributed to fraud solutions is widening on AI adoption that cuts false positives and automates investigation triage.
Convergent customer and order-management modules also gain traction, fueled by omnichannel experience mandates. Optiva’s generative AI now auto-configures dynamic offers, signaling convergence between product catalog and charging orchestration. Integrated suites lower integration overhead, encouraging operators to consolidate procurement under fewer vendors and driving incremental platform revenue.
By Functionality: Data Analytics Transforms Operational Intelligence
Real-time processing retained 47.98% market share in 2024, underscoring non-negotiable millisecond charging in 5G SA. Yet data analytics is expanding at a 16.13% CAGR, elevating predictive intelligence from siloed dashboards to embedded decision engines. Dynamic offer management and churn-risk scoring exemplify analytic monetization pathways that enlarge the Digital BSS market.
Ericsson’s Operations Engine cut complaint resolution times by 90% for Digital Nasional Berhad, validating AI’s operational benefit. Pairing stream analytics with exposure APIs allows operators to offer SLA-based products that command premium margins. As analytic toolchains mature, customer-interaction modules ingest insights to tailor care journeys, reinforcing virtuous CX cycles.
By End User: Utilities Drive Cross-Industry BSS Adoption
Telecommunications preserved 61.73% of 2024 revenue, yet utilities exhibit the steepest expansion at 16.77% CAGR on smart-grid roll-outs. The Digital BSS market size within utilities surges as real-time meter data requires high-frequency rating and settlement. Unified billing across electricity, gas, and water enhances customer transparency and reduces back-office cost.
Media, entertainment, and logistics verticals adopt subscription, pay-per-use, and mobility bundles that mirror telco billing complexity. LOGPAY’s platform blends tolling and fuel payments under one ledger, illustrating multi-tenant BSS value. This cross-industry pivot diversifies vendor addressable markets and cushions telco revenue cyclicality.
Geography Analysis
North America’s Digital BSS market size remains the largest, sustained by 32.89% revenue share in 2024. Tier-1 carriers pursue fiber and MVNO growth that demands unified rating across wireline and wireless. Amdocs’ connectX platform enables rapid influencer-brand launches, underscoring SaaS appeal among U.S. operators. Oracle’s 49% cloud-infrastructure surge evidences hyperscale-driven BSS adoption.
Asia-Pacific registers the quickest climb, advancing at 15.84% CAGR to 2030. Subscriber densification and IoT proliferation across Japan and Southeast Asia catalyze near-real-time charging requirements. Indosat’s 100 million-user migration and NTT’s Infonova revamp illustrate cloud-native momentum. Government 5G funding accelerates operator timelines, elevating Asia-Pacific as a prime testbed for generative-AI-driven CX.
Europe’s Digital BSS landscape reflects sophisticated hybrid strategies balancing GDPR compliance with agility. Deutsche Telekom’s OneExperience and Orange’s Bleu cloud signal sovereign-cloud innovation. Vodafone Germany’s EUR 250 million B2B pivot leverages cybersecurity and IoT bundles that rely on convergent billing. Fiber decommissioning of legacy copper networks heightens demand for migration-ready BSS to manage dual-technology billing.

Competitive Landscape
Market incumbents exhibit moderate consolidation, with Oracle, Ericsson, and Amdocs extending portfolios via acquisitions, cloud alliances, and generative-AI integrations. Oracle’s multicloud pact with AWS alleviates lock-in concerns while broadening deployment choice. Ericsson’s Telco DataOps platform embeds AI across OSS and BSS layers, deepening differentiation.
Smaller vendors exploit API-first microservices to penetrate niche functions such as AI fraud analytics and B2B2X settlement, mitigating incumbent dominance. TM Forum open APIs ease multi-vendor orchestration, prompting operators to adopt best-of-breed components. Vertical-specific offers for utilities, transport, and media create whitespace for specialized entrants. As telcos pivot to ecosystem orchestrators, vendor success hinges on modularity, AI co-innovation, and sovereign-cloud readiness.
Digital BSS Industry Leaders
Amdocs Limited
Ericsson AB
Huawei Technologies Co., Ltd.
Netcracker Technology Corporation
CSG Systems International, Inc.
- *Disclaimer: Major Players sorted in no particular order


Recent Industry Developments
- July 2025: SS&C Technologies to acquire Calastone for GBP 766 million (USD 966 million).
- June 2025: Vodafone Germany unlocks next-level network automation via digital twins.
- June 2025: Ericsson unveils Telco DataOps Platform and Intelligent IT Suite.
- March 2025: Zain KSA completes major Netcracker-led digital transformation.


Global Digital BSS Market Report Scope
| On-Premises |
| Cloud-Based |
| Hybrid |
| Billing and Charging Solutions |
| Customer Management Solutions |
| Order Management Solutions |
| Fraud Management Solutions |
| Real-Time Processing |
| Data Analytics |
| Customer Interaction Management |
| Telecommunications |
| Utilities |
| Media and Entertainment |
| Transportation and Logistics |
| North America | United States | |
| Canada | ||
| Mexico | ||
| South America | Brazil | |
| Argentina | ||
| Rest of South America | ||
| Europe | Germany | |
| United Kingdom | ||
| France | ||
| Russia | ||
| Rest of Europe | ||
| Asia-Pacific | China | |
| Japan | ||
| India | ||
| South Korea | ||
| Australia | ||
| Rest of Asia-Pacific | ||
| Middle East and Africa | Middle East | Saudi Arabia |
| United Arab Emirates | ||
| Rest of Middle East | ||
| Africa | South Africa | |
| Egypt | ||
| Rest of Africa | ||
| By Deployment Model | On-Premises | ||
| Cloud-Based | |||
| Hybrid | |||
| By Solution Type | Billing and Charging Solutions | ||
| Customer Management Solutions | |||
| Order Management Solutions | |||
| Fraud Management Solutions | |||
| By Functionality | Real-Time Processing | ||
| Data Analytics | |||
| Customer Interaction Management | |||
| By End User | Telecommunications | ||
| Utilities | |||
| Media and Entertainment | |||
| Transportation and Logistics | |||
| By Geography | North America | United States | |
| Canada | |||
| Mexico | |||
| South America | Brazil | ||
| Argentina | |||
| Rest of South America | |||
| Europe | Germany | ||
| United Kingdom | |||
| France | |||
| Russia | |||
| Rest of Europe | |||
| Asia-Pacific | China | ||
| Japan | |||
| India | |||
| South Korea | |||
| Australia | |||
| Rest of Asia-Pacific | |||
| Middle East and Africa | Middle East | Saudi Arabia | |
| United Arab Emirates | |||
| Rest of Middle East | |||
| Africa | South Africa | ||
| Egypt | |||
| Rest of Africa | |||


Key Questions Answered in the Report
What is the projected revenue of the Digital BSS market by 2030?
The Digital BSS market is forecast to reach USD 16.03 billion by 2030 at a 15.63% CAGR.
Which deployment model is growing fastest in Digital BSS solutions?
Hybrid architectures are expanding most rapidly at a 16.36% CAGR as operators blend on-premises control with cloud scalability.
Why are utilities adopting Digital BSS platforms?
Smart-meter roll-outs and dynamic energy pricing require real-time rating and multi-utility convergence, driving a 16.77% CAGR for utilities.
Which region offers the highest growth potential for Digital BSS vendors?
Asia-Pacific leads with a 15.84% CAGR through 2030, propelled by 5G monetization across Japan, South Korea, and Southeast Asia.
How are AI capabilities influencing Digital BSS adoption?
Generative AI enhances customer experience, fraud detection, and offer personalization, cutting ticket resolution times by up to 90% and boosting satisfaction by 45%.
Page last updated on:


