
Digital Graphic Printing Market Size and Share
Market Overview
| Study Period | 2020 - 2031 |
|---|---|
| Market Size (2026) | USD 10.37 Billion |
| Market Size (2031) | USD 13.42 Billion |
| Growth Rate (2026 - 2031) | 5.28 % |
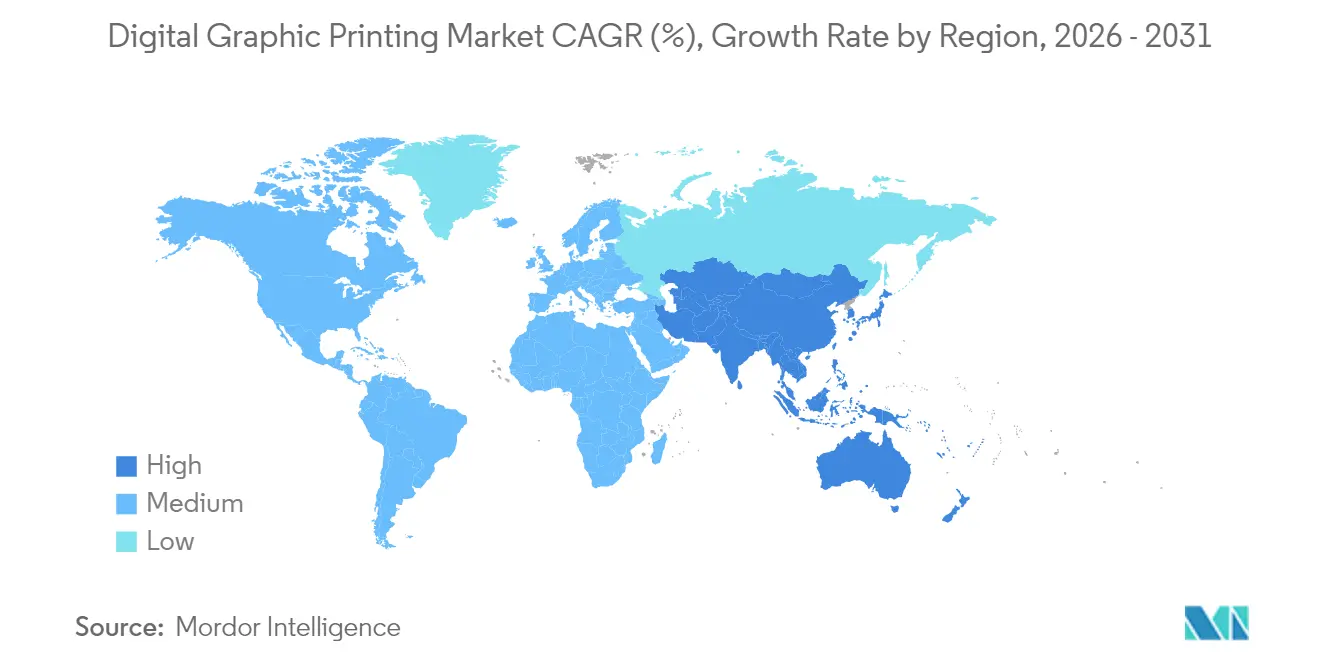
| Fastest Growing Market | Asia Pacific |
| Largest Market | North America |
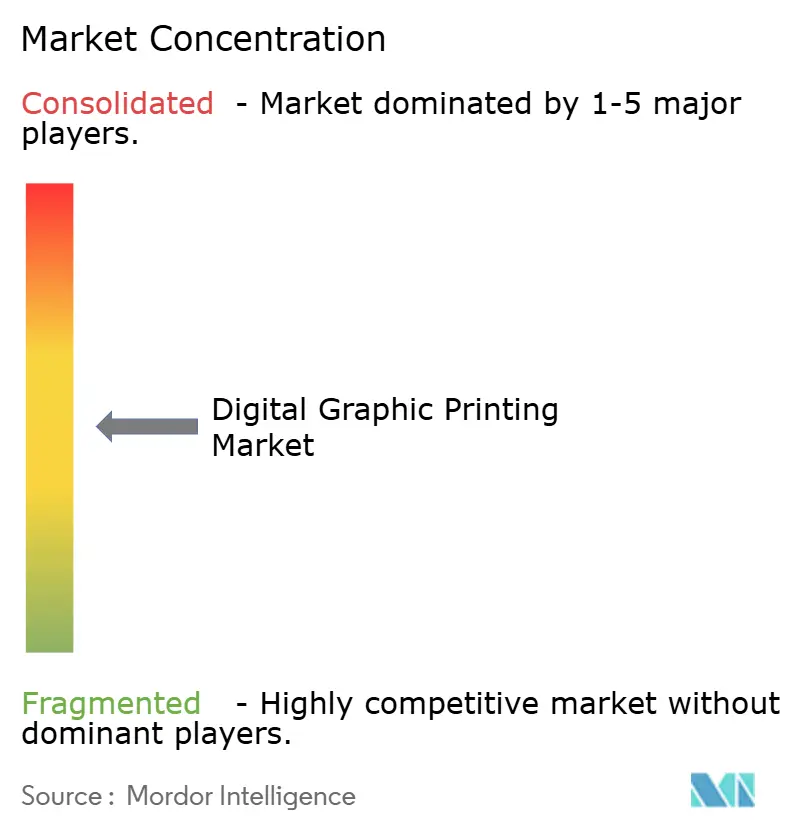
| Market Concentration | Medium |
Major Players *Disclaimer: Major Players sorted in no particular order Image © Mordor Intelligence. Reuse requires attribution under CC BY 4.0. | |
Digital Graphic Printing Market Analysis by Mordor Intelligence
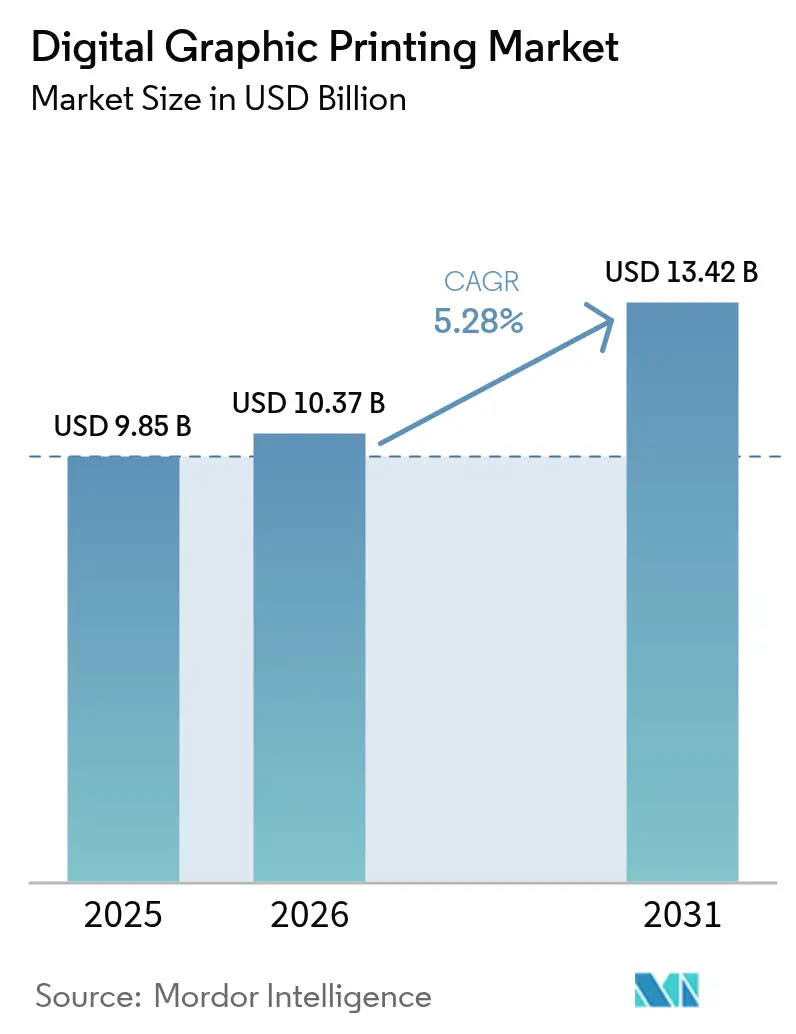
The Digital Graphic Printing market size is expected to grow from USD 9.85 billion in 2025 to USD 10.37 billion in 2026 and is forecast to reach USD 13.42 billion by 2031 at 5.28% CAGR over 2026-2031. Elevated demand for on-demand, variable-data workflows is shortening inventory cycles, enabling brands to commercialize more SKUs while curbing waste. Inkjet technology has become the process of choice because industrial platforms now print directly on offset-coated substrates without pre-treatment, reducing setup time and energy consumption per impression. E-commerce fulfillment and direct-to-consumer models are amplifying the trend, as converters need to meet orders of 500 units or less economically. Sustainability regulations in Europe and North America, including mandatory carbon-footprint disclosures on printed goods, further tilt investment toward digital presses that eliminate plate-making waste and minimize VOC emissions.
Key Report Takeaways
- By printing process, inkjet led with 62.88% revenue share in 2025, while dye-sublimation is forecast to expand at a 6.18% CAGR through 2031.
- By application, packaging captured 6.62% CAGR growth potential to 2031, compared with advertising print’s 28.10% share in 2025.
- By ink type, UV-cured ink commanded 31.40% share in 2025, whereas latex inks are projected to post the highest 7.05% CAGR during the forecast period.
- By substrate material, paper retained 47.80% share in 2025, while plastic and film substrates are advancing at 7.51% CAGR through 2031.
- By region, North America held 39.70% share in 2025, whereas Asia-Pacific is the fastest growing geography at an 7.68% CAGR to 2031.
Note: Market size and forecast figures in this report are generated using Mordor Intelligence’s proprietary estimation framework, updated with the latest available data and insights as of 2026.
Global Digital Graphic Printing Market Trends and Insights
Drivers Impact Analysis*
| Driver | (~) % Impact on CAGR Forecast | Geographic Relevance | Impact Timeline |
|---|---|---|---|
| Growing Demand for Short-Run Packaging | +0.8% | Global, concentrated in North America and Europe | Medium term (2-4 years) |
| Rising Adoption of Inkjet Technology | +1.2% | Global, led by Asia-Pacific and North America | Long term (≥ 4 years) |
| Shift Toward Personalization in Marketing Materials | +0.6% | North America and Europe, expanding to Asia-Pacific | Short term (≤ 2 years) |
| Increasing Use of UV-Cured Inks in Label Printing | +0.5% | Global, strongest in Europe and North America | Medium term (2-4 years) |
| Emergence of Hybrid Analog-Digital Press Retrofits | +0.4% | Europe and North America, early adoption in Asia-Pacific | Medium term (2-4 years) |
| Brand Mandates for Carbon Footprint Reporting | +0.3% | Europe and North America, regulatory spillover to Asia-Pacific | Long term (≥ 4 years) |
| Source: Mordor Intelligence | |||
Growing Demand for Short-Run Packaging
E-commerce and direct-to-consumer brands have reduced the economic run length for folding cartons and flexible packaging, making digital the only cost-effective method for orders below 500 units. [1]Gelato, “Industry Survey on Print Run Lengths,” GELATO.COM Landa’s S11 Nanographic press reaches 11,200 sheets per hour with optional in-line coating, allowing converters to profit from micro-batches that analog lines cannot serve competitively. Limited-edition launches now require rapid design iterations and market testing, boosting adoption of presses such as Durst’s VariJET 106, which uses water-based, food-safe inks and targets monthly capacities exceeding 1 million B1 sheets. [2]Durst, “Durst Group to launch KJet, a hybrid solution for label printing,” DURST-GROUP.COM Retailers are also tightening inventory mandates, pushing suppliers to manufacture on demand rather than warehouse excess stock. The European Union’s Packaging and Packaging Waste Regulation 2025/40 obliges converters to hit recyclability metrics, reinforcing digital’s suitability for sustainable, just-in-time production.
Rising Adoption of Inkjet Technology
Industrial inkjet has become mainstream as new inks bond directly to coated substrates, eliminating the need for costly primers. SCREEN’s Truepress JET 560HDX pairs high-density SC2 inks with a 560mm web to rival offset quality while maintaining a throughput of 150 meters per minute. Canon’s varioPRESS iV7, launched in 2024, delivers 3,000 B2 sheets per hour, enabling folding-carton printers to replace analog capacity without compromising productivity.. Konica Minolta’s AccurioJet 60000 integrates seamlessly into hybrid workflows, routing long jobs to offset and short jobs to digital for optimal cost of ownership. Fujifilm’s REVORIA PRESS GC12500 broadens toner-based options by adding specialty metallic and fluorescent colors, a niche where inkjet still trails. As buyers weigh chemistry, substrate compatibility, and automation, the competitive playing field is shifting from raw speed to holistic workflow efficiency.
Shift Toward Personalization in Marketing Materials
Variable-data printing is now baseline, with 68% of marketers tailoring print content and 91% integrating print with digital channels. HP’s Indigo 120K HD embeds AI automation, allowing one operator to oversee multiple presses running unique jobs, thereby reducing labor costs while maintaining offset-level quality. Xerox’s partnership with Screen ties FreeFlow software to Truepress engines, reducing variable-data job setup time and enhancing data security in line with the GDPR. Marketers increasingly embed QR codes and personalized URLs, driving transactional printers to blend bills with targeted offers on a single pass. Sustainability is now an integral part of personalization strategy, with ECO modes on new presses reducing carbon output without compromising throughput. Secure workflows that encrypt customer data during print preparation are becoming mandatory, especially in finance and healthcare.
Increasing Use of UV-Cured Inks in Label Printing
UV-curable inks cure instantly under LED lamps, eliminating drying time and enabling in-line finishing processes such as die-cutting and lamination. Covestro’s low-migration UV resins, introduced in 2024, meet food-safety requirements under the German Printing Ink Ordinance by minimizing photoinitiator transfer. EFI’s Nozomi LABEL series exceeds 100 meters per minute on self-adhesive labels, shrink sleeves, and in-mold applications while preserving vibrant color gamut. Brands value metallic and specialty-color effects achievable through UV layering, which are difficult with aqueous or solvent systems. However, tightening EuPIA migration limits are compelling formulators to innovate next-generation photoinitiators that balance cure speed with low extractables.
Restraints Impact Analysis*
| Restraint | (~) % Impact on CAGR Forecast | Geographic Relevance | Impact Timeline |
|---|---|---|---|
| High Initial Capital Investment | -0.7% | Global, most acute in emerging markets | Short term (≤ 2 years) |
| Volatility in Raw Material Prices for Specialty Inks | -0.5% | Global, with supply-chain concentration in Asia | Medium term (2-4 years) |
| Competitive Price Pressures From Offset Printing | -0.4% | Global, strongest in North America and Europe | Long term (≥ 4 years) |
| Rising Regulatory Scrutiny on Nanoparticle Emissions | -0.3% | Europe and North America, expanding to Asia-Pacific | Long term (≥ 4 years) |
| Source: Mordor Intelligence | |||
High Initial Capital Investment
A B1-format inkjet press can exceed USD 2 million, deterring small and mid-size converters that lack assured volume commitments. Landa’s S11P, equipped with a seven-color set and 11K speed module, typifies capital intensity because owners must also fund workflow software, color management, and training, adding another 20-30% to ownership cost. Hybrid retrofits are easing the burden, Domino’s N610i-R inserts inkjet into existing analog lines at a fraction of full-press cost. Heidelberg’s Jetfire units bolt onto Speedmaster platforms, letting printers tackle short runs without scrapping legacy equipment. Output-based leasing models shift spending from capital to operating expense, yet adoption is still limited outside North America and Western Europe.
Volatility in Raw Material Prices for Specialty Inks
Specialty pigments, UV resins, and photoinitiators encounter supply disruptions that erode margin predictability for ink suppliers. Titanium dioxide prices swung sharply in 2024 after environmental clampdowns in China, forcing resin manufacturers to pass on the costs downstream. Latex inks, growing at 7.32% CAGR, rely on proprietary polymer dispersions sourced from a handful of suppliers, creating single-point-of-failure risks. Converters attempt to hedge their risks with long-term contracts, but this approach strains working capital and limits agility when demand shifts. The European Directive 2024/825 on green-claims substantiation now requires ink makers to document life-cycle impacts, adding compliance costs that narrow gross margins. [3]European Union, “Directive 2024/825 on Green-Claims Substantiation,” EUR-LEX.EUROPA.EU
*Our forecasts treat driver/restraint impacts as directional, not additive. The impact forecasts reflect baseline growth, mix effects, and variable interactions.
Segment Analysis
By Printing Process: Inkjet Maintains the Lead Amid Dye-Sublimation Surge
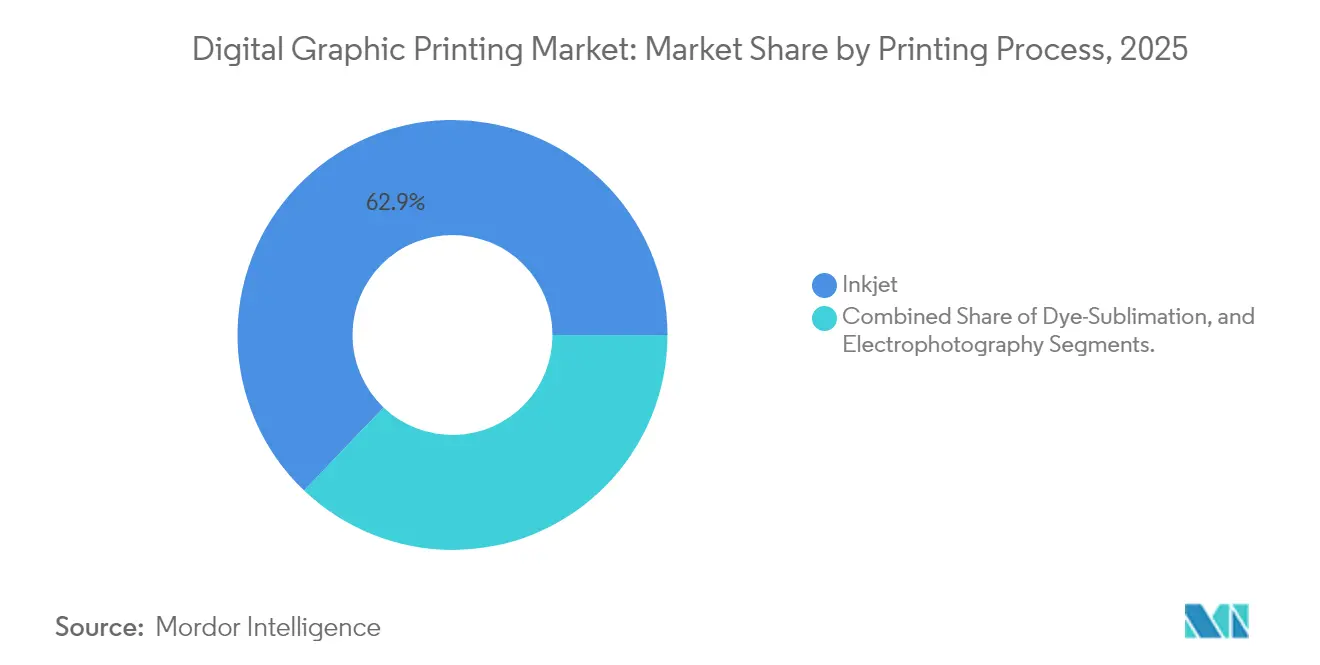
Inkjet captured 62.88% of the Digital Graphic Printing market share in 2025, illustrating its dominance across commercial, label, and packaging segments. The Digital Graphic Printing market size attributed to inkjet presses is projected to climb steadily as SCREEN’s Truepress JET 560HDX and Canon’s varioPRESS iV7 promote direct printing on coated substrates at competitive speeds. These platforms streamline changeovers, enabling converters to manage SKU proliferation without incurring the setup costs typically associated with offset printing. Production economics now favor inkjet for runs under 5,000 sheets, a range that accounts for an increasing share of total print orders. Operators also appreciate inline quality control cameras and automated nozzle compensation, which reduce waste and improve uptime.
Dye-sublimation is advancing at a robust 6.18% CAGR through 2031, driven by demand for textiles and soft signage. Epson’s SureColor F11070H utilizes six-color high-density inks and recirculating printheads to achieve a throughput of 255 square meters per hour, enabling apparel makers to fulfill fast-fashion cycles with minimal inventory. Mimaki’s TRAPIS consolidates transfer-paper production and sublimation into one chassis, shrinking footprint and utility consumption for smaller shops. Electrophotography remains relevant where specialty toner effects, metallic, fluorescent, white, drive high-value applications such as premium brochures and cosmetics cartons. Fujifilm’s REVORIA PRESS GC12500 extends toner’s color gamut, contesting inkjet’s edge in graphic richness while offering thicker media support.



By Application: Packaging Gains Momentum as Advertising Print Levels Off
Packaging emerged as the fastest-growing application, with a 6.62% CAGR outlook, driven by direct-to-consumer shipping dynamics and stringent food safety regulations that require traceable, on-demand labeling. Converters are installing hybrid lines, such as Durst’s VariJET 106, which integrates water-based inkjet and inline flexo varnish, to exploit both short-run economics and high-output reliability. EFI’s Nozomi 14000 AQ extends single-pass capability to corrugated packaging, printing 300 boxes per minute on substrates up to 1.4 meters wide. These advances align with retailers’ interest in right-sized packaging that cuts freight cost and eliminates void fill.
Advertising print commanded a 28.10% share in 2025 but is plateauing as brands reallocate budgets to digital media. Dynamic LED screens are replacing wide-format banners and point-of-purchase displays, yet wide-format inkjet remains critical for short-lived campaigns where physical presence is necessary. Latex and UV inks enable quick installation without off-gassing, an edge for indoor retail environments. Security printing is a niche where digital’s variable-data capability thwarts counterfeiting; Koenig and Bauer’s STEGANO watermarking introduces machine-readable codes into currency and ID documents. Transactional statements persist because financial institutions must provide hard-copy bills, and they now embed personalized offers, merging compliance with marketing goals.
By Ink Type: UV-Cured Retains Dominance as Latex Climbs
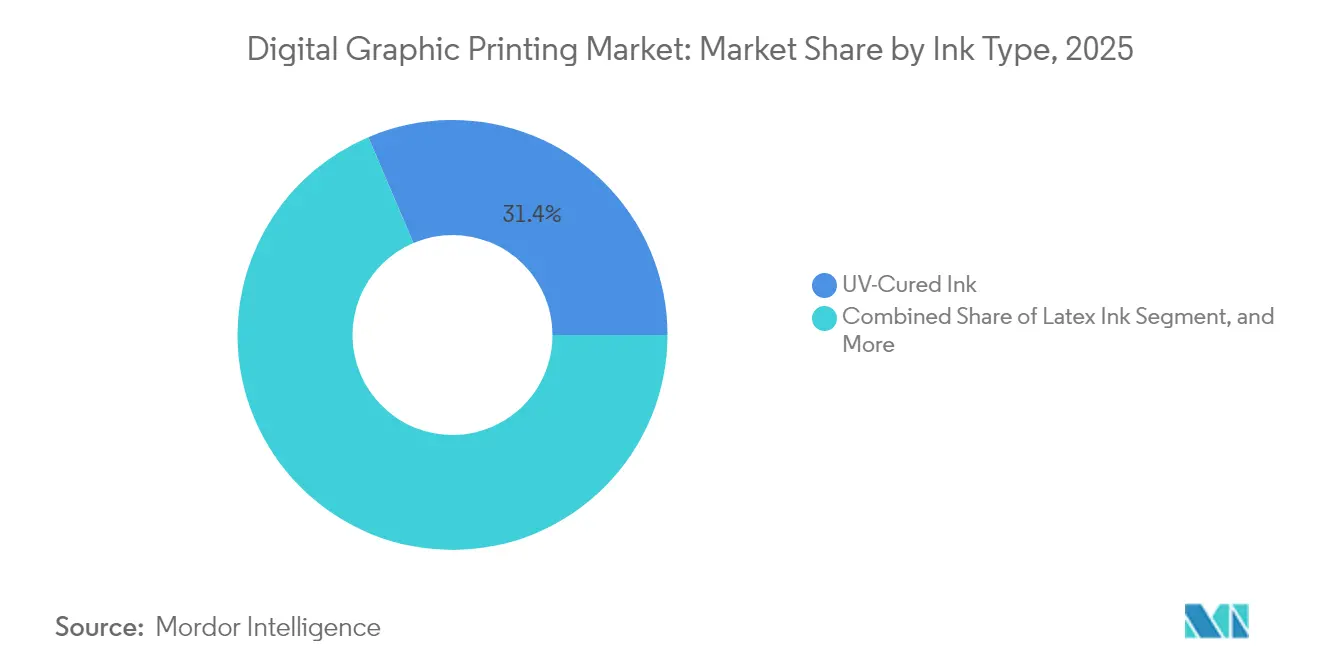
UV-cured formulations accounted for 31.40% of the Digital Graphic Printing market in 2025, as instant cure enables high-line-speed label and folding carton production. The Digital Graphic Printing market's contribution from UV-cured applications will remain substantial, as newer low-migration resins extend usage to primary food packaging. Shrink-sleeve, in-mold, and metallized labels all benefit from UV’s high-density color and fine text reproduction. Yet latex inks, exhibiting a 7.05% CAGR, are closing the gap by offering water-based chemistry with improved scratch resistance, odor neutrality, and broad material compatibility. HP’s Latex 2700 series prints on vinyl, fabric, wallpaper, and rigid substrates using the same ink set, simplifying inventory management for print providers that straddle décor, signage, and apparel.
Aqueous inks are gaining popularity in corrugated packaging and children’s books, where food-contact or low-VOC certification is required. SCREEN’s Truepress PAC 520P delivers water-based ink at 150 meters per minute on kraft liners, providing gravure-like quality without solvent emissions. Solvent inks continue to serve the vehicle wrap and outdoor billboard markets due to their durability, but ongoing VOC regulations are constraining future growth. Dye-sublimation remains the niche solution for polyester textiles, and emerging pigment-based sublimation inks may break substrate barriers by bonding to cotton blends, expanding addressable markets.
By Substrate Material: Paper Still King, Plastic Films Accelerate
Paper maintained 47.80% share in 2025 as it underpins commercial printing, magazines, and transactional mail. However, Digital Graphic Printing market size for plastic film substrates is climbing quickly due to demand for flexible stand-up pouches and retort packs that extend product shelf life. EFI’s Nozomi 200K hits 56 meters per minute on 760 millimeter-wide films, giving converters the throughput needed to compete with flexo on mid-length runs. HP’s Indigo 200K, with 400 installations worldwide, leverages LEP technology to provide gravure-grade color consistency and 97% Pantone coverage on PET and BOPP films.
Textile substrates are another bright spot. Mimaki’s TRAPIS and Epson’s SureColor F11070H enable direct-to-fabric production, reducing water usage by up to 60% compared to rotary screen printing. EFI’s Reggiani ecoTERRA pigment solution eliminates pre-treatment, steaming, and washing, cutting energy and chemical consumption by 30%. Metal, glass, and ceramics remain specialized but lucrative for décor and industrial applications, EFI’s Nozomi 12000 MP prints photo-realistic images on aluminum beverage cans at commercial speeds, enabling personalization options previously unattainable. Regulatory push for mono-material packaging is prompting converters to choose substrates compatible with existing recycling streams, amplifying interest in PP and PE films.
Geography Analysis
North America held 39.70% of Digital Graphic Printing market revenue in 2025, anchored by established installed bases from HP, Canon, and Xerox. U.S. converters leverage variable-data capability for financial statements, direct mail, and short-run folding cartons while Canadian and Mexican plants expand label capacity to service cross-border supply chains. Growth is moderating because many large printers have completed analog-to-digital conversions in high-volume segments. Xerox’s 2024 exit from iGen5 toner production and pivot to Screen inkjet technology illustrates the strategic shift toward lower cost per impression and broader substrate compatibility.
Asia-Pacific is forecast to advance at an 7.68% CAGR to 2031, the fastest of any region. China Print 2025 saw HP unveil the Indigo 120K HD, signaling confidence in Chinese and Indian converters upgrading capacity. Rising labor costs in coastal China make AI-driven automation attractive, while India’s consumer-goods expansion fuels packaging demand that hybrid inkjet-flexo lines can capture. Japan’s printers, facing shrinking domestic volumes, are blending digital and offset to serve niche export runs, with Konica Minolta’s AccurioJet 60000 designed for seamless workflow integration. South Korea and Australia are deploying direct-to-fabric textile systems to meet fast-fashion cycles and reduce water consumption.
Europe is advancing under stricter sustainability mandates such as Packaging and Packaging Waste Regulation 2025/40, which favors on-demand production and recyclable materials. Germany, the United Kingdom, France, Italy, and Spain collectively dominate because of high demand for labels, cartons, and security printing. Heidelberg’s Prinect Touch Free workflow automatically routes jobs between offset and digital, improving asset utilization across mixed fleets. Converters are shifting toward water-based and latex inks that meet European Directive 2024/825 on green claims. South America, the Middle East, and Africa are smaller but growing, with Brazil adopting digital label presses for beverage brands and the United Arab Emirates investing in secure passport production.

Regulatory Landscape
Sustainability and packaging-waste policy are increasingly influencing digital graphic printing investment decisions, especially for packaging and labels. In the European Union, the Packaging and Packaging Waste Regulation (PPWR) 2025/40 sets requirements for packaging placed on the EU market, with a general application date of 12 August 2026 for provisions covering manufacturing, composition, and sustainability. This is pushing converters toward on-demand production and greater materials transparency.
Ink and food-contact compliance is also tightening. In the United States, the FDA continues to govern food-contact substances through the Food Contact Notification (FCN) framework, including an August 2025 effective date for FCN No. 2444 covering specific titanium dioxide as a colorant in food-contact polymers. In Switzerland and Germany, stricter printing-ink compliance regimes (Swiss Ordinance 2026 and German Ink Ordinance 2027) are accelerating adoption of low-migration UV chemistries and documentation-ready ink portfolios, including BOBST's Thalia UV Digital Ink range. Standards activity further supports harmonization of labeling and verification, including ISO publications in 2026 on environmental communication and packaging data carriers.
Value Chain Analysis
The value chain covers (1) upstream inputs, including ink chemistry (UV resins, photoinitiators, pigments), printheads and electronics, and substrates such as paper, films, and specialty textiles, (2) OEMs and system integrators supplying presses, front ends, and automation, (3) converters and print service providers operating digital, hybrid, and conventional lines, and (4) downstream brand owners, retailers, and logistics partners that increasingly require rapid SKU changeovers, traceability, and carbon-footprint reporting for printed goods. OEM strategy is shifting from standalone press sales to integrated workflow approaches, where scheduling, color management, and interoperability across mixed fleets differentiate vendors.
Operational bottlenecks are moving downstream from press mechanics to workflow integration and data handling, with industry commentary in 2026 highlighting connectivity and system integration as a constraint on throughput. Supply-side volatility in base materials (plastics, film, aluminum) and logistics costs continues to pressure converter margins, which raises the focus on waste reduction and short-run efficiency. Partnerships that combine hardware and software capabilities, such as Koenig and Bauer working with Google Cloud on AI-enabled packaging production and BHS Corrugated working with Agfa to enhance digital corrugated platforms, show how value is being created through connected production rather than individual components.
Competitive Landscape
The Digital Graphic Printing market exhibits moderate concentration. The players, such as Landa Corporation, OEMsHP, Canon, and others, control a significant installed base of commercial and transactional systems. Offset press manufacturers such as Heidelberg and Koenig, and Bauer are defending their share by retrofitting digital modules onto analog lines, blurring traditional equipment categories, and forcing pure-play vendors to compete on end-to-end cost of ownership rather than raw speed. Hybrid solutions, such as Durst’s VariJET 106, co-developed with Koenig and Bauer, enable converters to add digital flexibility without discarding existing assets.
Strategic partnerships are proliferating to accelerate software integration and materials innovation. Agfa’s 2024 collaboration with EFI combines Agfa’s ink formulations and print media with EFI’s Fiery digital front ends to deliver turnkey solutions that standardize color across commercial, label, and packaging workflows. Landa continues to push Nanographic technology, boasting 50 presses in 14 countries and claiming that 20% of customers have ordered repeat systems, a sign of growing confidence in blanket-transfer architecture. SCREEN’s SC2 inks and thermal head design maintain offset-grade gloss on coated stocks, enhancing its appeal in publishing markets where high optical density is non-negotiable.
Digital Graphic Printing Industry Leaders
Xerox Holdings Corporation
Giesecke+Devrient Currency Technology GmbH
A1 Security Print Ltd
Swiss Post Solutions
Landa Corporation Ltd.
- *Disclaimer: Major Players sorted in no particular order

Market Opportunities and Future Outlook
Packaging and labels are a key whitespace for digital graphic printing as converters move from trial deployments toward scaled, repeatable production supported by connected workflows. A concrete sign of scaled adoption is the February 2026 commercial agreement between HP Indigo and ePac to install 10 additional HP Indigo 200K presses across ePac's network (USD 50 million over three years), which expands industrial flexible packaging capacity and standardizes installed equipment for short-run, versioned SKU programs.
Opportunities are also building around compliance-driven inks and end-to-end label production, where converters need lower migration risk, faster changeovers, and less waste to satisfy customer and regulatory requirements. BOBST's introduction of the FLEXJET module and Thalia UV inks in 2026 targets complete digital label production with quantified reductions in start-up time and waste, aligning with growing scrutiny on ink formulation and migration under Swiss and German regimes. Hybrid industrial platforms also broaden the addressable base for folding cartons and labels, with installations such as Gallus Five at Artes Etichette and the VariJET 106 deployment at Drukarnia Tamir supporting the movement of conventional workloads into digitally enabled production flows.
Recent Industry Developments
- July 2026: Koenig and Bauer announced that Drukarnia Tamir will move into high-volume digital folding carton production using the VariJET 106 hybrid press. The installation supports migration of thousands of annual jobs from older offset capacity into a workflow that combines digital flexibility with industrial finishing, strengthening the business case for hybrid analog-digital conversions in cartons.
- October 2025: Xerox announced the Xerox Proficio Production Series (PX300 and PX500 presses) at PRINTING United. The launch expanded Xerox's production portfolio and linked new press offerings to an ecosystem approach that emphasizes automated workflows and broader application coverage for commercial print operations.
- September 2024: Xerox introduced the PrimeLink C9200 Series color printers at PRINTING United 2024. The refresh targeted production print environments seeking higher productivity and consistency, supporting service providers competing on short-run turnaround and variable-content work.


Research Methodology Framework and Report Scope
Market Definition and Coverage
For this study, the market covers revenues earned from digital graphic printing outputs produced through digital print processes for commercial and industrial jobs, across major end uses like advertising, transactional, security, and packaging applications.
Scope exclusions: We exclude traditional analog printing (such as offset, gravure, and flexography) and we also exclude upstream items like printhead components, inks sold for non-graphic uses, and printer service contracts when they are billed outside print output revenue.
Segmentation Overview
- By Printing Process
- Inkjet
- Electrophotography
- Dye-Sublimation
- By Application
- Advertising Print
- Transactional Printing
- Security Printing
- Packaging
- Other Applications
- By Ink Type
- UV-Cured Ink
- Aqueous Ink
- Solvent Ink
- Latex Ink
- Dye-Sublimation Ink
- Other Ink Types
- By Substrate Material
- Paper
- Plastic / Film
- Fabric / Textile
- Other Substrate Materials
- By Geography
- North America
- United States
- Canada
- Mexico
- South America
- Brazil
- Argentina
- Chile
- Rest of South America
- Europe
- United Kingdom
- Germany
- France
- Italy
- Spain
- Rest of Europe
- Asia-Pacific
- China
- Japan
- India
- South Korea
- Australia and New Zealand
- Rest of Asia-Pacific
- Middle East and Africa
- Middle East
- United Arab Emirates
- Saudi Arabia
- Turkey
- Rest of Middle East
- Africa
- South Africa
- Kenya
- Nigeria
- Rest of Africa
- Middle East
- North America
Data Sources, Market Sizing, and Validation
Desk Research
Desk research helps us anchor the demand pool and the operating context that drives digital print volumes, before numbers are modeled. We typically start with trade and production signals and then review public reporting on print and packaging activity, which are closely tied to advertising and brand spend cycles.
For this market, we referenced public and official sources such as the U.S. Census Bureau (printing and related services), Eurostat structural business statistics, UN Comtrade trade flows for printed matter and relevant substrate categories, and the World Bank for macro indicators that influence print demand. We also reviewed patent databases for technology direction (such as inkjet and electrophotography advances), along with company filings and investor presentations to understand capacity additions, utilization commentary, and ASP movement. Where needed, paid subscriptions for company financials and news, patents, and shipment-level import and export checks were used to reconcile timing and confirm directional changes. The sources listed here are illustrative, and many other public and paid references were used for data collection, validation, and clarification.
Primary Interviews and Surveys
Primary work focused on validating what drives value in digital graphic printing, especially the split between short-run commercial jobs and higher-throughput packaging or industrial work. We spoke with a mix of print service providers, equipment ecosystem participants, and large print buyers, and we used the discussions to tighten assumptions around pricing per square meter, substrate mix shifts, and the pace of ink transitions (such as UV-cured and aqueous) across regions.
Because adoption and pricing can vary by geography, feedback was collected across APAC, EMEA, and the Americas, and then aligned to desk signals before finalizing the model. When an input was uncertain, it was re-checked with a second respondent group so the final view reflects practical buying and production behavior, not just published statements.
Distribution of primary research fieldwork respondents
| Company type | Respondent position | Region |
|---|---|---|
| Top tier: 33% | CXOs: 14% | APAC: 50% |
| Mid tier: 52% | Functional/Unit leaders: 39% | EMEA: 31% |
| Smaller Players: 15% | Managers: 47% | Americas: 19% |
Market-Sizing & Forecasting
Sizing started from a top-down reconstruction tied to print demand indicators, where application-level output volumes were inferred from end-use activity and then converted into value using region-appropriate price ranges. In parallel, selective bottom-up checks were run using sampled ASP x volume logic from print providers and channel discussions, which helped adjust totals where a single indicator was too noisy.
The model uses practical inputs that explain value formation in this market, such as the share of jobs shifting to short-run and on-demand printing, average printed area by application, substrate mix (paper versus plastic/film and textile), and the mix of processes like inkjet versus electrophotography. Ink type transitions (for example, UV-cured and aqueous) were also treated as a pricing and adoption signal, since they often change job economics and compliance costs. For forecasting, scenario analysis was applied to separate steady replacement demand from faster adoption pockets, and then the scenarios were weighted using expert consensus from interviews on capacity expansion timing, utilization, and pricing pressure.
Where bottom-up inputs were missing for smaller countries or niche applications, gaps were handled through proxy ratios from similar markets, followed by a review against regional print and packaging activity to avoid overstating growth.
Data Validation & Update Cycle
Outputs were cross-checked against independent signals, including regional print activity direction, equipment installation commentary, and shifts in substrate and ink usage that show up in public disclosures and trade flows. If the model produced an unexpected jump in value, the driver was isolated first, and then the input was either corrected or defended with a documented rationale.
Before sign-off, the dataset and assumptions go through multi-step analyst reviews, and respondents are re-contacted when a key variable moves outside a reasonable range. Reports are refreshed annually, and interim updates are made when material events occur (such as major regulatory changes affecting inks, or sharp price moves in substrates). Right before delivery, a final pass is completed so the numbers and narrative reflect the latest available information.
Mordor Intelligence's Digital Graphic Printing Market Size Compared Against Other Published Estimates
Published market sizes for digital graphic printing can look far apart because different studies draw the boundary in different places and then apply different pricing and adoption assumptions. The biggest differences usually come from what is counted as a printable output market versus an equipment and supplies market, along with whether packaging and industrial end uses are included at the same depth.
By tracking application-level printed output and refreshing ASP ranges using real buyer and provider checks, Mordor Intelligence keeps the estimate tied to advertising, transactional, security, and packaging print jobs, rather than folding in broader digital printing categories that widen the total.
Benchmark comparison
| Source | Market Size | Gaps in Research Methodology |
|---|---|---|
| Mordor Intelligence | USD 9.85 B (2025) | |
| Industry Publisher A | USD 14.90 B (2022) | The estimate appears to use an older base year and a wider bucket that can blend digital printing uses beyond graphic outputs, which can lift the total if packaging, textiles, and equipment-related revenues are mixed in. |
| Market Brief B | USD 40.00 B (2024) | The number aligns more with a broad digital printing total rather than digital graphic printing, and it likely applies higher inclusion of packaging and textile printing plus looser scope control on what counts as print revenue versus adjacent value chain items. |
The spread in the table mainly reflects scope control and base-year alignment, not just different growth expectations. When scope is kept to digital graphic print outputs and pricing is tied to realistic job mix and substrate trends, the final value becomes easier to trace, explain, and update with repeatable checks.


Key Questions Answered in the Report
What is the projected value of the Digital Graphic Printing market by 2031?
It is forecast to reach USD 13.42 billion by 2031, reflecting a 5.28% CAGR.
Which printing process currently dominates commercial applications?
Inkjet leads with 62.88% share thanks to its ability to print on coated substrates without pre-treatment.
Why is Asia-Pacific the fastest growing region?
Capacity investments in China and India, coupled with AI-enabled automation, are driving an 7.68% regional CAGR.
How are regulations influencing ink choices?
EU directives on recyclability and green claims are pushing converters toward water-based, latex, and low-migration UV inks.
What barrier limits adoption among small converters?
Upfront capital costs exceed USD 2 million for B1 inkjet presses, although hybrid retrofits and leasing models are easing the burden.
Page last updated on:





