Digital Experience Platform Market Size and Share
Market Overview
| Study Period | 2019 - 2030 |
|---|---|
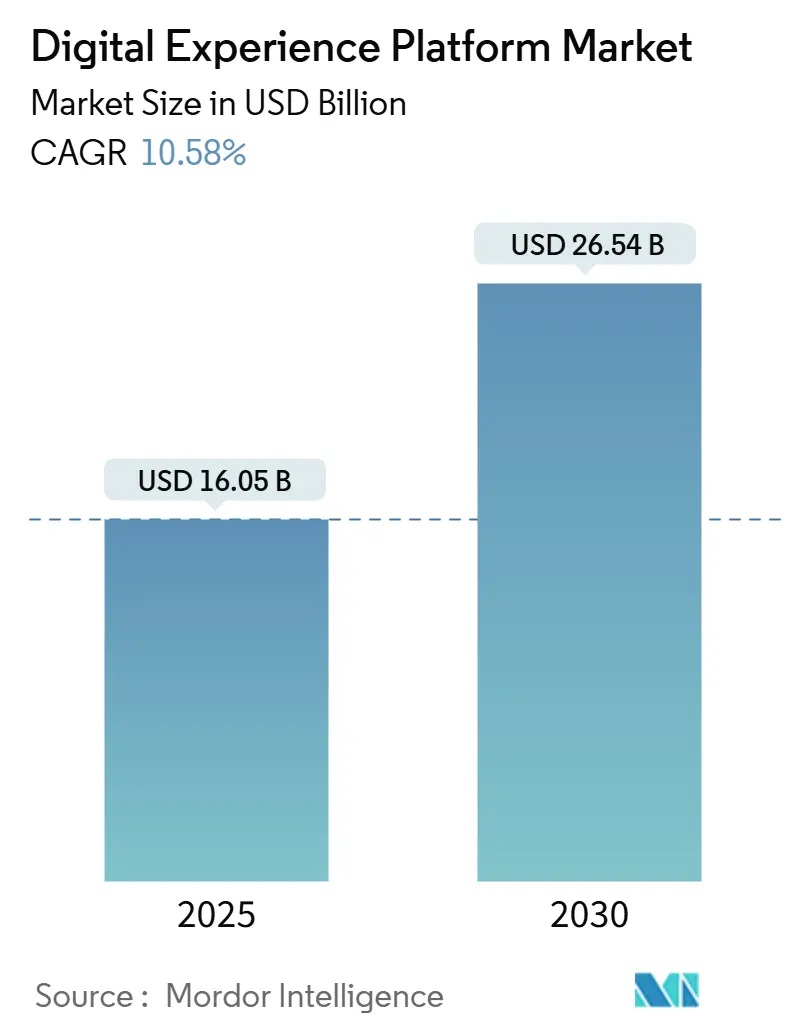
| Market Size (2025) | USD 16.05 Billion |
| Market Size (2030) | USD 26.54 Billion |
| Growth Rate (2025 - 2030) | 10.58% CAGR |
| Fastest Growing Market | Asia Pacific |
| Largest Market | North America |
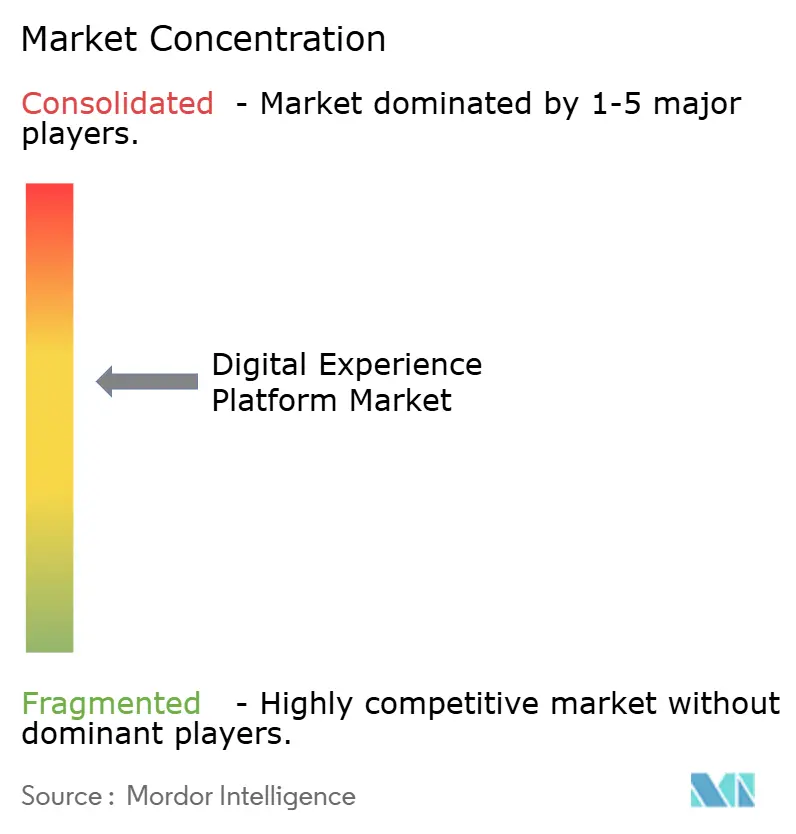
| Market Concentration | Medium |
Major Players
*Disclaimer: Major Players sorted in no particular order Image © Mordor Intelligence. Reuse requires attribution under CC BY 4.0. |
|
Digital Experience Platform Market Analysis by Mordor Intelligence
The Digital Experience Platform Market size is estimated at USD 16.05 billion in 2025, and is expected to reach USD 26.54 billion by 2030, at a CAGR of 10.58% during the forecast period (2025-2030).
Persistent demand for unified engagement layers that connect websites, mobile applications, social presences, and emerging conversational interfaces is the principal engine of this growth. Regulatory pressure most notably the EU Data Act, which obliges cloud providers to remove switching fees by January 2027 intensifies the need for open, interoperable architectures. Cloud deployment already dominates as enterprises standardize around multicloud and hybrid strategies, while Asia-Pacific’s mobile-first commerce ecosystems set the benchmark for next-generation customer journeys. A parallel talent shortage keeps services specialists in high demand, accelerating the shift toward partner-led implementation models. Vendors therefore compete not only on feature depth but also on the breadth of their ecosystem alliances and the speed with which they embed generative AI into campaign workflows.
Key Report Takeaways
- By deployment type, cloud solutions accounted for 67.7% of digital experience platform market share in 2024, and this segment is forecast to expand at an 11.9% CAGR to 2030.
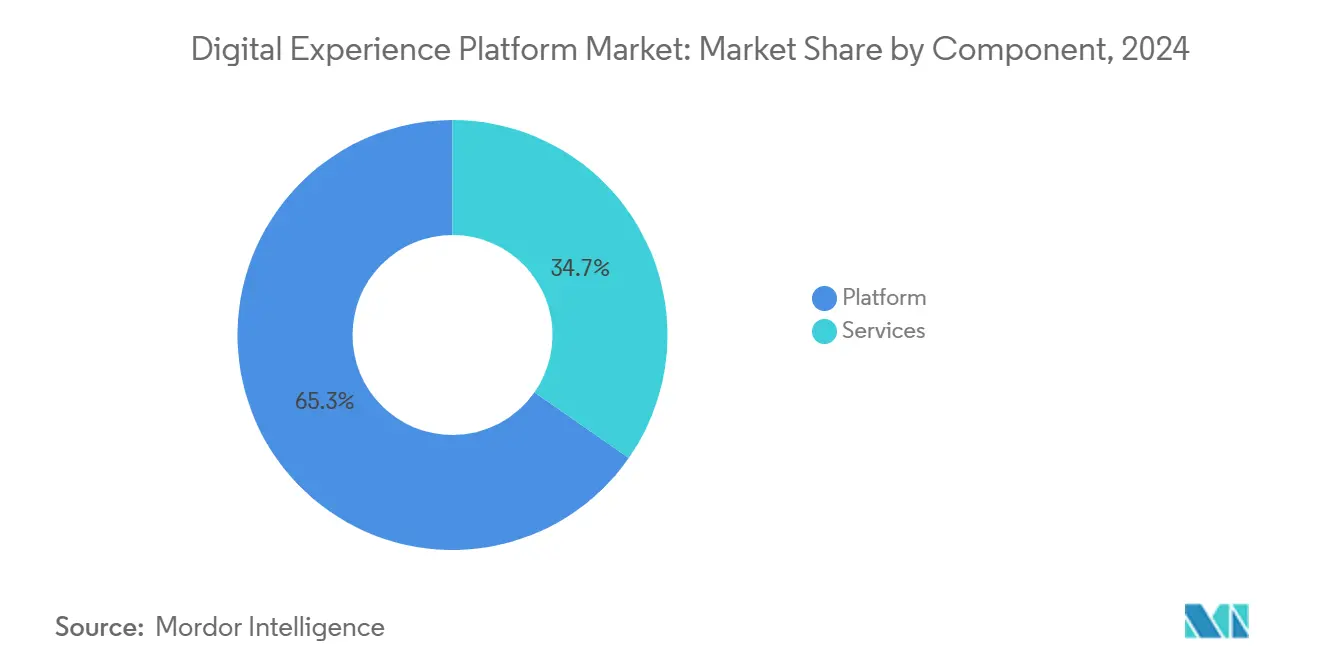
- By component, services contributed 34.7% of 2024 revenue while advancing at a 12.3% CAGR, the highest among all components through 2030.
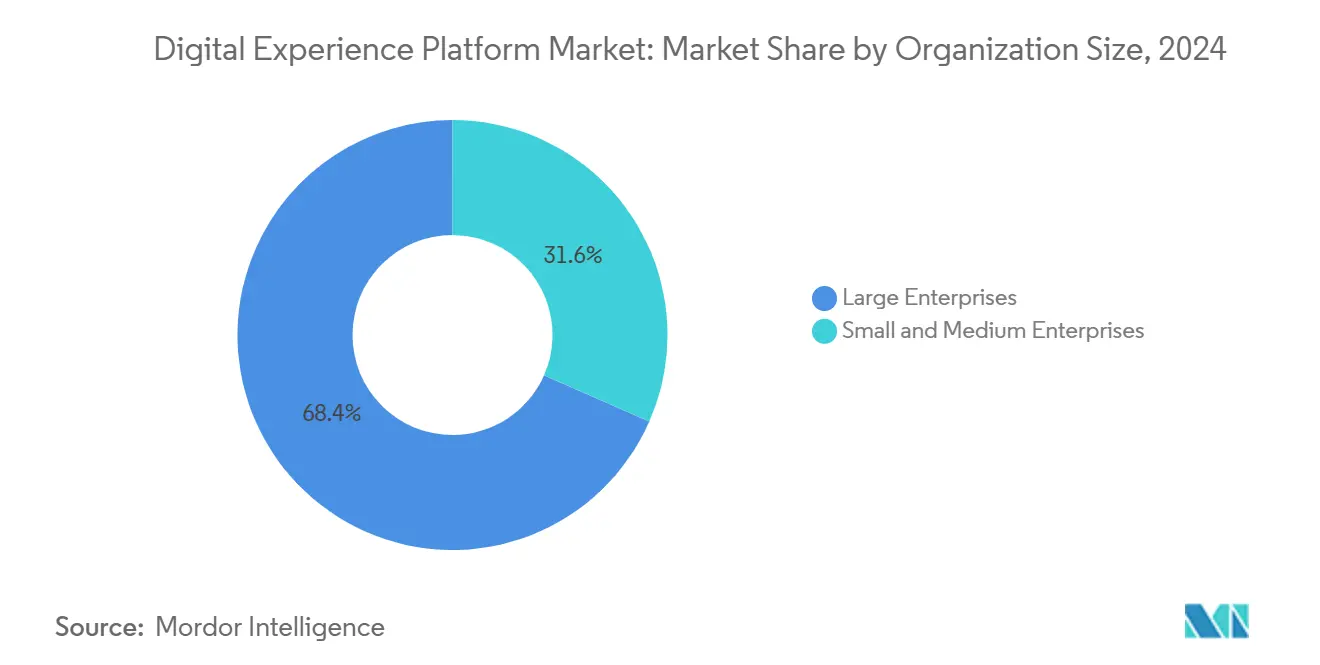
- By organization size, large enterprises held a 68.4% share of the DXP market size in 2024, whereas small and medium enterprises are growing at a 13.1% CAGR.
- By end-user industry, the Banking, Financial Services, and Insurance sector led with 25.3% revenue share in 2024; IT and Telecommunications is projected to record the fastest 12.7% CAGR through 2030.
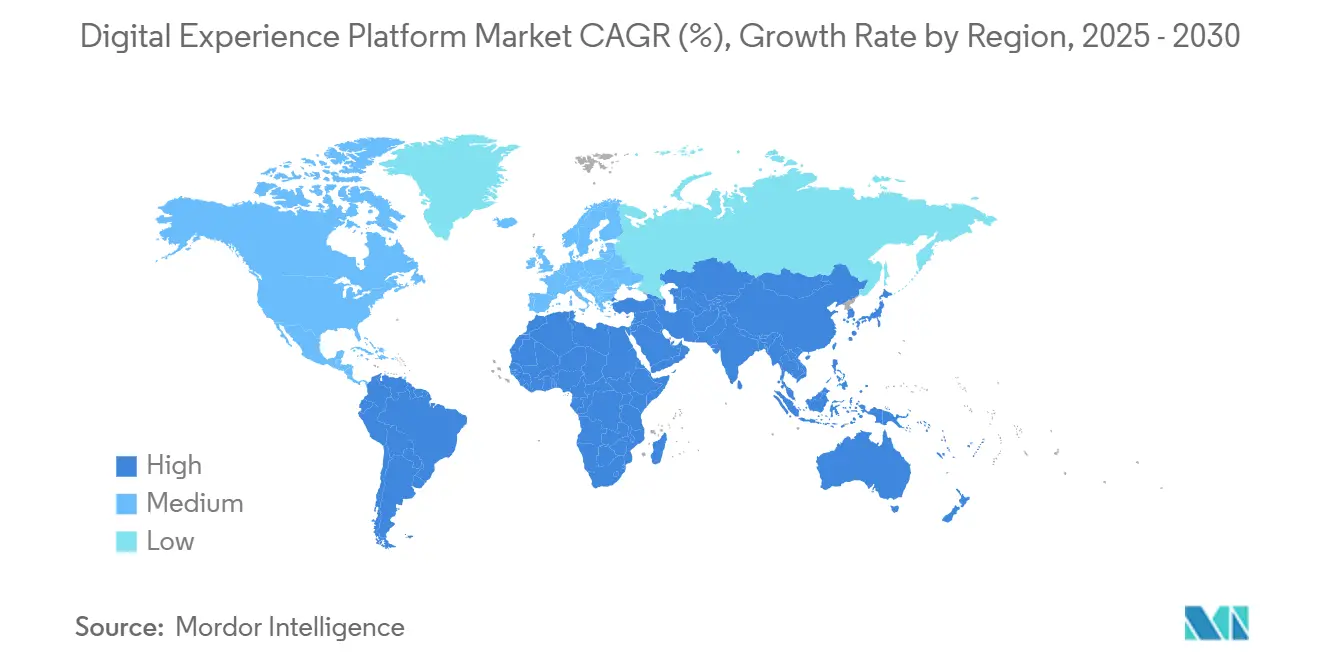
- By geography, North America captured 32.3% revenue share in 2024, while Asia-Pacific is set to grow at an 11.6% CAGR through 2030.
Global Digital Experience Platform Market Trends and Insights
Drivers Impact Analysis
| Driver | (~) % Impact on CAGR Forecast | Geographic Relevance | Impact Timeline |
|---|---|---|---|
| Cloud-first enterprise IT strategies accelerate DXP adoption | +2.8% | Global, with North America and Europe leading | Medium term (2-4 years) |
| Rapid shift to omnichannel, AI-driven personalisation | +2.1% | Global, with Asia-Pacific showing highest adoption rates | Short term (≤ 2 years) |
| Democratisation of composable / headless DXPs | +1.9% | North America and Europe core, expanding to Asia-Pacific | Medium term (2-4 years) |
| Mobile-commerce boom in emerging Asia drives mid-market demand | +1.4% | Asia-Pacific core, spill-over to MEA | Long term (≥ 4 years) |
| EU Data Act and US Open Data initiatives mandate interoperability | +0.8% | Europe and North America, with global implications | Long term (≥ 4 years) |
| Gen-AI content-ops cuts time-to-market for campaigns | +1.2% | Global, with early gains in technology sectors | Short term (≤ 2 years) |
| Source: Mordor Intelligence | |||
Cloud-first Enterprise IT Strategies Accelerate DXP Adoption
Chief executives continue to reallocate IT budgets toward as-a-service solutions that shorten deployment cycles and cut ownership costs. IBM’s migration of SAP S/4HANA workloads to its own cloud infrastructure reduced infrastructure costs by 30% while streamlining back-office billing processes. Organizations using cloud-native architectures also report almost double the customer retention rates of peers relying on traditional on-premise stacks.[1]Adobe Communications Team, “Customer Retention Study,” Adobe Blog, blog.adobe.comSuch performance differentials oblige slower adopters to accelerate cloud migrations, turning cloud-native DXPs into default procurement choices.
Rapid Shift to Omnichannel, AI-driven Personalisation
Sixty-five percent of senior executives consider AI essential to revenue growth. Mature MACH deployments - microservices, API-first, cloud-native, headless - exhibit 77% AI uptake compared with 36% among organizations still in pilot phases.[2]Rich Heinz, “MACH Adoption Benchmark 2024,” CMSWire, cmswire.com Real-time engines now aggregate behavioural, transactional, and contextual signals to orchestrate dynamic offers within milliseconds. Financial institutions are at the forefront: 94% of banking leaders plan to embed generative AI into customer-facing workflows during 2025.
Democratisation of Composable / Headless DXPs
Nearly 70% of Asia-Pacific e-commerce transaction value routes through mobile wallets.[3]Paul Klein, “Super-Apps and Mobile Wallet Penetration in Asia,” Citigroup, citigroup.com Super-apps blend payments, social feeds, and marketplace functions, forcing brands to craft adaptive experiences for small-screen journeys. Regional e-commerce sales surpassed USD 100 billion in 2023, creating a sizeable addressable base for DXP vendors. Yet 36% of marketers still describe their commerce systems as inflexible, signalling unmet demand for cloud-native, API-rich DXPs.
Restraints Impact Analysis
| Restraint | (~) % Impact on CAGR Forecast | Geographic Relevance | Impact Timeline |
|---|---|---|---|
| Integration complexity with legacy stacks | -1.8% | Global, with highest impact in North America and Europe | Medium term (2-4 years) |
| Escalating data-privacy compliance costs | -1.2% | Europe leading, expanding globally | Long term (≥ 4 years) |
| Shortage of skilled MACH-architecture talent | -1.4% | Global, with acute shortages in developed markets | Medium term (2-4 years) |
| Proprietary schema lock-in raises migration risk | -0.9% | Global, with higher impact on enterprise segments | Long term (≥ 4 years) |
| Source: Mordor Intelligence | |||
Integration Complexity with Legacy Stacks
Enterprises that spent decades layering customer-facing portals on rigid core systems now discover fundamental incompatibilities with modern API-first platforms. The absence of canonical data models complicates synchronisation across content, commerce, and service functions. Integration costs can rise by up to 30% when middleware or custom connectors are required for legacy mainframes. Incremental modernisation - wrapping legacy applications in micro-services, then sunsetting them carefully - has proven more successful than overnight cutovers, delivering operational savings of up to 25%.
Escalating Data-privacy Compliance Costs
The EU Data Act extends beyond GDPR by mandating data portability and real-time access privileges, compelling DXP providers to redesign data schemas for interchange. Layered atop country-specific rules in Brazil, India, and California, compliance now absorbs larger portions of DXP operating budgets. Providers that embed privacy-by-design principles and automate consent management can offset cost pressures through faster market entry and stronger customer trust.
Segment Analysis
By Component: Services Drive Implementation Excellence
The services segment recorded a 12.3% CAGR outlook through 2030, outpacing platform licensing even though platform revenue held a 65.3% share in 2024. Enterprises acknowledge that orchestration, change management, and data migration expertise determine whether deployments achieve promised retention and lifetime-value uplifts. The digital experience platform (DXP) market size for services is projected to widen as customers adopt MACH patterns requiring custom integration layers and continuous optimisation.
Demand also stems from the scarcity of in-house talent fluency in headless or composable reference architectures. Systems integrators therefore package accelerators, reference APIs, and vertical templates to shrink launch horizons from months to weeks. Consultancy contracts increasingly bundle agile coaching and content-supply-chain redesign to ensure that marketing, product, and IT teams converge on shared workflows.
Note: Segment shares of all individual segments available upon report purchase
By Deployment Type: Cloud Dominance Reshapes Architecture
Cloud deployment captured 67.7% of digital experience platform market share in 2024 and is forecast to compound at 11.9% annually to 2030. The DXP market size attributable to cloud services will therefore reach double the value of on-premises installations by the end of the decade. Enterprises favour elastic consumption models that align cost with traffic peaks and de-risk innovation cycles. Upcoming rules that forbid cloud switching fees remove lingering concerns about vendor lock-in and reinforce cloud as default.
On-premises estates persist chiefly in sectors such as defence and public safety, where data sovereignty thresholds are strict. Hybrid patterns have emerged: core identity and consent services reside on-premises while interaction-heavy workloads run in public clouds closer to edge users. Vendors differentiate by offering portability tooling and transparent runtime costs rather than pure feature counts.
By Organization Size: SME Growth Challenges Enterprise Dominance
Large enterprises held 68.4% revenue in 2024, yet SME adoption grows faster at 13.1% annually. Modular subscription bundles let smaller firms bypass up-front license commitments that once restricted entry to top-tier budget holders. Marketplace templates, auto-provisioned sandboxes, and low-code orchestration panels further reduce the skill threshold.
The digital experience platform market nevertheless remains weighted toward Fortune-ranked buyers with complex omnichannel estates. Many of these firms deploy multiple platforms - commerce, CMS, and marketing automation - inside a federated pattern that consolidates global governance while honouring local compliance. Their expansion, however, is tempered by lingering integration debt that raises operating costs when multiple brand sites share infrastructure.
Note: Segment shares of all individual segments available upon report purchase
By End-User Industry: BFSI Leadership Drives Innovation
The BFSI sector generated 25.3% of 2024 revenue as banks and insurers race to match fintech service levels. Real-time AI advisors, contextual offers, and omnichannel servicing require unified data layers that legacy core banking platforms lack. The digital experience platform (DXP) market continues to see high ticket sizes from BFSI deals that bundle data consolidation, customer-identity resolution, and advanced analytics.
Telecommunications and IT services exhibit a 12.7% CAGR trajectory, positioning them as the fastest-growing adopters. Telcos deploy DXPs to unify post-sales journeys across prepaid, post-paid, and broadband lines of business. Technology vendors simultaneously use their own DXPs to showcase reference architectures, fostering proof-of-concept momentum in adjacent verticals. Healthcare, manufacturing, and the public sector follow at a steadier pace, often hindered by regulated data domains and multi-site governance requirements.
Geography Analysis
North America maintains a 32.3% revenue lead owing to high cloud penetration, deep partner ecosystems, and generous innovation budgets. Reference accounts in financial services and retail continue to generate network effects that pull laggards toward modern stacks. Strong privacy frameworks coexist with investment incentives, encouraging responsible but rapid rollouts.
Asia-Pacific represents the headline growth engine with an 11.6% CAGR projection. Mobile-first super-app landscapes in Southeast Asia, digitally advanced consumer bases in South Korea and Japan, and cross-border e-commerce corridors across ANZ and ASEAN together create a fertile proving ground for AI-augmented personalisation. Regional policy sandboxes - such as Singapore’s MAS guidelines on trusted data sharing - add regulatory clarity that accelerates vendor entry and experimentation.
Europe records steady expansion underpinned by regulatory alignment. The EU Data Act compels platform openness, and the Digital Markets Act limits gatekeeper self-preferencing, both of which broaden competitive choices for buyers. Cloud-and-edge providers collaborate on Gaia-X data-space initiatives that elevate data-sovereignty assurances. South America and the Middle East and Africa present emerging opportunities, with governments investing in broadband coverage and digital public-goods frameworks. Localised payment rails and multilingual content demands necessitate flexible, componentised DXPs that can tune to regional nuances.
Competitive Landscape
Incumbent suite vendors - Adobe, Salesforce, and Sitecore - anchor the digital experience platform market with broad portfolios that integrate content, commerce, analytics, and customer data platforms. Their strategy blends organic research and development with targeted acquisitions that fortify AI and data governance capabilities. Salesforce’s USD 8 billion acquisition of Informatica in May 2025 underscores the premium placed on master-data management and no-code integration.
Rivals focusing on composable microservices, such as Contentstack and Bloomreach, champion modularity and rapid experimentation. They court mid-market buyers and business units inside large companies that favour best-of-breed deployments. Partnerships with cloud hyperscalers and domain-centric ISVs expand reach without heavy sales overhead. The emergence of AI agent orchestration as a differentiator nudges all suppliers toward platform openness: Adobe launched ten specialised AI agents for campaign and journey tasks in March 2025.
Ecosystem breadth becomes a decisive advantage. Implementation partners, boutique consultancies, and independent software vendors create solution blueprints that lower risk for enterprise adopters. Strategic alliances - Adobe with AWS and Microsoft, Sitecore with Microsoft Azure OpenAI Service, and Acquia with Drupal community maintainers - signal a pivot from monolithic control toward collaborative value networks. As buyer priorities converge on rapid ROI and future-proof architectures, consolidation is expected to continue, especially around data unification and vertical domain accelerators.
Digital Experience Platform Industry Leaders
-
Adobe Inc.
-
Oracle Corporation
-
SAP SE
-
IBM Corporation
-
PROGRESS SOFTWARE CORPORATION
- *Disclaimer: Major Players sorted in no particular order
Recent Industry Developments
- May 2025: Press Ganey Forsta acquired InMoment to expand its Human Experience Platform across 43,000 clients.
- May 2025: Capillary Technologies bought Kognitiv, its fourth loyalty acquisition since 2021, to scale AI-powered personalisation in North America.
- May 2025: IgniteTech acquired Khoros, adding omni-channel engagement tools for 2,000 enterprises to its portfolio.
- March 2025: Adobe introduced Customer Experience Orchestration and the Experience Platform Agent Orchestrator featuring ten AI agents.
Research Methodology Framework and Report Scope
Market Definitions and Key Coverage
Our study defines the Digital Experience Platform (DXP) market as the global spend on integrated software suites that let enterprises build, manage, and optimize personalized interactions across websites, mobile apps, social channels, kiosks, and emerging conversational interfaces. A DXP typically bundles content and customer-data management layers with analytics, AI-driven personalization, workflow, and API connectors that unify previously siloed touchpoints.
Scope exclusion: custom, one-off in-house frameworks and plain Web Content Management tools that lack orchestration or data unification capabilities are not counted.
Segmentation Overview
- By Component
- Platform
- Services
- By Deployment Type
- On-Premises
- Cloud
- By End-User Industry
- Retail and E-commerce
- IT and Telecom
- BFSI
- Healthcare
- Manufacturing
- Others
- By Organisation Size
- Large Enterprises
- Small and Medium Enterprises
- By Geography
- North America
- United States
- Canada
- Mexico
- South America
- Brazil
- Argentina
- Rest of South America
- Europe
- Germany
- United Kingdom
- France
- Italy
- Rest of Europe
- Asia-Pacific
- China
- Japan
- South Korea
- India
- Rest of Asia-Pacific
- Middle East and Africa
- Middle East
- Saudi Arabia
- United Arab Emirates
- Turkey
- Rest of Middle East
- Africa
- South Africa
- Nigeria
- Egypt
- Rest of Africa
- Middle East
- North America
Detailed Research Methodology and Data Validation
Primary Research
Analysts then conduct interviews and short surveys with software product managers, solution integrators, and IT budget owners across North America, Europe, and Asia-Pacific. Their insights test price bands, refresh rates, and the mix between platform licenses and recurring managed services, allowing our team to tighten assumptions derived from secondary data.
Desk Research
We start with structured desk work that collects spend and adoption signals from trustworthy public datasets such as the US Census Bureau's quarterly e-commerce series, Eurostat ICT enterprise surveys, International Telecommunication Union connectivity statistics, GSMA Mobile Economy reports, and World Customs Organization shipment codes tracking packaged software flows. To size vendor revenue pools, Mordor analysts access D&B Hoovers company filings and mine Dow Jones Factiva for disclosed contract values and pricing moves. Patent searches on Questel help us gauge innovation velocity around composable DXPs and headless architectures, while trade association white papers (for example, the Content Marketing Institute) clarify use-case penetration by industry.
These inputs form the archival layer; numerous other open and paid sources are referenced during validation, and the list above is illustrative rather than exhaustive.
Market-Sizing & Forecasting
A top-down model converts enterprise software outlays, digital-commerce volumes, and channel traffic statistics into an addressable demand pool, which is then reconciled with sampled bottom-up checks such as vendor revenue roll-ups and regional partner billings. Key variables, including cloud migration rate, number of active commercial websites, CX budget share of total IT spend, average platform ASP, and subscription churn, drive year-by-year calculations. A multivariate regression links these drivers to historic revenue, generating the baseline and feeding an ARIMA scenario layer that projects through the forecast period. Where supplier roll-ups under-report mid-market activity, adjustment factors drawn from partner surveys bridge the gap.
Data Validation & Update Cycle
Outputs pass triple reviews: automated variance flags, peer analyst scrutiny, and a senior sign-off. We refresh models annually, and extraordinary events, such as major M&A, price resets, or regulatory shifts, trigger interim updates. Just before release, an analyst reruns the latest data so clients receive the freshest view.
Why Mordor's Digital Experience Platform Baseline commands confidence
Published estimates often diverge because firms vary the stack they include, the geographies they survey, and the cadence at which they refresh numbers.
Key gap drivers in this market are: some publishers limit coverage to license revenue and omit managed services; others exclude emerging composable micro-services; several rely on straight-line trend extensions that ignore shifts in cloud pricing and AI-led upselling, while Mordor's team revisits every driver annually and tests it with frontline experts.
Benchmark comparison
| Market Size | Anonymized source | Primary gap driver |
|---|---|---|
| USD 16.05 B (2025) | Mordor Intelligence | - |
| USD 5.01 B (2025) | Regional Consultancy A | Narrow stack, minimal Asia-Pacific sampling, limited primary checks |
| USD 13.50 B (2024) | Global Consultancy B | Counts licenses only, excludes services; single-factor forecast |
These comparisons show that Mordor's disciplined variable selection, annual refresh cycle, and blended top-down/bottom-up approach deliver a transparent, balanced baseline that decision-makers can reliably trace and replicate.
Key Questions Answered in the Report
How large is the digital experience platform market in 2025?
The market stands at USD 16.05 billion in 2025 and is forecast to reach USD 26.54 billion by 2030, reflecting a 10.58% CAGR.
Which deployment model leads the digital experience platform (DXP) market?
Cloud-based DXPs dominate with 67.7% market share in 2024 and are projected to grow at an 11.9% CAGR through 2030 as enterprises prioritise scalability and lower ownership costs.
Why is Asia-Pacific considered the fastest-growing region for DXPs?
Asia-Pacific is forecast to expand at an 11.6% CAGR because its mobile-commerce ecosystems and super-app culture drive demand for advanced, API-rich customer-experience solutions.
What is the main hurdle to successful DXP implementation?
Integration complexity with legacy systems remains the top barrier, capable of adding up to 30% to project costs and delaying time-to-value.
How are generative AI capabilities influencing DXP investment decisions?
Vendors are embedding AI agents that automate content creation and journey orchestration, prompting 94% of banking leaders and many other executives to prioritise DXPs that can natively support generative AI workflows.
Page last updated on:


