Digital Experience Monitoring Market Size and Share
Market Overview
| Study Period | 2020 - 2031 |
|---|---|
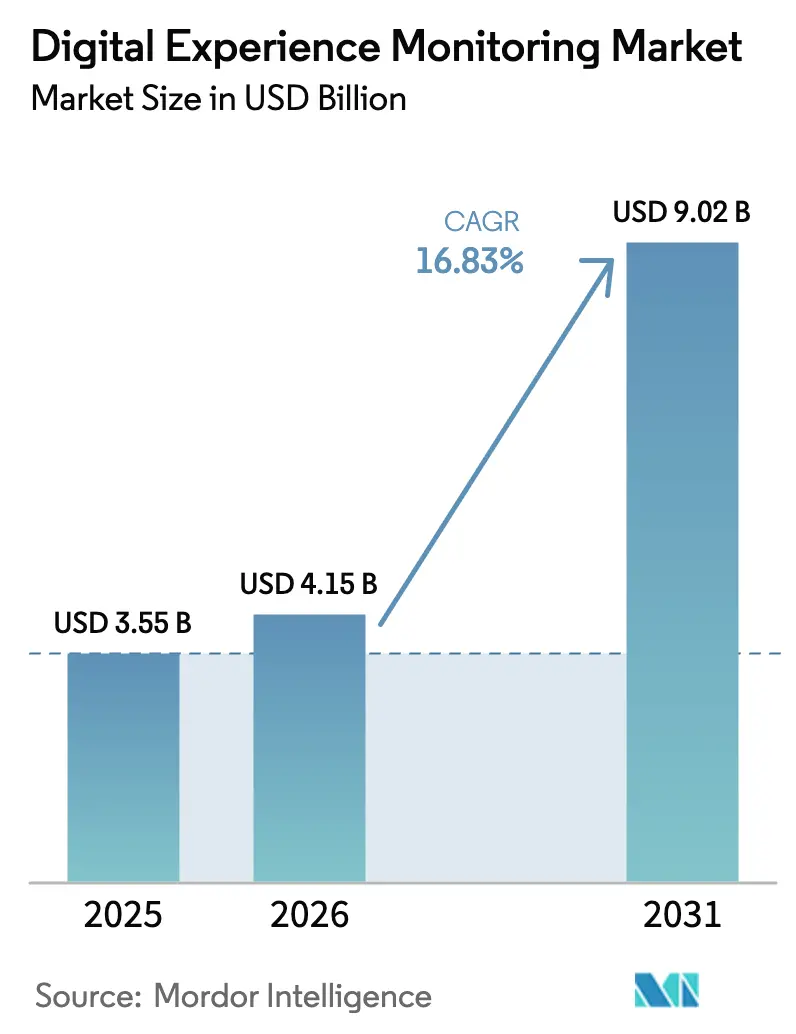
| Market Size (2026) | USD 4.15 Billion |
| Market Size (2031) | USD 9.02 Billion |
| Growth Rate (2026 - 2031) | 16.83% CAGR |
| Fastest Growing Market | North America |
| Largest Market | Asia Pacific |
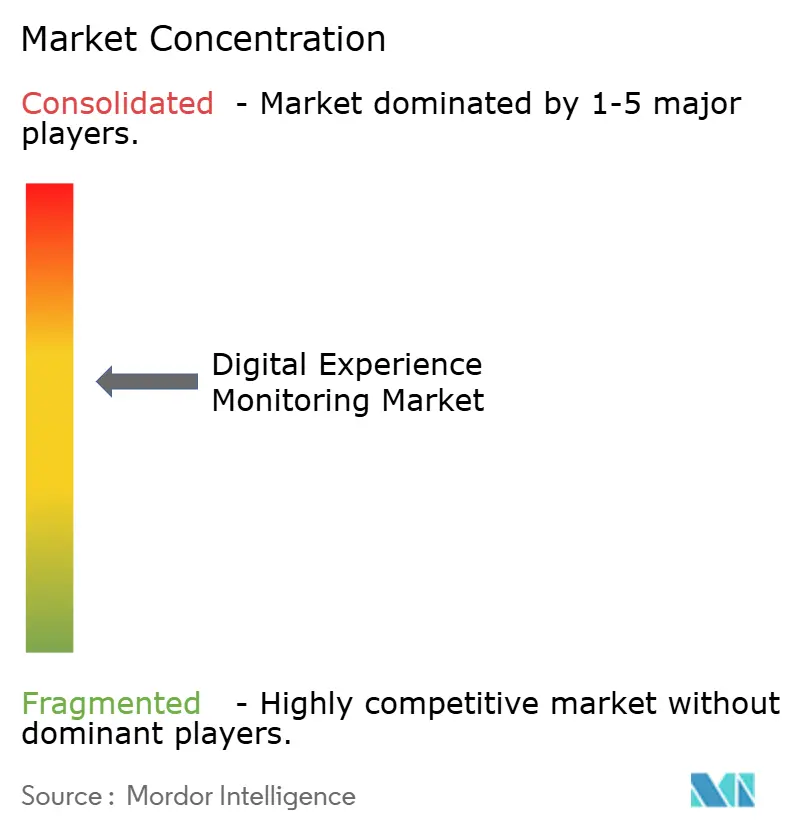
| Market Concentration | Medium |
Major Players*Disclaimer: Major Players sorted in no particular order Image © Mordor Intelligence. Reuse requires attribution under CC BY 4.0. | |
Digital Experience Monitoring Market Analysis by Mordor Intelligence
The digital experience monitoring market size in 2026 is estimated at USD 4.15 billion, growing from 2025 value of USD 3.55 billion with 2031 projections showing USD 9.02 billion, growing at 16.83% CAGR over 2026-2031. Escalating cloud-native adoption, mounting application-network interdependencies, and rising customer-experience expectations are reshaping enterprise monitoring priorities. Organizations are consolidating point tools into unified platforms that correlate user journeys with infrastructure telemetry. AI-driven automation, 5G and edge rollouts, and ESG-linked performance metrics are accelerating solution upgrades, while persistent skills shortages and data-privacy rules temper the pace of large-scale deployments. Competitive intensity is moderate as established APM vendors, cloud hyperscalers, and network specialists converge around experience-centric observability.
Key Report Takeaways
- By component, software held 70.55% revenue share in 2025; services are expanding at a 19.92% CAGR to 2031.
- By deployment, cloud models captured 67.85% of the digital experience monitoring market share in 2025 and are growing at a 21.66% CAGR.
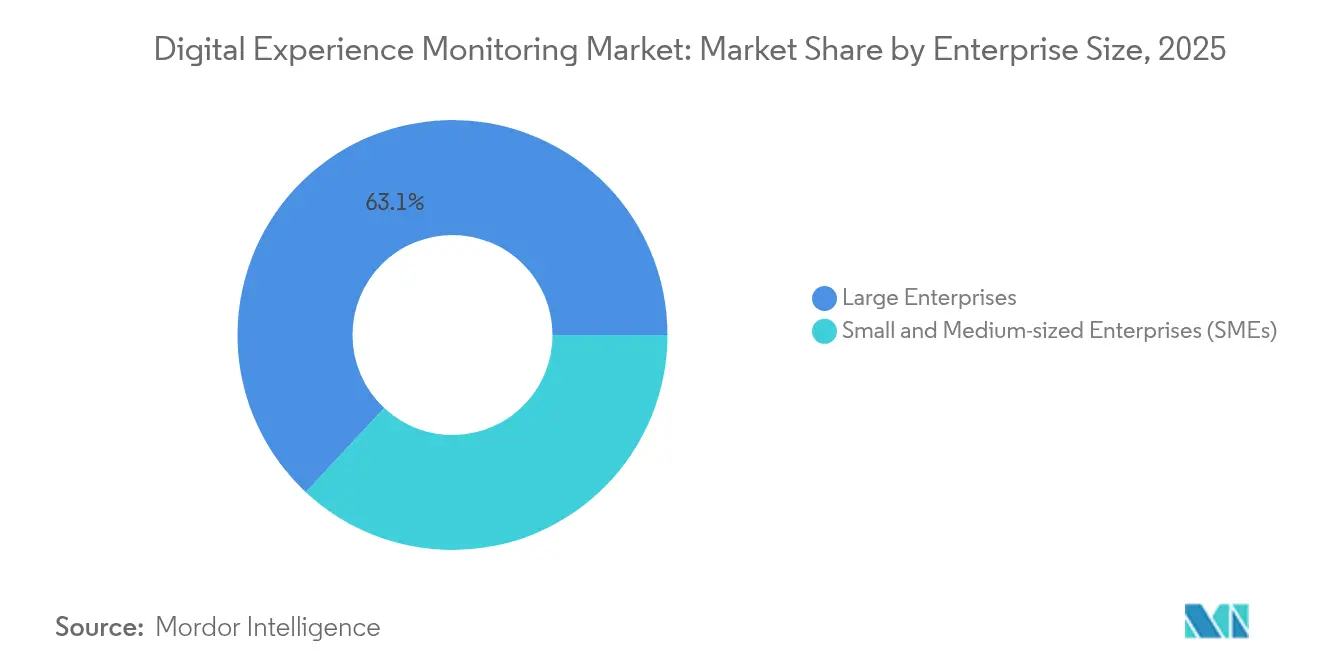
- By enterprise size, large enterprises led with 63.05% share in 2025, while SMEs record the fastest 23.63% CAGR through 2031.
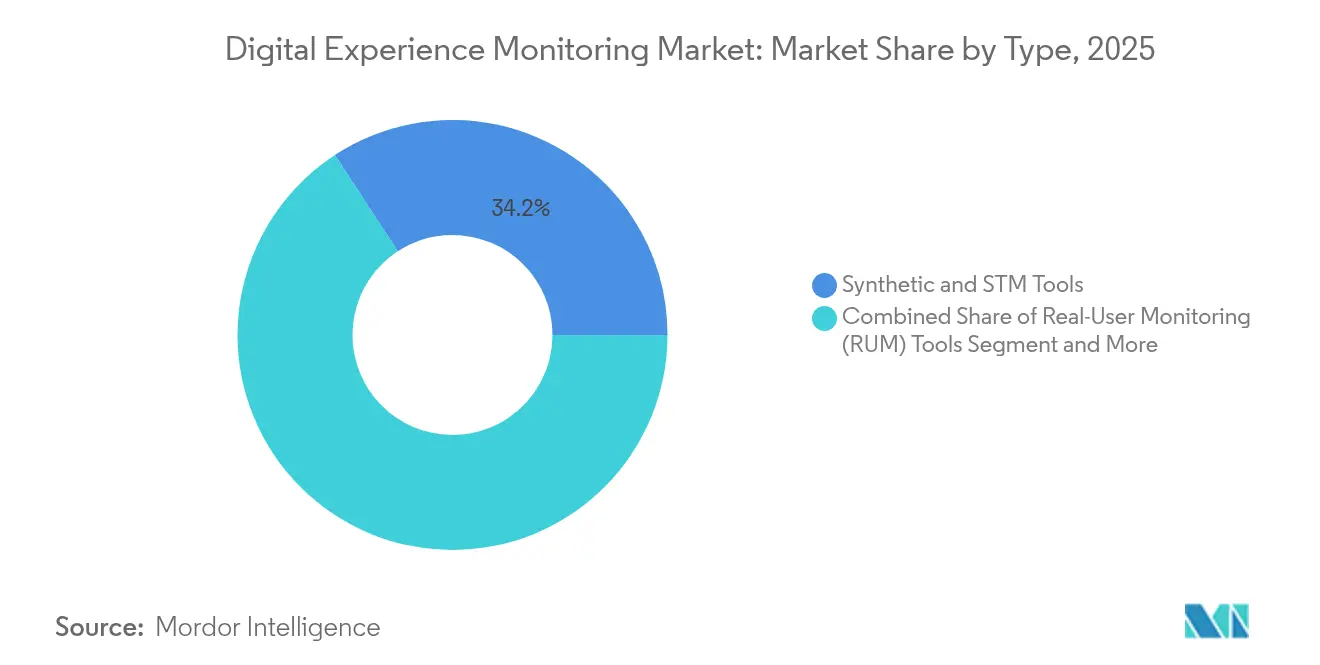
- By type, synthetic and STM tools commanded 34.21% of the digital experience monitoring market size in 2025; API monitoring is projected to advance at 19.4% CAGR.
- By end-user, IT and telecom accounted for 31.42% share of the digital experience monitoring market size in 2025; retail and e-commerce is growing at a 24.84% CAGR.
- By geography, North America dominated with 42.30% share in 2025; Asia Pacific is the fastest region at 24.4% CAGR to 2031.
Note: Market size and forecast figures in this report are generated using Mordor Intelligence’s proprietary estimation framework, updated with the latest available data and insights as of 2026.
Global Digital Experience Monitoring Market Trends and Insights
Drivers Impact Analysis*
| Driver | (~) % Impact on CAGR Forecast | Geographic Relevance | Impact Timeline |
|---|---|---|---|
| Proliferation of mobile and web applications | +3.2% | Global; higher in Asia-Pacific and North America | Short term (≤ 2 years) |
| Cloud-native and micro-services complexity | +4.1% | North America and Europe | Medium term (2-4 years) |
| DevOps and SRE observability adoption | +2.8% | North America and Europe | Medium term (2-4 years) |
| AI-driven autonomous remediation | +3.5% | North America and Europe | Long term (≥ 4 years) |
| 5G and edge-computing last-mile visibility | +2.1% | Asia-Pacific core | Long term (≥ 4 years) |
| ESG-linked digital sustainability metrics | +1.3% | Europe leading | Long term (≥ 4 years) |
| Source: Mordor Intelligence | |||
Cloud-Native and Micro-Services Complexity
The shift from monoliths to distributed microservices has multiplied service dependencies and raised failure blast-radius risk. Enterprises now average more than 10 monitoring tools, prompting demand for unified dashboards that stitch traces, metrics, and logs to user-experience KPIs. A regional study showed 61% of Asia-Pacific firms using five or more tools, underscoring tool sprawl pressures.[1]New Relic, “Observability Trends in Asia-Pacific 2024,” newrelic.com Vendors that auto-discover service meshes and surface dependency maps are gaining traction with platform teams seeking faster incident triage.
AI-Driven Autonomous Remediation
Experience monitoring is evolving from reactive alerting to predictive self-healing. Cisco ThousandEyes now analyzes 650 billion daily measurements to foresee internet outages and trigger policy-based fixes before users notice.[2]Cisco Systems, “Cisco Completes Splunk Acquisition,” cisco.com Large language models add natural-language query interfaces that lower the skills bar for deep root-cause analysis. Early adopters report marked MTTR reductions when AI closes feedback loops between detection and remediation.
DevOps and SRE Observability Adoption
Site Reliability Engineering practices embed SLIs and SLOs into CI/CD workflows, turning experience metrics into release gates. Organizations that integrate end-user telemetry with deployment pipelines have trimmed network-issue resolution times by up to 75%. Central observability teams are standardizing data models to align developers and operators around the same experience baseline.
5G and Edge-Computing Last-Mile Visibility
Ultra-low-latency services such as cloud gaming and connected robotics demand millisecond-level insight across distributed edge nodes. Research shows hybrid edge deployments can lower latency by 11%, yet introduce complex multi-hop paths that legacy tools miss.[3]Arxiv.org “Latency Reduction via Hybrid Edge Architectures,” arxiv.org Real-time telemetry that spans device, edge, and cloud layers is becoming critical to assure quality of experience in healthcare, autonomous vehicles, and smart-factory scenarios.
Restraints Impact Analysis*
| Restraint | (~) % Impact on CAGR Forecast | Geographic Relevance | Impact Timeline |
|---|---|---|---|
| Diverse digital ecosystem complexity | -2.7% | Global; large enterprises | Medium term (2-4 years) |
| High cost and integration effort of DEM suites | -3.1% | Global; SMEs | Short term (≤ 2 years) |
| Data-privacy limits on session capture | -1.8% | Europe lead | Long term (≥ 4 years) |
| Talent scarcity in experience engineering | -2.4% | North America and Europe | Medium term (2-4 years) |
| Source: Mordor Intelligence | |||
High Cost and Integration Effort of DEM Suites
Full-stack DEM deployments can consume up to 30% of infrastructure budgets, straining SME resources. Integration hurdles—ranging from custom data collectors to SSO harmonization—extend rollout cycles and inflate total cost of ownership. Many smaller firms delay purchases until vendors offer modular, pay-as-you-grow packages or managed-service options that shift capex to opex.
Data-Privacy Limits on Session Capture
Regulations such as GDPR restrict granular session-replay data, pushing vendors to anonymize or sample user journeys. Compliance safeguards add overhead and can leave blind spots in behavioral analytics, complicating root-cause analysis for conversion-critical workflows in finance and healthcare. Vendors are responding with edge-scrubbing and differential-privacy techniques, but the trade-off between depth and legality remains a key adoption barrier.
*Our forecasts treat driver/restraint impacts as directional, not additive. The impact forecasts reflect baseline growth, mix effects, and variable interactions.
Segment Analysis
By Type: API Monitoring Drives Innovation
Synthetic and STM tools held 34.21% share of the digital experience monitoring market size in 2025 thanks to their preventative testing coverage. API monitoring, however, is expanding at 19.4% CAGR as organizations migrate to micro-services and treat APIs as revenue generators. Real-user monitoring remains vital for live journey insights, while network performance diagnostics ensure transport-layer visibility.
API-first strategies expose uptime vulnerabilities: one study recorded a year-over-year API availability decline from 99.66% to 99.45%, equating to 18 hours of annual downtime. Investment is therefore shifting toward deep API trace analytics, contract testing, and automated rollback triggers to protect customer interactions.


By Component: Services Acceleration Reflects Complexity
Software dominated at 70.55% in 2025 as platforms consolidated data ingestion, analytics, and visualization layers. The services segment, advancing at 19.92% CAGR, signals rising demand for design, integration, and managed operations expertise. Professional-service teams craft observability roadmaps, while managed-service providers run 24×7 command centers for clients lacking internal talent. Organizations adopting managed DEM report faster value capture, with some compressing deployment cycles to under 90 days and cutting incident backlogs by double-digit percentages once continuous optimization is outsourced to specialist partners.
By Deployment: Cloud Dominance Accelerates
Cloud options captured 67.85% of the digital experience monitoring market share in 2025 and are growing at 21.66% CAGR as enterprises favor scalability and quick onboarding. On-premises installations persist for regulated workloads but are trending downward.
Rapid lift-and-shift projects often bundle SaaS-based DEM to maintain visibility across transient container clusters. Field evidence shows enterprises completing full-stack cloud DEM rollouts in 90 days, versus year-long timelines for on-prem equivalents.
By Enterprise Size: SME Growth Signals Democratization
Large enterprises retained 63.05% revenue share in 2025, yet SMEs are clocking a 23.63% CAGR as subscription models and low-touch deployment wizards lower entry barriers. Cloud-native tools that auto-instrument code without agent installs appeal to resource-constrained teams.
Despite progress, SMEs cite cost, skills, and awareness gaps as lingering obstacles. Industry associations advise vendors to package training modules and outcome-based pricing to sustain SME momentum.
By End-User: Retail Transformation Drives Adoption
IT-telecom led with 31.42% of the digital experience monitoring market size in 2025, reflecting complex multi-cloud estates and stringent SLA targets. Retail and e-commerce, expanding at 24.84% CAGR, treats page-load latency and checkout errors as direct revenue drains.
Retailers that embed DEM analytics into merchandising dashboards have correlated 1-second load-time gains with 2% conversion uplifts, reinforcing budget prioritization for full-journey telemetry.
Geography Analysis
North America led with a 42.30% slice of the digital experience monitoring market in 2025, powered by deep cloud penetration, high SaaS spending, and vendor headquarters concentration. United States enterprises demand cross-domain analytics that bridge network and application layers, while Canadian firms emphasize compliance-aligned monitoring for cross-border data flows. Mexico’s manufacturing digitization and surging e-commerce activity are spawning niche opportunities for localized service providers.
Asia Pacific, expanding at 24.4% CAGR, is reshaping global growth patterns. China’s large-scale cloud migrations, Japan’s smart-factory investments, India’s fast-growing digital-health ecosystem, and South Korea’s 5G leadership each create fertile ground for DEM. Regional data-center capacity build-outs and government-backed digital-economy programs further spur adoption.
Europe remains a sizable market where GDPR drives demand for privacy-aware session analytics. The United Kingdom, Germany, and France pioneer GDPR-aligned observability blueprints. Eastern European banks and telcos are ramping spending on omni-channel experience metrics to stay competitive. South America and the Middle East and Africa are earlier in the curve but show steady momentum, led by Brazil’s fintech boom and the UAE’s e-government initiatives.


Competitive Landscape
The digital experience monitoring market is moderately fragmented. Dynatrace, Datadog, and New Relic anchor the leader quadrant, while Cisco’s USD 28 billion acquisition of Splunk in March 2024 forged a heavyweight combining network, security, and observability assets. Riverbed, Catchpoint, and Aternity focus on network and endpoint specialization, whereas cloud-native entrants like Grafana Labs and Honeycomb emphasize open telemetry.
Strategic themes center on AI-enhanced troubleshooting, platform unification to curb tool sprawl, and edge-aware instrumentation. Vendors are embedding natural-language interfaces and anomaly-explainability features to widen user adoption across business and ops teams. SME-targeted SaaS tiers and sector-specific accelerators (healthcare, manufacturing) are emerging as white-space plays.
Partnership momentum is growing between DEM vendors and cloud providers, CDNs, and SASE platforms to deliver integrated service-level assurances. Competitive pressure is likely to intensify as hyperscalers bundle native observability add-ons and as open-source projects mature.
Digital Experience Monitoring Industry Leaders
Broadcom Inc.
Dynatrace LLC
GlassBox
AppDynamics LLC
New Relic Inc
- *Disclaimer: Major Players sorted in no particular order

Recent Industry Developments
- October 2024: Datadog positioned as a Leader in Gartner’s inaugural Digital Experience Monitoring Magic Quadrant.
- June 2024: New Relic integrated with NVIDIA NIM, adding full AI-stack observability.
- June 2024: Cisco ThousandEyes launched AI-powered Digital Experience Assurance to predict internet outages.
- March 2024: Cisco closed its USD 28 billion Splunk acquisition, creating a joint observability-security platform.


Global Digital Experience Monitoring Market Report Scope
Digital experience monitoring (DEM) is an IT management technology that measures performance and helps IT and IT operations teams resolve issues by monitoring the health of all systems between end users and applications.
The digital experience monitoring market is segmented by type (synthetic monitoring and synthetic transaction monitoring (STM) tools, real user monitoring (RUM) tools, application performance monitoring (APM) tools, network performance monitoring and diagnostics (NPMD) tools, endpoint monitoring tools), offering (software, services [managed services, professional services l]), deployment type (on-premises, cloud), enterprise size (SMES, large enterprises) end-user (BFSI, media and entertainment, government, IT and telecommunication, healthcare, retail and E-commerce, travel & hospitality, other end users), geography (North America, Europe, Asia Pacific, Latin America, Middle East and Africa). The report offers market forecasts and size in value (USD) for all the above segments.
| Synthetic and STM Tools |
| Real-User Monitoring (RUM) Tools |
| Application Performance Monitoring (APM) Tools |
| Network Performance Monitoring and Diagnostics (NPMD) Tools |
| Endpoint Monitoring Tools |
| API Experience Monitoring Tools |
| Software | |
| Services | Professional Services |
| Managed Services |
| Cloud |
| On-premises |
| Small and Medium-sized Enterprises (SMEs) |
| Large Enterprises |
| IT and Telecom |
| BFSI |
| Healthcare |
| Retail and E-commerce |
| Government |
| Media and Entertainment |
| Travel and Hospitality |
| Manufacturing |
| Other End-Users |
| North America | United States | |
| Canada | ||
| Mexico | ||
| South America | Brazil | |
| Argentina | ||
| Rest of South America | ||
| Europe | United Kingdom | |
| Germany | ||
| France | ||
| Italy | ||
| Spain | ||
| Russia | ||
| Rest of Europe | ||
| Asia-Pacific | China | |
| Japan | ||
| India | ||
| South Korea | ||
| Rest of Asia-Pacific | ||
| Middle East and Africa | Middle East | Saudi Arabia |
| United Arab Emirates | ||
| Turkey | ||
| Rest of Middle East | ||
| Africa | South Africa | |
| Nigeria | ||
| Kenya | ||
| Rest of Africa | ||
| By Type | Synthetic and STM Tools | ||
| Real-User Monitoring (RUM) Tools | |||
| Application Performance Monitoring (APM) Tools | |||
| Network Performance Monitoring and Diagnostics (NPMD) Tools | |||
| Endpoint Monitoring Tools | |||
| API Experience Monitoring Tools | |||
| By Component | Software | ||
| Services | Professional Services | ||
| Managed Services | |||
| By Deployment | Cloud | ||
| On-premises | |||
| By Enterprise Size | Small and Medium-sized Enterprises (SMEs) | ||
| Large Enterprises | |||
| By End-User | IT and Telecom | ||
| BFSI | |||
| Healthcare | |||
| Retail and E-commerce | |||
| Government | |||
| Media and Entertainment | |||
| Travel and Hospitality | |||
| Manufacturing | |||
| Other End-Users | |||
| By Geography | North America | United States | |
| Canada | |||
| Mexico | |||
| South America | Brazil | ||
| Argentina | |||
| Rest of South America | |||
| Europe | United Kingdom | ||
| Germany | |||
| France | |||
| Italy | |||
| Spain | |||
| Russia | |||
| Rest of Europe | |||
| Asia-Pacific | China | ||
| Japan | |||
| India | |||
| South Korea | |||
| Rest of Asia-Pacific | |||
| Middle East and Africa | Middle East | Saudi Arabia | |
| United Arab Emirates | |||
| Turkey | |||
| Rest of Middle East | |||
| Africa | South Africa | ||
| Nigeria | |||
| Kenya | |||
| Rest of Africa | |||


Key Questions Answered in the Report
What is the current size of the digital experience monitoring market?
The market is valued at USD 4.15 billion in 2026.
How fast is the digital experience monitoring market expected to grow?
It is forecast to register a 16.83% CAGR and reach USD 9.02 billion by 2031.
Which region is growing the fastest for digital experience monitoring solutions?
Asia Pacific leads with a projected 24.4% CAGR through 2031.
Why is API monitoring gaining importance within digital experience monitoring?
API-first architectures increase dependency on interfaces whose downtime directly affects user journeys; specialised API monitoring is growing at 19.4% CAGR.
Page last updated on:


