Mobile Wallet Market Size and Share
Market Overview
| Study Period | 2020 - 2031 |
|---|---|
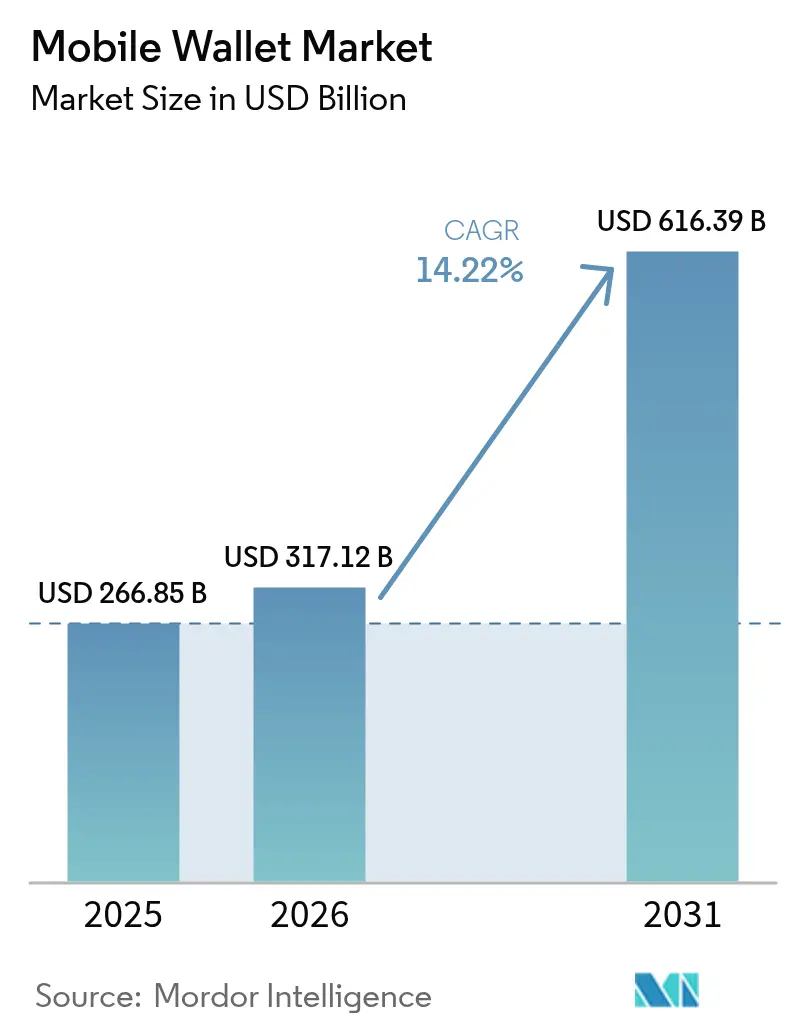
| Market Size (2026) | USD 317.12 Billion |
| Market Size (2031) | USD 616.39 Billion |
| Growth Rate (2026 - 2031) | 14.22% CAGR |
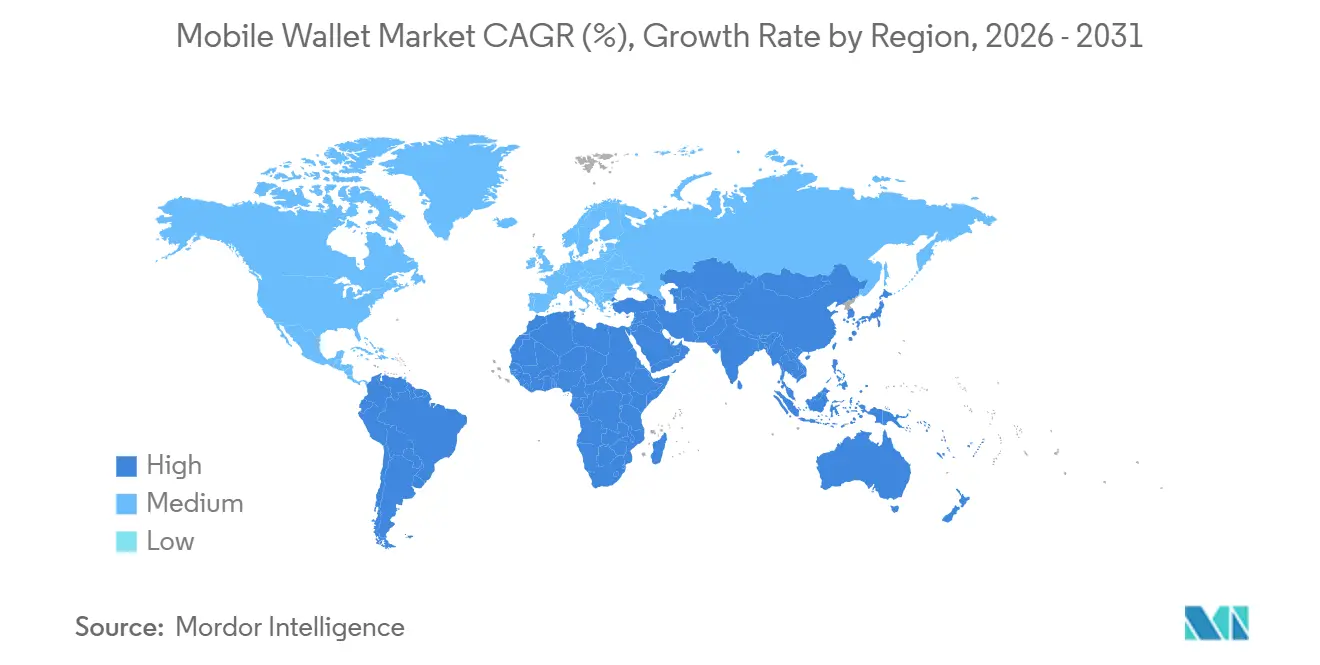
| Fastest Growing Market | Africa |
| Largest Market | Asia Pacific |
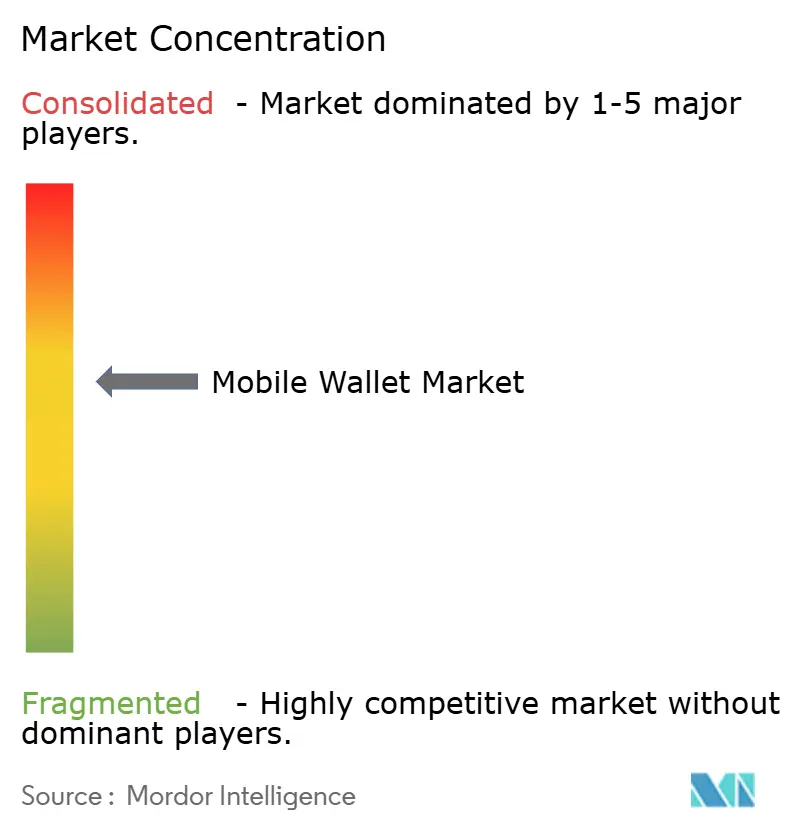
| Market Concentration | Medium |
Major Players *Disclaimer: Major Players sorted in no particular order Image © Mordor Intelligence. Reuse requires attribution under CC BY 4.0. | |
Mobile Wallet Market Analysis by Mordor Intelligence
The mobile wallet market size is projected to expand from USD 266.85 billion in 2025 and USD 317.12 billion in 2026 to USD 616.39 billion by 2031, registering a CAGR of 14.2% between 2026 to 2031. National instant-payment infrastructure that settles within seconds, merchant acceptance of low-cost QR codes across emerging economies, and super-app ecosystems that weave payments with commerce, lending, and logistics. Asia-Pacific currently dominates revenue on the back of China’s WeChat Pay and Alipay duopoly and India’s Unified Payments Interface, while Africa is delivering the quickest regional lift as mobile-money balances migrate into interoperable wallets. Product innovation has shifted from simply acquiring users to deepening ecosystems through biometric authentication, cross-border interoperability, and value-added services such as insurance distribution. At the same time, wallet operators are re-calibrating revenue models in response to interchange-fee caps, fragmented know-your-customer rules, and rising biometric fraud.
Key Report Takeaways
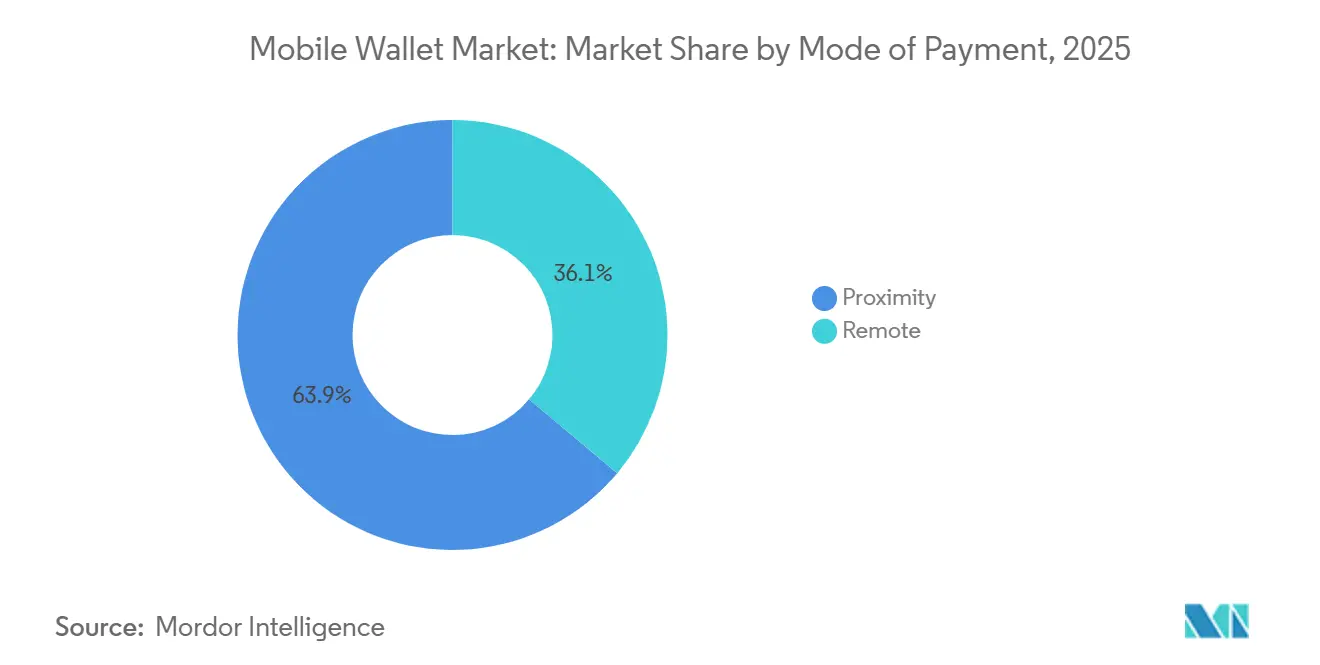
- By mode of payment, proximity transactions led with 63.89% revenue share in 2025, while remote payments are advancing at a 16.37% CAGR through 2031.
- By wallet type, closed wallets held 45.67% share of the mobile wallet market in 2025, whereas open wallets are forecast to expand at 15.14% CAGR over 2026-2031.
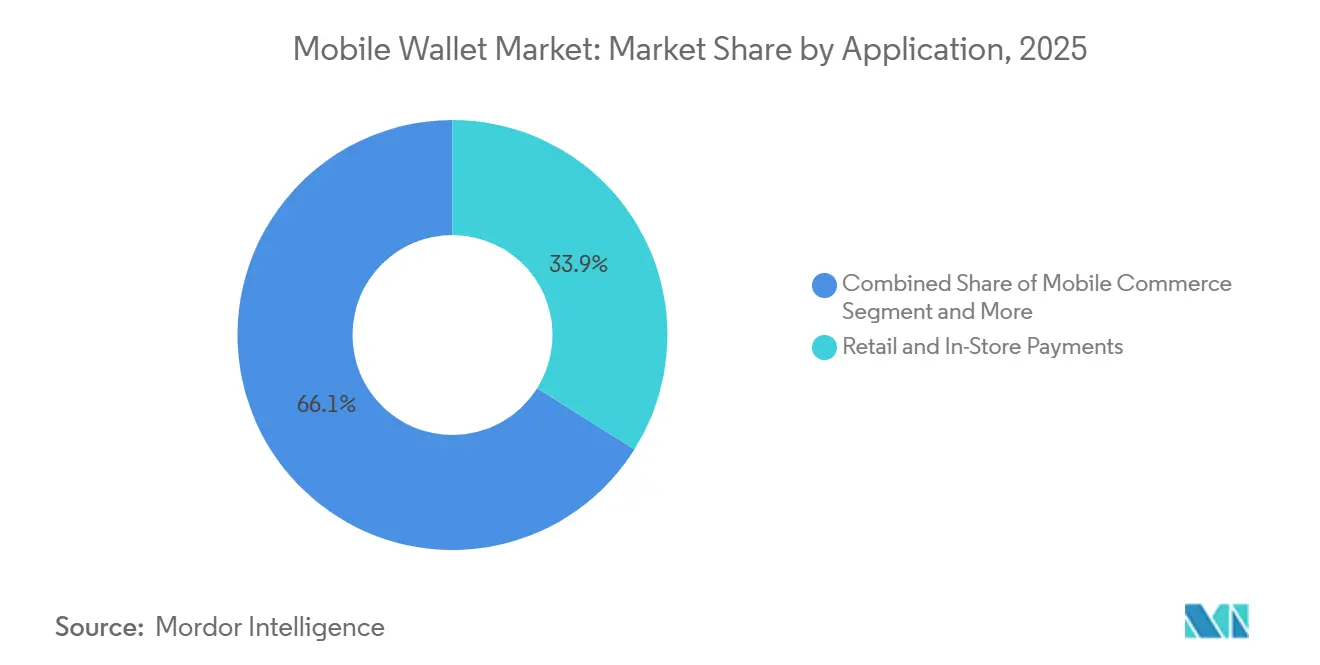
- By application, retail and in-store payments accounted for 33.92% of 2025 revenue, and bill payments are the fastest-growing sub-segment at 17.27% CAGR to 2031.
- By geography, Asia-Pacific captured 48.59% of revenue in 2025, while Africa is projected to post the highest regional growth at 18.16% CAGR during the forecast horizon.
- By end-user, personal wallets dominated with 81.59% transaction volume in 2025, whereas business wallets are forecast to progress at a 16.46% CAGR to 2031.
Note: Market size and forecast figures in this report are generated using Mordor Intelligence’s proprietary estimation framework, updated with the latest available data and insights as of 2026.
Global Mobile Wallet Market Trends and Insights
Drivers Impact Analysis*
| Driver | (~) % Impact on CAGR Forecast | Geographic Relevance | Impact Timeline |
|---|---|---|---|
| Rapid Merchant Adoption of QR-Code Wallets Across Southeast Asia | +2.8% | Southeast Asia, India, Latin America | Short term (≤ 2 years) |
| Growth in Super-App Ecosystems Integrating Payments in China and India | +2.5% | Asia-Pacific core, spill-over to Middle East and Africa | Medium term (2-4 years) |
| Government-Mandated Real-Time Payment Rails Boost Wallet Uptake | +3.1% | Global, with early gains in India, Brazil, United States | Medium term (2-4 years) |
| Transit Authorities Shifting to Contactless Fare Collection | +1.6% | Europe, North America, Asia-Pacific urban centers | Long term (≥ 4 years) |
| Open-Banking APIs Enabling Account-Funded Wallets in Europe and the United Kingdom | +2.0% | Europe, United Kingdom, expanding to Australia and Singapore | Medium term (2-4 years) |
| Rise of Embedded Finance in B2B SaaS Platforms Integrating Wallets | +1.4% | North America, Europe, Asia-Pacific enterprise hubs | Long term (≥ 4 years) |
| Source: Mordor Intelligence | |||
Government-Mandated Real-Time Payment Rails Boost Wallet Uptake
Instant-payment systems that settle in under three seconds are reshaping consumer expectations and lowering merchant costs. India’s Unified Payments Interface recorded 16.58 billion transactions in December 2025, more than doubling year-on-year as zero-fee peer transfers keep funds parked in wallets rather than bank deposits. Brazil’s PIX registered 42.5 billion payments in 2025 after the central bank required every licensed wallet to support PIX transfers, eroding card network dominance. FedNow’s roll-out in the United States brought 900 banks onto an always-on rail by January 2026, letting PayPal and Cash App provide instant account-to-account payouts. Europe’s TARGET Instant Payment Settlement mandate is accelerating similar behavior by making real-time transfers a universal right across the euro area.[1]European Commission, “Interchange Fee Regulation – Press Release,” ec.europa.eu Lower remittance fees and faster settlement strengthen the preference for holding balances in wallets, lifting transaction frequency and stickiness.
Rapid Merchant Adoption of QR-Code Wallets Across Southeast Asia
National QR frameworks, such as Indonesia’s QRIS and Thailand’s PromptPay, let any wallet scan any merchant code, removing hardware costs that once deterred micro-enterprises. QRIS handled 18.2 billion payments worth IDR 621 trillion (USD 39.4 billion) in 2025, a 47% rise on the year.[2]Bank Indonesia, “QRIS Transaction Statistics 2025,” bi.go.id PromptPay counted 74 million users by December 2025 and now supports cross-border scans throughout the ASEAN Payment Connectivity corridor. Compared with near-field communication terminals priced at USD 150-300, printed QR stickers cost almost nothing, making acceptance viable for merchants earning under USD 500 in monthly sales. The same economics are moving westward as Brazil’s PIX QR codes surpassed debit-card volume in 2025. As merchant ubiquity deepens, consumers gain confidence that a single wallet works anywhere, reinforcing adoption without costly subsidies.
Growth in Super-App Ecosystems Integrating Payments in China and India
WeChat Pay and Alipay converted payment utilities into multi-vertical hubs where wallet balances fund ride-hailing, food delivery, investments, and micro-insurance. Alipay alone hosted more than 3 million mini-programs by late 2025.[3]Alibaba Group, “Investor Relations – Financial Reports,” alibabagroup.com India’s PhonePe achieved 6.9 billion Unified Payments Interface transactions in December 2025 by embedding gold savings and mutual-fund purchases inside the wallet. As wallets broaden into commerce and credit, user churn drops because daily life converges on a single super-app. Operators unable to match this breadth experience stagnant revenue despite healthy payment counts, a pattern evident in Paytm’s lower average revenue per user relative to PhonePe.
Open-Banking APIs Enabling Account-Funded Wallets in Europe and the United Kingdom
Revised Payment Services Directive guidelines require wallet issuers to expose application programming interfaces for both account information and payment initiation, allowing third-party software to pull or push funds without card rails. Challenger banks such as Revolut are already licensing their wallet rails to e-commerce platforms that want embedded finance without a banking license. In the United Kingdom, the Competition and Markets Authority’s open-banking roadmap has helped retailers drop merchant discount rates from 1.8% for cards to under 0.5% for account-funded wallet payments, spurring adoption. Australia, Singapore, and Canada are importing similar standards, creating a common playbook that privileges wallets capable of real-time bank connectivity.
Restraints Impact Analysis*
| Restraint | (~) % Impact on CAGR Forecast | Geographic Relevance | Impact Timeline |
|---|---|---|---|
| Interchange-Fee Caps in Europe Squeeze Wallet Revenue Models | -1.2% | Europe, United Kingdom | Short term (≤ 2 years) |
| Patchy NFC Handset Penetration in Latin America | -0.9% | Latin America, Sub-Saharan Africa | Medium term (2-4 years) |
| Mid-Tier Android Base | -0.6% | South Asia, Southeast Asia, Africa | Medium term (2-4 years) |
| Fragmented KYC Rules Delaying Onboarding in the Middle East | -0.7% | Middle East, North Africa | Short term (≤ 2 years) |
| Growing Deep-Fake Biometric Fraud Undermines Trust in Digital KYC | -0.8% | Global, concentrated in high-fraud markets | Long term (≥ 4 years) |
| Source: Mordor Intelligence | |||
Interchange-Fee Caps in Europe Squeeze Wallet Revenue Models
Interchange on consumer cards in the European Union is capped at 0.2% for debit and 0.3% for credit, leaving wallet operators with sub-0.15% economics once network fees are paid. Revolut, which processed GBP 200 billion (USD 253 billion) of volume in 2025, now earns barely one-fifth of its revenue from interchange and instead monetizes subscriptions and foreign-exchange spreads. The forthcoming Payment Services Directive 3 may further restrict merchant-paid fees for instant account-to-account transfers, nudging wallets toward freemium tiers that charge for budgeting or crypto modules. Infrastructure providers like Adyen have already redirected investment toward markets where blended rates exceed 1.2%, while smaller European-only players are wrestling with negative operating margins.
Patchy NFC Handset Penetration in Latin America
Only one-third of smartphones in Latin America possess near-field communication secure elements required for tokenized tap-and-go payments.[4]GSMA, “Mobile Economy Latin America 2025,” gsma.com Mid-tier Android models often ship with the chip but lack certification, compelling wallets to rely on QR codes that add 8-12 seconds at checkout. Mexico’s central bank reported contactless penetration of just 22% at the point of sale in January 2026, underscoring the hardware gap. Argentina’s lengthening device-replacement cycle further slows progress, with handsets averaging 3.8 years of age in 2025. Until carriers and handset makers close this feature divide, real-world adoption of tap-based wallets will trail the gains seen in Asia-Pacific and Europe.
*Our forecasts treat driver/restraint impacts as directional, not additive. The impact forecasts reflect baseline growth, mix effects, and variable interactions.
Segment Analysis
By Mode of Payment: Proximity Retains Scale, Remote Accelerates
Proximity transactions commanded 63.89% of 2025 revenue, reinforcing their status as the anchor of the mobile wallet market. Retail checkouts, transit gate taps, and vending machines all benefit from sub-two-second authentication using near-field communication chips or printed QR codes. Remote flows, covering e-commerce, in-app purchases, and peer transfers, are expanding at a 16.37% CAGR to 2031 as merchants promote embedded checkout that auto-fills wallet credentials, cutting cart abandonment by double-digit margins. Open-loop real-time rails such as PIX and Unified Payments Interface have trimmed online merchant fees from above 2% to below 0.5%, motivating platforms to prefer wallets over cards.
Poximity grew at 9.2% CAGR between 2020 and 2025, whereas remote posted 21.4%. Remote share is forecast to approach 42% by 2031 as voice-commerce and connected appliances place wallet tokens inside smart speakers and refrigerators. Even so, fuel stations, quick-service restaurants, and metro systems will keep proximity indispensable because offline capability and immediate confirmation remain critical at those locations.


By Wallet Type: Closed Networks Still Lead, Interoperable Open Wallets Surge
Closed wallets held 45.67% of mobile wallet market share in 2025 thanks to strong loyalty programs that boost customer lifetime value. Semi-closed models, accepted only at contracted merchant networks, added another 31% but face structural headwinds where regulators favor open access. Open wallets, enabled to move money to banks, peers, or ATMs, are forecast to grow at 15.14% CAGR as governments outlaw platform lock-in. India’s Unified Payments Interface treats every wallet as an addressable endpoint, a move that helped open wallets seize 92% of December 2025 transaction volume.
Brazil followed in 2024, mandating PIX connectivity for all issuers, while Europe’s open-banking rules etched interoperability into law. Closed ecosystems still win in high-frequency micro-purchases such as coffee chains or ride-hailing, where stored balances cut authentication friction. Yet their collective share is projected to slide to 38% by 2031 as consumers balk at juggling multiple siloed balances.
By Application: Retail Dominates, Bill Payments Gain Momentum
Retail and in-store payments represented 33.92% of 2025 revenue, underpinned by grocery chains, fuel stations, and quick-service restaurants that trimmed cash-handling costs by up to 30%. Mobile commerce accounted for 28% of wallet volume as one-click payment reduced checkout to under eight seconds. The fastest-growing slice, however, is bill payments and recharges, advancing at 17.27% CAGR as utilities and telecoms embed wallet links inside digital invoices. India’s Bharat Bill Payment System handled 1.2 billion invoices worth INR 1.8 trillion (USD 21.6 billion) in 2025.
Money transfers, domestic and cross-border, are riding real-time rails to log double-digit growth, while transport and toll payments, though only 6% of volume, foster daily-use habits that spill over into retail purchases. Food delivery and hospitality grew 13.6% as platforms like DoorDash dangled wallet-exclusive discounts to reduce customer-acquisition spend.

By End-User: Personal Volume Prevails, Business Wallets Scale on Embedded Finance
Personal users generated 81.59% of 2025 transactions because peer-to-peer, retail, and bill pay originated in the consumer domain. Business uptake is advancing at 16.46% CAGR to 2031 as software-as-a-service providers embed wallet modules into procurement, payroll, and invoicing. Stripe Treasury had enrolled over 4,000 platforms by December 2025, letting each embed white-label wallets for gig-worker payouts.
Cash App Pay for Business removed point-of-sale hardware costs for sole proprietors and processed USD 228 billion in 2025 volume. Although personal wallets fire more transactions, 18 to 24 per month versus 8 to 12 for business, average tickets in the business segment are larger, raising revenue per payment. Businesses also cost less to acquire because enrollments occur through software integrations rather than mass-market advertising.
Geography Analysis
Asia-Pacific owned 48.59% of 2025 revenue, with China’s super-apps and India’s real-time infrastructure setting global usage records. Rural China saw mobile payments climb 29% in 2025 as farmers and social-welfare recipients swapped cash for QR scans. India posted a 38% jump in Unified Payments Interface transactions, aided by QR mandates for grocery and pharmacy chains. Japan’s wallet penetration still lags at 42% because of entrenched cash habits but is improving under a 2024 mandate requiring small businesses to accept digital payments. South Korea’s Kakao Pay and Naver Pay jointly processed KRW 186 trillion (USD 140 billion) in 2025 after open-banking rules unlocked direct transfers.
Africa is the fastest-growing region, tracking an 18.16% CAGR to 2031. Kenya’s M-Pesa recorded 33.6 million active users who executed KES 38.5 trillion (USD 298 billion) in 2025 payments. MTN MoMo served 68 million users and moved USD 146 billion across its 15-country footprint. Nigeria’s mandate for wallet interoperability catalyzed a 67% jump in wallet-to-wallet transfers in 2025. South Africa, despite stricter licensing rules, still notched 19% annual growth as large grocers rolled out QR acceptance.
North America and Europe show high but slowing adoption, with penetration plateaus at 68% and 61%. Apple Pay processed 48% of United States mobile-wallet transactions in 2025, and FedNow’s arrival is encouraging additional wallet-based account transfers. Canada’s Interac e-Transfer handled CAD 612 billion (USD 450 billion) in 2025 after embedding wallet rails into banking apps. Denmark’s MobilePay reaches 68% penetration, while Germany’s wallet share is just 22% owing to a strong direct-debit culture. In Latin America, Brazil dominates on the back of PIX, whereas Argentina’s triple-digit inflation pushes consumers toward wallets as a hedge against cash erosion. The United Arab Emirates has 58% penetration, but Gulf Cooperation Council onboarding delays range from 14 to 21 days due to fragmented know-your-customer rules.

Competitive Landscape
Market concentration is moderate. The top five players processed 42% of global volume in 2025, yet regional specialists such as GrabPay in Southeast Asia and M-Pesa in East Africa retain defensible niches. Competition has evolved from user-count races to ecosystem depth. Apple’s closed ecosystem generated about USD 8.2 billion in 2025 revenue but now faces European Digital Markets Act rules that compel iOS to open near-field communication access by March 2026. Google Pay processed USD 1.3 trillion without material direct revenue, instead leveraging payment data to cross-sell advertising. Tencent and Ant Group still control over 90% of China’s volume, yet a 2024 cap on QR merchant fees squeezed margins to 0.38%.
Strategic moves continue to reshape boundaries. Visa tokenized 12.3 billion credentials by December 2025, 68% of which feed mobile wallets. Mastercard’s Click to Pay posted 4.2 billion one-click checkouts, cutting abandonment by nearly one-fifth. Revolut secured a European banking license, allowing it to hold deposits and underwrite credit without third-party custodians. Block’s Cash App Pay for Business launched zero-fee settlement to lure micro-merchants away from card readers. Emerging disruptors such as PhonePe are raising near-billion-dollar rounds to finance international expansion.
Technology priorities focus on tokenization, biometrics, and machine learning fraud defenses that keep loss ratios below 0.08%. Apple’s Face ID now authenticates in under one second, matching contactless card speed while enhancing security. Machine-learning models from Adyen and Stripe have driven false-positive declines below 2%, preserving customer experience without sacrificing risk controls. As cross-border payments tighten, Visa’s January 2026 partnership with Brazil’s central bank links PIX to Visa Direct, cutting remittance spreads to 1.2%.
Mobile Wallet Industry Leaders
Apple Inc
Tencent Holdings Ltd.
PayPal Holdings Inc.
Samsung Electronics Co. Ltd.
Visa Inc.
- *Disclaimer: Major Players sorted in no particular order

Recent Industry Developments
- January 2026: Visa partnered with the Central Bank of Brazil to enable cross-border PIX transfers that settle in under 30 seconds with foreign-exchange spreads capped at 1.2 percent.
- December 2025: Apple expanded Apple Pay to Poland, Romania, and Bulgaria, integrating near-field communication fare payments in Warsaw, Bucharest, and Sofia.
- November 2025: PhonePe raised USD 850 million to fund expansion into Southeast Asia and the Middle East, processing 6.9 billion Unified Payments Interface transactions that month.
- October 2025: Mastercard and MTN Group launched tokenized virtual cards across 15 African markets, linking MoMo users to 90 million global merchants.


Global Mobile Wallet Market Report Scope
The mobile wallet, also known as a digital wallet or eWallet, refers to the mobile technology that provides a seamless solution for any business looking to allow users to purchase products in-store and online with added convenience in order to generate further sales. It is a virtual wallet that stores information such as payment cards, including credit and debit cards, and rewards cards on a mobile phone while ensuring the security of such sensitive information.
The Mobile Wallet Market Report is Segmented by Mode of Payment (Proximity and Remote), Wallet Type (Closed, Semi-Closed, and Open), Application (Retail and In-Store Payments, Mobile Commerce, Money Transfer and Remittance, Bill Payments and Recharge, Public Transport and Toll, and Food and Hospitality), End-User (Personal and Business), and Geography (North America, Europe, Asia-Pacific, South America, Middle East, and Africa). The Market Forecasts are Provided in Terms of Value (USD).
| Proximity |
| Remote |
| Closed |
| Semi-Closed |
| Open |
| Retail and In-Store Payments |
| Mobile Commerce |
| Money Transfer and Remittance |
| Bill Payments and Recharge |
| Public Transport and Toll |
| Food and Hospitality |
| Personal |
| Business |
| North America | United States |
| Canada | |
| Mexico | |
| Europe | United Kingdom |
| Germany | |
| France | |
| Italy | |
| Spain | |
| Rest of Europe | |
| Asia-Pacific | China |
| India | |
| Japan | |
| South Korea | |
| Rest of Asia-Pacific | |
| South America | Brazil |
| Argentina | |
| Rest of South America | |
| Middle East | United Arab Emirates |
| Saudi Arabia | |
| Rest of Middle East | |
| Africa | South Africa |
| Nigeria | |
| Rest of Africa |
| By Mode of Payment | Proximity | |
| Remote | ||
| By Wallet Type | Closed | |
| Semi-Closed | ||
| Open | ||
| By Application | Retail and In-Store Payments | |
| Mobile Commerce | ||
| Money Transfer and Remittance | ||
| Bill Payments and Recharge | ||
| Public Transport and Toll | ||
| Food and Hospitality | ||
| By End-User | Personal | |
| Business | ||
| By Geography | North America | United States |
| Canada | ||
| Mexico | ||
| Europe | United Kingdom | |
| Germany | ||
| France | ||
| Italy | ||
| Spain | ||
| Rest of Europe | ||
| Asia-Pacific | China | |
| India | ||
| Japan | ||
| South Korea | ||
| Rest of Asia-Pacific | ||
| South America | Brazil | |
| Argentina | ||
| Rest of South America | ||
| Middle East | United Arab Emirates | |
| Saudi Arabia | ||
| Rest of Middle East | ||
| Africa | South Africa | |
| Nigeria | ||
| Rest of Africa | ||


Key Questions Answered in the Report
How large will global wallet payments become by 2031?
The mobile wallet market size is projected to reach USD 616.39 billion by 2031, expanding at a 14.22% CAGR from 2026.
Which region is growing the fastest?
Africa is expected to register the highest regional CAGR at 18.16% through 2031, fueled by mobile-money conversions and regulatory pushes for interoperability.
What factors most accelerate adoption?
Government-backed instant-payment rails, merchant QR-code ubiquity, and super-app ecosystems that bundle payments with lending and commerce are the primary growth catalysts.
Why are open wallets gaining ground?
Regulatory mandates in India, Brazil, and the European Union require interoperability, enabling users to move balances freely and prompting a 15.14% CAGR for open wallets.
How are revenue models changing in Europe?
Interchange-fee caps have squeezed take rates below 0.15%, pushing European wallet operators toward subscription fees, premium add-ons, and data-driven services.
What is the outlook for business wallets?
Business adoption is forecast to grow at 16.46% CAGR as embedded-finance platforms integrate wallet accounts into procurement, payroll, and marketplace payouts.
Page last updated on:


