Digital Banking Platform Market Size and Share
Market Overview
| Study Period | 2020 - 2031 |
|---|---|
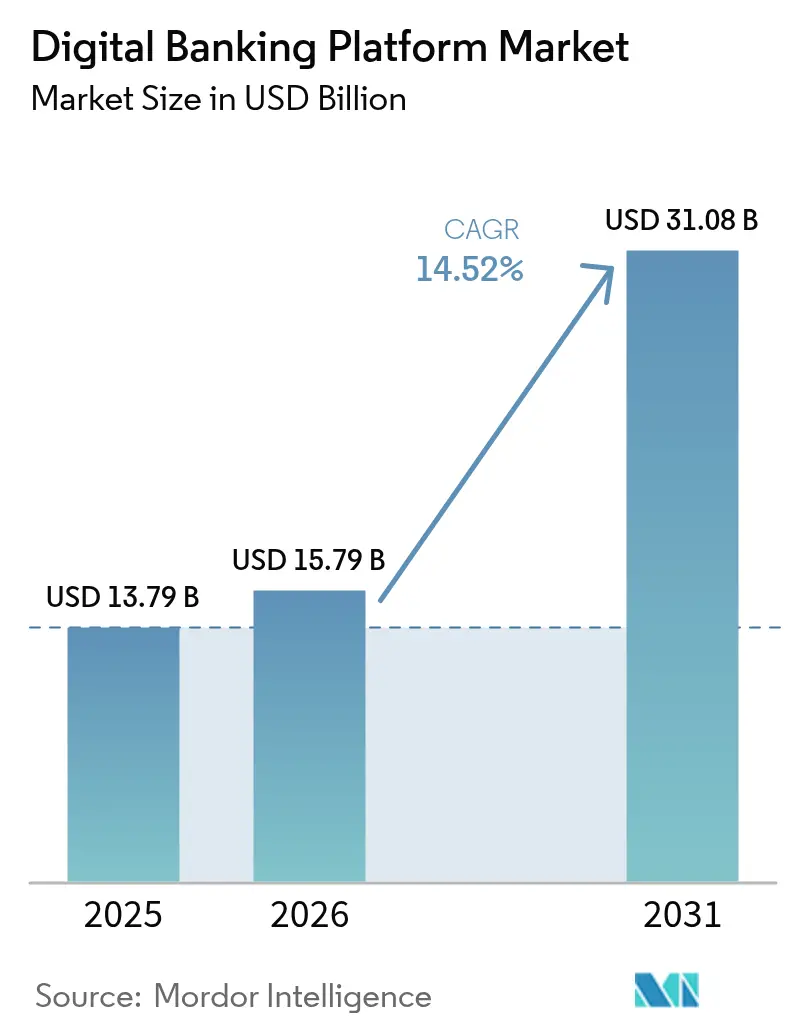
| Market Size (2026) | USD 15.79 Billion |
| Market Size (2031) | USD 31.08 Billion |
| Growth Rate (2026 - 2031) | 14.52% CAGR |
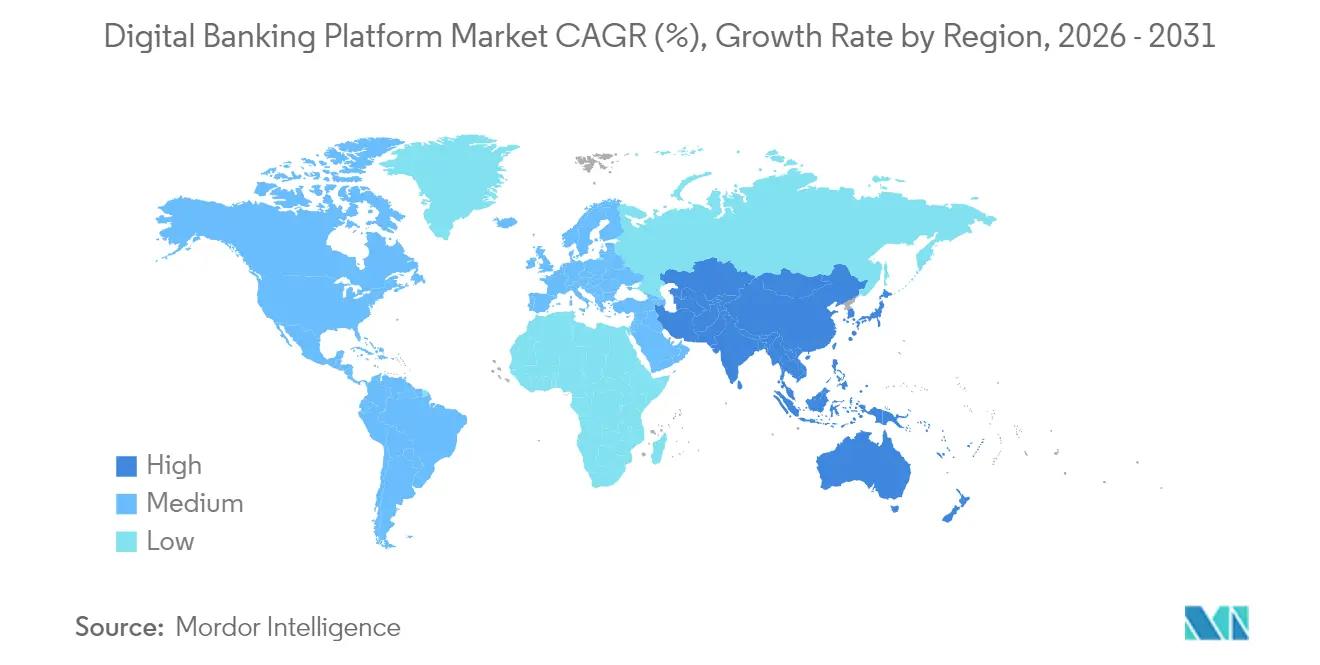
| Fastest Growing Market | Asia-Pacific |
| Largest Market | North America |
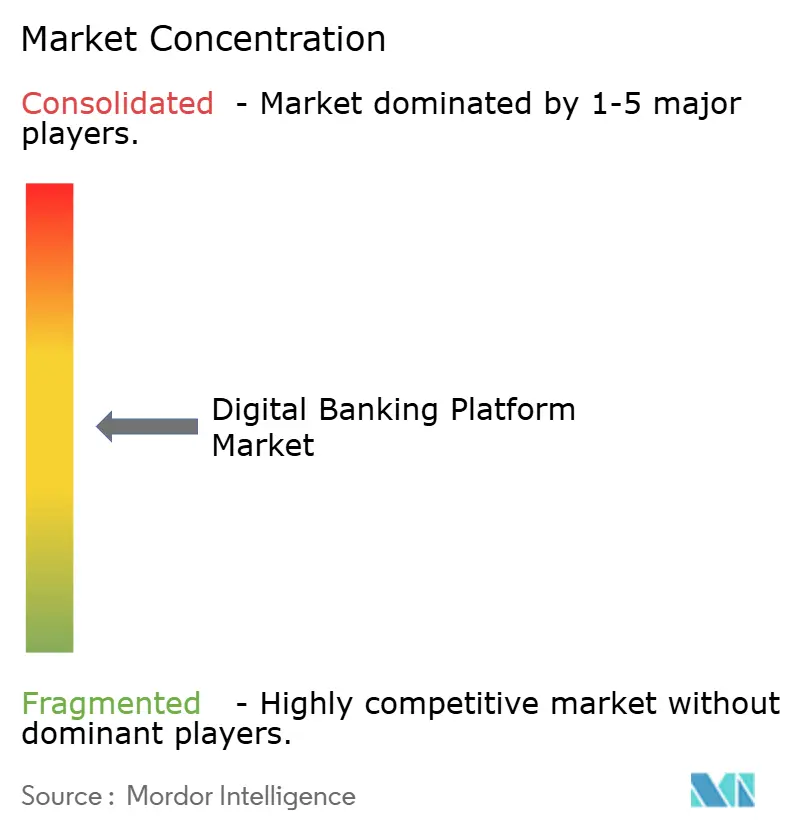
| Market Concentration | Medium |
Major Players *Disclaimer: Major Players sorted in no particular order Image © Mordor Intelligence. Reuse requires attribution under CC BY 4.0. | |
Digital Banking Platform Market Analysis by Mordor Intelligence
The Digital Banking Platform Market size was valued at USD 13.79 billion in 2025 and estimated to grow from USD 15.79 billion in 2026 to reach USD 31.08 billion by 2031, at a CAGR of 14.52% during the forecast period (2026-2031). Rapid cloud-native core migrations, intensifying open-banking mandates, and generative-AI investments together accelerate platform refresh cycles across retail and corporate segments. A 61.2% shift toward cloud deployment in 2024 confirms banks’ preference for scalable subscription models, while Banking-as-a-Service (BaaS) grows fastest at 17.1% CAGR as non-bank brands embed financial services through APIs. Mobile access modes rise at a 17.5% CAGR, reflecting consumers’ preference for location-agnostic interactions. Regionally, Asia-Pacific’s 16.8% CAGR outpaces North America as smartphone penetration and government inclusion programs deepen digital wallet use. Competitive intensity remains moderate; incumbent core vendors defend installed bases as cloud-native challengers capitalize on speed, API breadth, and AI differentiation. Escalating AML compliance costs (USD 213.9 billion annually) and vendor lock-in risks temper momentum, forcing institutions to balance innovation velocity with operational resilience.
Key Report Takeaways
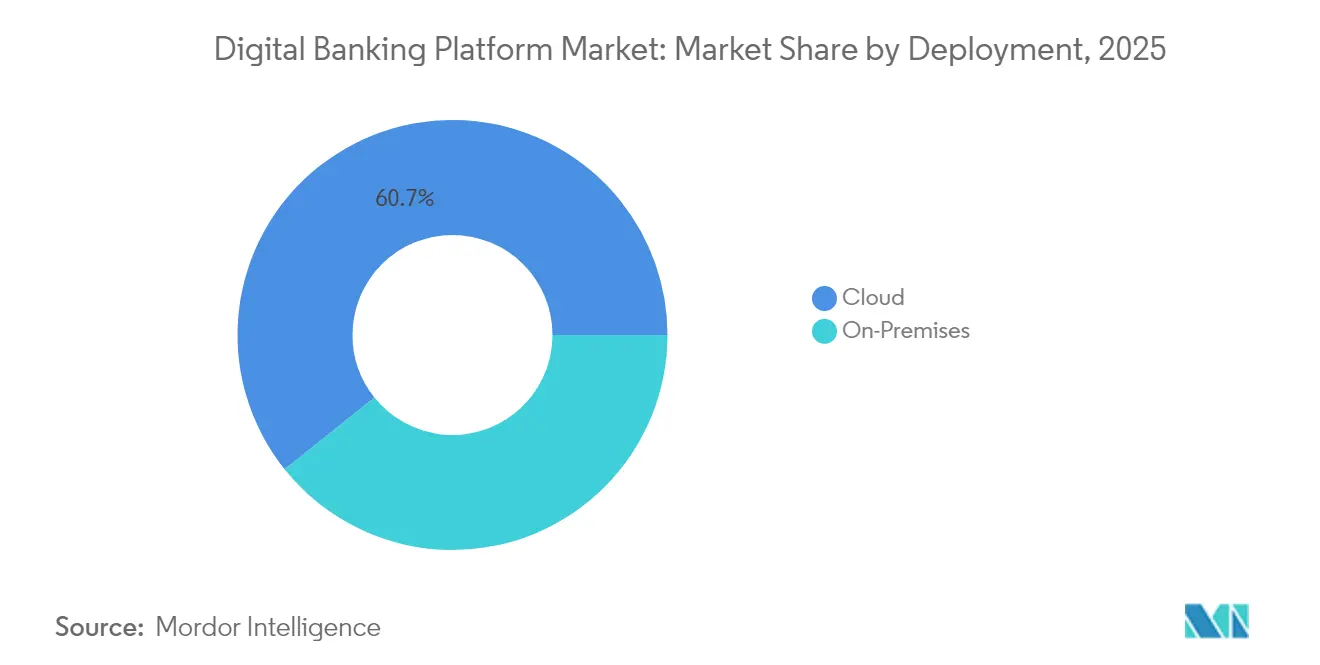
- By deployment, cloud captured 60.74% of the digital banking platform market share in 2025; on-premises trails but remains essential where data-sovereignty laws dominate.
- By banking type, retail led with 63.12% revenue share in 2025, while corporate/SME banking is forecast to expand at a 16.19% CAGR through 2031.
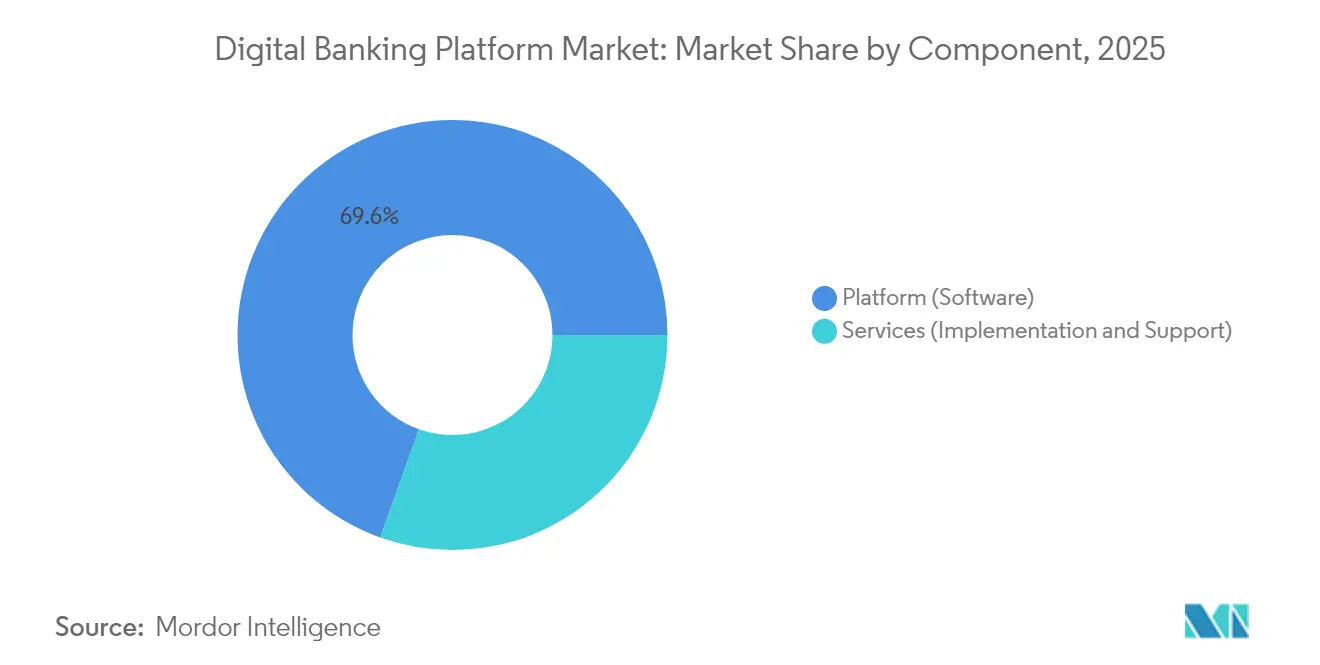
- By component, platform software held 69.55% share of the digital banking platform market size in 2025; services post the highest projected CAGR at 15.98% to 2031.
- By service model, SaaS commanded a 48.05% share in 2025; BaaS is the fastest-growing segment at a 16.68% CAGR despite tightening oversight.
- By access mode, online/web banking retained a 56.12% share in 2025; mobile banking accelerates at a 17.02% CAGR through 2031.
- By geography, North America accounted for 37.35% of the digital banking platform market size in 2025, while Asia-Pacific records the strongest 16.34% CAGR to 2031.
Note: Market size and forecast figures in this report are generated using Mordor Intelligence’s proprietary estimation framework, updated with the latest available data and insights as of 2026.
Global Digital Banking Platform Market Trends and Insights
Drivers Impact Analysis*
| Driver | (~) % Impact on CAGR Forecast | Geographic Relevance | Impact Timeline |
|---|---|---|---|
| Cloud-first core banking migrations | +2.8% | North America, Europe with global spill-over | Medium term (2-4 years) |
| Smartphone-centric lifestyle banking demand | +2.1% | Asia-Pacific core, Latin America, MEA | Short term (≤ 2 years) |
| Open-banking and API-standard regulations | +1.9% | Europe, North America, expanding to APAC | Medium term (2-4 years) |
| Generative-AI driven hyper-personalization | +1.6% | Developed markets worldwide | Long term (≥ 4 years) |
| Green-IT mandates for energy-efficient SaaS | +1.2% | Europe, North America, spreading to APAC | Long term (≥ 4 years) |
| Digital-only neo-bank expansion | +0.9% | Latin America, Southeast Asia, Africa | Short term (≤ 2 years) |
| Source: Mordor Intelligence | |||
Cloud-First Core Banking Migrations Among Tier-1 Banks
Tier-1 institutions fast-track multi-cloud deployments to lower fixed infrastructure costs and compress product launch cycles. JPMorgan Chase has finished a multi-cloud roll-out, while Santander’s ten-market overhaul underlines the commitment required to sunset legacy cores. Banks report 50% shorter time-to-market for new digital products after migration, reinforcing cloud as a strategic lever. Real-time analytics, embedded fraud-detection engines, and AI-based customer insights ride on the same architecture, boosting cross-sell and compliance agility. Banco Itaú intends to complete a 100% cloud move by 2028, a signal to peers that measurable efficiency gains outweigh transition risk. [1]First name not provided, “Banco Itaú planning to migrate 100% of its infrastructure to the cloud by 2028,” BNamericas, bnamericas.com
Smartphone-Centric Lifestyle Banking Demand in Emerging Markets
Mobile-first adoption short-circuits branch expansion economics across Asia-Pacific and Latin America. Digital wallets already underpin more than 70% of regional e-commerce spend, compelling banks to recast their front ends as lifestyle super-apps. Cost economics drive momentum: a mobile transaction costs USD 0.17 against USD 4.25 at the counter, freeing margin for reinvestment in UX refresh and embedded merchant services. Nubank demonstrates scale advantage, growing its customer base from 33.3 million in 2020 to 93.9 million in 2023 while sustaining a 27% pre-tax ROE.
Regulatory Push for Open-Banking and API-Standard Compliance
Successive PSD2 extensions and new CFPB data-access rules compel banks to adopt API-first architectures. Compliance budgets shift from point integrations to shared banking platforms that streamline third-party onboarding while safeguarding data privacy. Eighty-four percent of banks now field requests for embedded services inside non-bank apps, signalling an ecosystem model where platform readiness trumps product exclusivity. Commerce Bank’s FedNow integration via the Temenos stack shows regulation acting as a catalyst for real-time payment upgrades.
Generative-AI Powered Hyper-Personalized UX Roll-Outs
Banks weave generative AI into servicing layers, delivering conversational support, predictive budgeting nudges, and contextual product offers. Early deployments yield 20% productivity gains in software delivery and contact-center throughput. The technology also underpins revenue lift by tailoring credit and savings recommendations around real-time customer events. Temenos’ partnership with NVIDIA for on-premises generative AI exemplifies how vendors package advanced models inside compliant banking frameworks.
Restraints Impact Analysis*
| Restraint | (~) % Impact on CAGR Forecast | Geographic Relevance | Impact Timeline |
|---|---|---|---|
| Rising real-time fraud-analytics and AML cost | −1.4% | Global, highest in developed markets | Short term (≤ 2 years) |
| Vendor lock-in risk with hyperscaler clouds | −1.1% | Global, multi-national banks | Medium term (2-4 years) |
| Cloud-native talent scarcity | −0.8% | APAC, Latin America, Africa | Long term (≥ 4 years) |
| Interoperability gaps with legacy stacks | −0.7% | Global, legacy-heavy institutions | Medium term (2-4 years) |
| Source: Mordor Intelligence | |||
Rising Cost of Real-Time Fraud-Analytics and AML Compliance
Global AML spend has reached USD 213.9 billion. Despite investment, launderers funnel an estimated USD 2 trillion through synthetic IDs and crypto mixers each year. Banks fielded USD 7 billion in fines during 2023 alone. Smart-AML suites promise 60% cost savings through false-positive reduction, yet rollout demands capital and specialist skill, pressuring small-to-mid-tier lenders. [2]First name not provided, “How Smart AML Software Helped Banks Slash Compliance Costs by 60%,” Tookitaki, tookitaki.com
Vendor Lock-In Risks from Hyperscaler Managed Services
Dependence on Amazon, Microsoft, and Google sparks regulatory concern over systemic concentration. The U.S. Treasury notes opacity around outage remediation, while the Bank of England flags resilience gaps. Multi-cloud blueprints mitigate risk but raise integration overhead. The Federal Reserve’s Novel Activities Supervision Program now requires explicit exit strategies, nudging banks to negotiate portability upfront.
*Our forecasts treat driver/restraint impacts as directional, not additive. The impact forecasts reflect baseline growth, mix effects, and variable interactions.
Segment Analysis
By Deployment: Cloud Dominance Accelerates Infrastructure Shift
Cloud captured 60.74% of the digital banking platform market share in 2025 and is expanding at a 15.54% CAGR as institutions convert capex burdens into flexible opex. Banks cite 50% lower infrastructure upkeep and stronger disaster-recovery postures once workloads move to scalable regions. On-premises cores persist in jurisdictions enforcing strict data-localization, but even these deployments now mimic the cloud’s elasticity through container orchestration. EQ Bank’s Temenos-based migration underscores how regional lenders leverage cloud to close capability gaps with money-center peers.
Cloud adoption reshapes vendor economics: subscription licensing aligns revenue with usage peaks, letting banks prototype new services without procurement delays. Real-time analytics, embedded fraud scoring, and AI-driven credit modeling activate natively, reducing integration complexity. In parallel, platform vendors tune data-center designs for energy efficiency, addressing European Green-IT directives and lowering total cost of ownership. As more tier-1 banks publish carbon-net-zero timelines, cloud footprints that demonstrate verifiable emission savings gain a procurement advantage.


By Banking Type: Corporate Banking Emerges as Growth Engine
Retail banking represented 63.12% of 2025 revenue, yet corporate/SME banking now tracks a 16.19% CAGR, making it the fastest sub-segment within the digital banking platform market. Businesses seek real-time liquidity dashboards, API-driven payments, and embedded trade-finance modules that dovetail with ERP workflows. Average implementation deal sizes outstrip retail contracts, supporting higher vendor margins and longer lock-in periods.
Cross-border suppliers in Asia-Pacific elevate demand for instant settlement and dynamic FX hedging within single workspaces. Embedded finance propositions add further lift: fintech partnerships allow manufacturers to embed invoice-discounting or supplier-credit tools directly inside procurement portals, boosting platform stickiness.
By Component: Services Growth Reflects Implementation Complexity
Platform software held 69.55% of the digital banking platform market size in 2025, but the services layer now posts a 15.98% CAGR through 2031 as banks grapple with legacy connectivity, regulatory tailoring, and change management. Integration teams untangle decades-old COBOL code, migrate archives, and map open-banking APIs, tasks seldom covered under license fees.
Services consumption rises further once AI personalization, fraud orchestration, and ESG reporting modules are introduced. Forty-hour sprint cycles for model tuning, penetration testing, and compliance evidence capture require evergreen support contracts. Systems integrators such as TCS and Infosys establish domain squads that specialize in sovereign-cloud variants, giving them a competitive edge where data-residency clauses restrict vendor options.
By Service Model: Banking-as-a-Service Leads Innovation Wave
SaaS still accounts for 48.05% share, but Banking-as-a-Service charges ahead with a 16.68% CAGR, signaling a structural shift: non-banks embed white-label accounts, cards, and lending facilities without acquiring a banking charter. BaaS partnerships let supermarkets or gig-economy platforms bundle financial products into daily experiences, widening addressable deposits.
Regulators, however, spotlight governance gaps. The FDIC has issued multiple consent orders to improve oversight around partner selection and data custody. Banks now vet fintechs for capitalization, fraud posture, and consumer-protection alignment before signing APIs. Vendors that supply compliance dashboards and standardized playbooks accelerate due diligence cycles, keeping BaaS on a growth path despite scrutiny.
By Access Mode: Mobile Banking Transforms User Engagement
Online banking continues to serve complex account administration and document workflows, but mobile’s 17.02% CAGR through 2031 redefines engagement economics. Sixty-two percent of all banking interactions are now mobile, with Millennials and Gen Z cohorts exhibiting app-only behavior. The digital banking platform market gains transaction frequency as push-notification prompts nudge micro-savings and instant credit uptake.
Lower unit processing cost enables banks to redeploy branch staff to advisory roles. Super-app ambitions extend beyond pure finance: ride-hailing, ticketing, insurance, and loyalty marketplaces integrate to convert sign-ins into lifestyle stickiness. The Financial Brand notes consumers increasingly expect contextual offers within their mobile timeline, pushing UX teams toward continuous release cadences.
Geography Analysis
Asia-Pacific drives the fastest advance, recording a 16.34% CAGR that lifts regional contribution within the digital banking platform market. Smartphone saturation, universal QR payment infrastructure, and supportive licensing regimes nurture both incumbent digitization and neo-bank launches. China alone handled USD 7.6 trillion in digital-wallet spend during 2024, while Singapore and Malaysia expand digital-bank quotas to promote competition. Southeast Asia’s digital financial services revenue reached USD 33 billion, confirming commercial viability.
North America retains a 37.35% share, underpinned by deep technology budgets and early-stage cloud adoption. Banks channel spending into AI copilots for credit analytics, FedNow integrations, and ESG-aligned core replacements. Regulatory clarity around open banking is still forming, but investment momentum remains intact as institutions refresh decades-old mainframes. Cloud concentration risk garners oversight, prompting multi-cloud experiments that temper vendor dependency.
Europe balances open-banking leadership with sustainability imperatives. PSD2 has normalized API exposure, while ESG reporting now influences vendor selection energy-efficient SaaS cores earn scorecard preference. Nordic markets illustrate maturity, with nearly 90% digital banking penetration and rapid adoption of biometric authentication. Latin America follows a mobile-first trajectory; Brazil’s Pix rails demonstrate how instant-payment infrastructure accelerates digital adoption. Africa, though nascent, benefits from telco money ecosystems acting as on-ramps to full digital banking, creating greenfield opportunities for cloud-native vendors.

Competitive Landscape
Competition remains moderate, with incumbent core vendors Temenos, Finastra, and FIS leveraging entrenched relationships, while Mambu, Thought Machine, and 10x target greenfield deployments with micro-services cores. Incumbents re-architect monolithic suites into API-first modules, aiming to match challengers’ deployment velocity.
Strategic plays center on capability tuck-ins: Alkami’s USD 400 million purchase of MANTL deepens account-opening depth. Temenos divested Multifonds for USD 400 million, freeing capital to extend AI roadmaps. FIS reports over 3 million accounts on its Modern Banking Platform, signaling traction among mid-market banks.
Vendor differentiation hinges on measurable outcomes - time-to-market reduction, operating-expense savings, and compliance acceleration. Neo-core providers tout deployment in weeks versus years, but must scale support and prove reliability through economic cycles. Services ecosystems shape buying decisions; integrators with certified benches influence RFP shortlists, particularly where banks outsource transformation governance. Platform providers now bundle pre-tested fintech connectors - BNPL, crypto custody, ESG scoring - creating out-of-the-box extensibility that appeals to digital strategy teams.
Combined market share of the top five platform vendors edges toward 45%, indicating room for consolidation, yet preserving space for specialized providers. Vendors with adjacent payment or wealth modules gain cross-sell advantage, while those anchored solely on core deposits risk margin compression amid cloud price wars.
Digital Banking Platform Industry Leaders
Backbase B.V.
Temenos Headquarters SA
Finastra Group Holdings Limited
Infosys Ltd. (Finacle)
Oracle Corporation
- *Disclaimer: Major Players sorted in no particular order

Recent Industry Developments
- February 2025: Temenos agreed to sell Multifonds to Montagu Private Equity for about USD 400 million, sharpening its focus on core banking.
- February 2025: Alkami Technology closed a USD 400 million acquisition of MANTL, expanding digital account-opening depth.
- January 2025: Temenos reported FY-24 EBIT and free cash flow above guidance, signaling sustained license demand.
- January 2025: FIS posted USD 10.1 billion in 2024 revenue; over 3 million accounts now run on its Modern Banking Platform.


Research Methodology Framework and Report Scope
Market Definitions and Key Coverage
Our study defines the digital banking platform market as all commercially deployed, end-to-end software suites that enable licensed banks and credit unions to digitize customer journeys across web and mobile channels, while orchestrating account onboarding, payments, lending, and ecosystem integrations through configurable, API-ready middleware.
Scope Exclusion: Stand-alone mobile wallets, branch-only core banking systems, and pure consulting services fall outside our measurement.
Segmentation Overview
- By Deployment
- Cloud
- On-Premises
- By Banking Type
- Retail Banking
- Corporate/SME Banking
- By Component
- Platform (Software)
- Services (Implementation and Support)
- By Service Model
- SaaS Subscription
- Licensed (Perpetual)
- Banking-as-a-Service (BaaS)
- By Access Mode
- Mobile Banking
- Online/Web Banking
- By Geography
- North America
- United States
- Canada
- Mexico
- South America
- Brazil
- Argentina
- Chile
- Rest of South America
- Europe
- Germany
- United Kingdom
- France
- Italy
- Spain
- Russia
- Rest of Europe
- Asia-Pacific
- China
- India
- Japan
- South Korea
- Singapore
- Malaysia
- Australia
- Rest of Asia-Pacific
- Middle East and Africa
- Middle East
- United Arab Emirates
- Saudi Arabia
- Turkey
- Rest of Middle East
- Africa
- South Africa
- Nigeria
- Rest of Africa
- Middle East
- North America
Detailed Research Methodology and Data Validation
Primary Research
Mordor analysts complemented desk work with interviews and short surveys covering digital chiefs at universal banks, SaaS vendors, regional regulators, and fintech consultants across North America, Europe, Asia-Pacific, and the GCC. These conversations clarified average selling prices, cloud migration cadence, and pipeline backlogs, helping us challenge early desk-based assumptions.
Desk Research
We began by mapping demand-side fundamentals from tier-1 public sources such as the World Bank Global Findex for account digitization rates, BIS Red Book for cashless transaction volumes, and the IMF Financial Access Survey for branch rationalization trends in 120 economies. Supply-side signals were compiled from central-bank API guidelines, FDIC and EBA technology spending disclosures, and patent filings on cloud-native core modules captured via Questel.
The desk phase also drew upon company 10-Ks, investor decks, and product brochures scraped through Dow Jones Factiva, plus trade-association briefs from the American Bankers Association and Payments Europe to spot pricing shifts. These sources together grounded the base year value and highlighted region-specific regulatory accelerants. The list is illustrative; many other documents informed data collection and cross-checks.
Market-Sizing & Forecasting
We anchor the baseline derived through a top-down rebuild of retail and corporate banking IT outlays, adjusted by verified platform penetration ratios and average annual license-plus-subscription fees. Select bottom-up roll-ups of vendor revenue disclosures and channel checks act as a reasonableness screen. Key variables, smartphone penetration, open-banking compliance counts, cloud-migration rates, digital payment volume, and per-bank IT spend, feed a multivariate regression that projects value over the forecast period. Where supplier data were missing, gaps were bridged using weighted regional averages validated in follow-up calls.
Data Validation & Update Cycle
Before sign-off, outputs pass a two-level analyst review, variance tests against independent signals (e.g. new SaaS bookings, national IT import data), and anomaly flags above ±8 percent. The model refreshes annually, with interim updates triggered by material M&A, regulatory mandates, or currency swings. A final sense-check is performed just prior to client delivery.
Why Our Digital Banking Platform Baseline Commands Reliability
Published estimates vary widely because firms choose different scope filters, currency conversions, and refresh cadences.
Key gap drivers include some studies that fold in pure mobile wallets or neo-bank proprietary stacks, others that apply aggressive cloud price deflation, and a few that extrapolate pre-COVID growth slopes without validating post-AI spending pauses. Mordor reports the market on a use-case basis only, revenue tied to modular, bank-grade platforms, and refreshes numbers every twelve months, which limits drift.
Benchmark comparison
| Market Size | Anonymized source | Primary gap driver |
|---|---|---|
| USD 13.79 B (2025) | Mordor Intelligence | - |
| USD 30.4 B (2023) | Global Consultancy A | Includes wallets and fintech-only deployments |
| USD 36.38 B (2024) | Industry Publisher B | Applies uniform 20% cloud discount to on-premise spend |
| USD 28.2 B (2022) | Trade Journal C | Uses 2021 FX rates and has not updated post-pandemic volumes |
Taken together, the comparison shows that when scope alignment, price normalization, and refresh cadence are controlled, Mordor's disciplined approach yields a balanced, transparent baseline that decision-makers can replicate and trust.


Key Questions Answered in the Report
What is the current size of the digital banking platform market?
The digital banking platform market is valued at USD 15.79 billion in 2026.
How fast is the digital banking platform market expected to grow?
It is forecast to rise at a 14.52% CAGR, reaching USD 31.08 billion by 2031.
Which deployment model holds the largest share in the digital banking platform market?
Cloud deployment commands 60.74% share and continues to expand swiftly.
Why is Banking-as-a-Service gaining traction?
BaaS grows at a 16.68% CAGR because non-bank brands can embed turnkey financial services without holding a charter.
Which region will be the fastest-growing for digital banking platforms?
Asia-Pacific leads with a 16.34% CAGR, driven by mobile-wallet adoption and inclusion policies.
What are the main challenges limiting adoption?
Rising AML compliance costs, hyperscaler lock-in risk, and scarcity of cloud-native talent are the foremost restraints.
Page last updated on:


