Digital Experience Platform Market Size and Share
Market Overview
| Study Period | 2020 - 2031 |
|---|---|
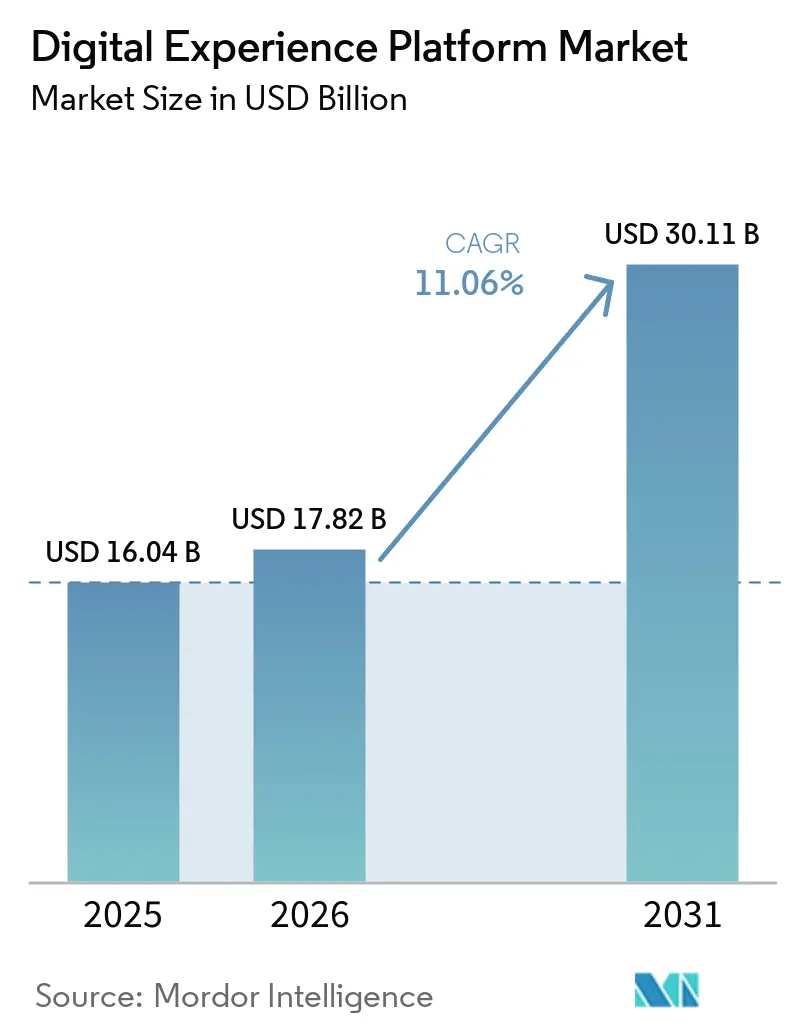
| Market Size (2026) | USD 17.82 Billion |
| Market Size (2031) | USD 30.11 Billion |
| Growth Rate (2026 - 2031) | 11.06% CAGR |
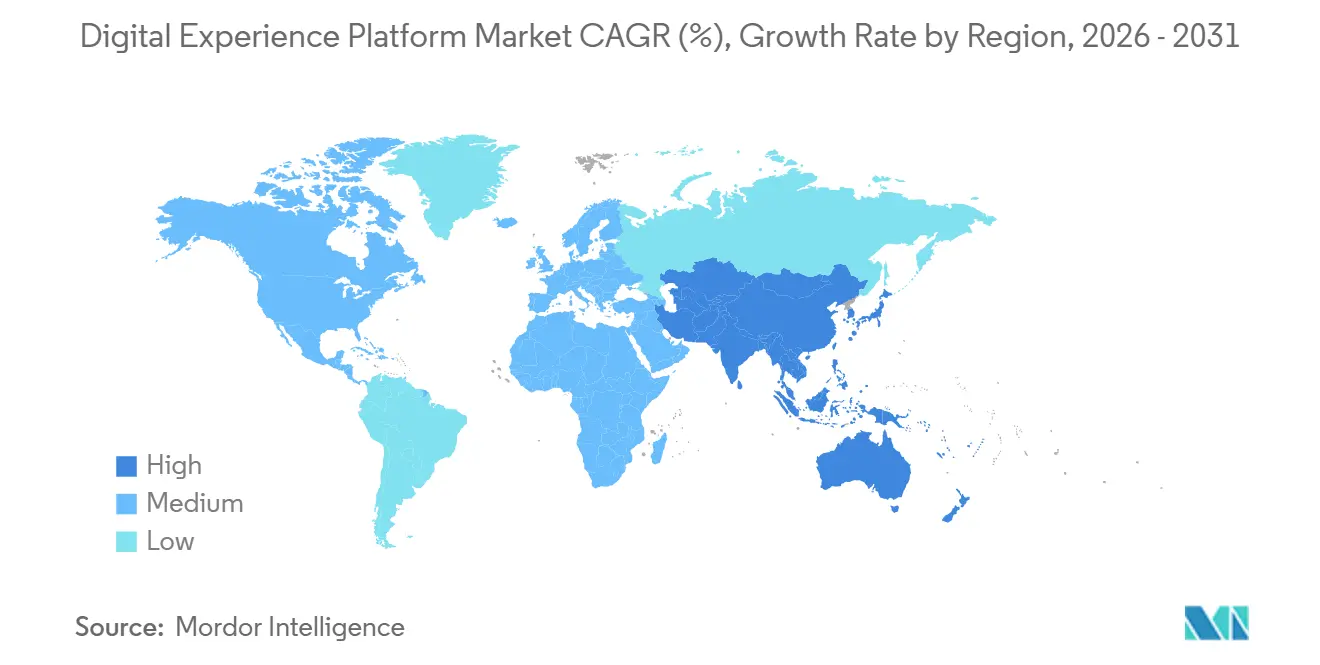
| Fastest Growing Market | Asia Pacific |
| Largest Market | North America |
| Market Concentration | Medium |
Major Players *Disclaimer: Major Players sorted in no particular order Image © Mordor Intelligence. Reuse requires attribution under CC BY 4.0. | |
Digital Experience Platform Market Analysis by Mordor Intelligence
The Digital Experience Platform market size reached USD 17.82 billion in 2026 and is projected to climb to USD 30.11 billion by 2031, advancing at an 11.06% CAGR during the forecast period. This growth reflects enterprises shifting from monolithic content systems to modular, API-first stacks that harmonize customer data, content, and personalization engines across web, mobile, and emerging touchpoints. Cloud-native deployment commanded 57.83% of 2025 revenue and is expanding at 13.11% as organizations retire legacy infrastructure and adopt consumption-based pricing. Services revenue is growing at 12.34%, the fastest component rate, because integration, customization, and managed operations remain essential for stitching together headless content management, customer data platforms, and analytics tools. Retail and e-commerce held 27.83% share in 2025 on the back of omnichannel mandates, while banking, financial services, and insurance (BFSI) is the fastest-growing vertical at 12.78% as open-banking rules drive API exposure and consumer-grade digital interfaces.
Key Report Takeaways
- By component, platforms accounted for 68.73% of 2025 revenue, and the services segment is forecast to grow at a 12.34% CAGR through 2031.
- By deployment mode, cloud captured 57.83% revenue in 2025, and is set to expand at a 13.11% CAGR through 2031.
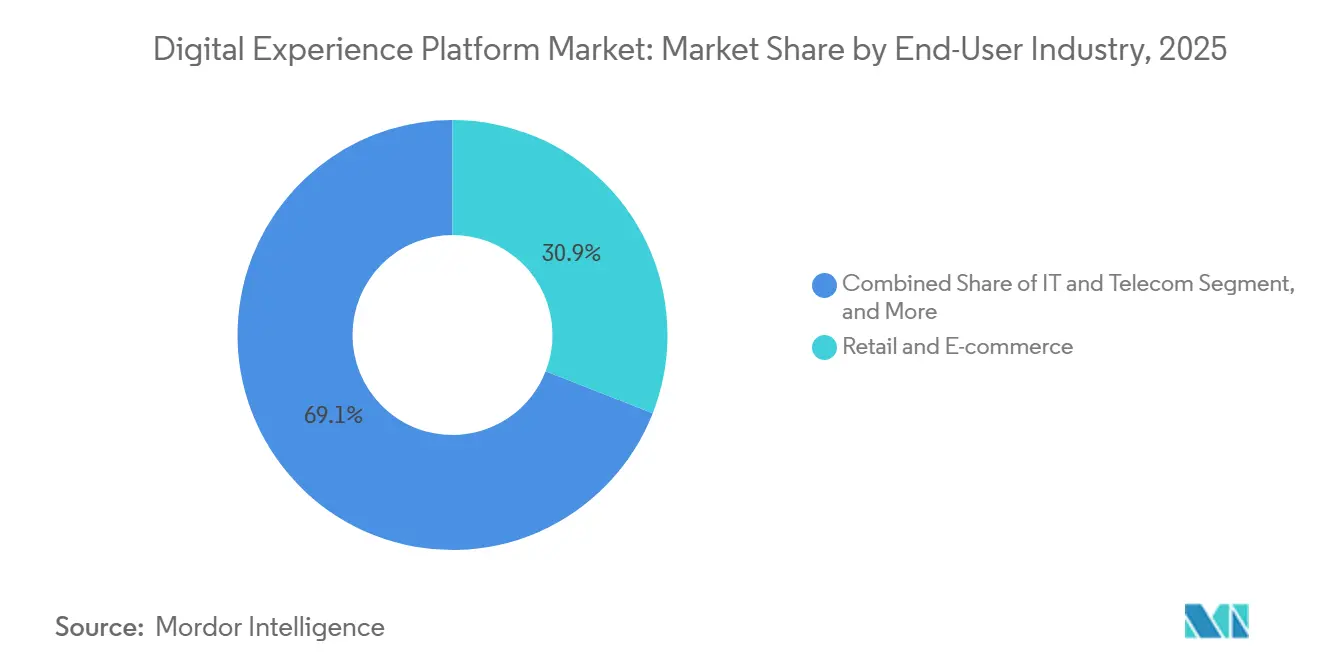
- By end-user industry, retail and e-commerce led with 27.83% revenue in 2025, whereas BFSI is projected to post the highest 12.78% CAGR through 2031.
- By organization size, large enterprises held 60.93% share in 2025, but small and medium enterprises are advancing at a 12.66% CAGR as vendors unbundle suites into low-entry modules.
- By geography, North America generated 38.73% of 2025 revenue, while Asia Pacific is on track for a 12.74% CAGR, the fastest regional pace.
Note: Market size and forecast figures in this report are generated using Mordor Intelligence’s proprietary estimation framework, updated with the latest available data and insights as of January 2026.
Global Digital Experience Platform Market Trends and Insights
Drivers Impact Analysis*
| Driver | (~) % Impact on CAGR Forecast | Geographic Relevance | Impact Timeline |
|---|---|---|---|
| Cloud-first enterprise IT strategies accelerate DXP adoption | +3.2% | Global, with concentrated uptake in North America and Europe | Medium term (2-4 years) |
| Rapid shift to omnichannel, AI-driven personalization | +2.8% | Global, led by retail-heavy markets in North America, Asia Pacific | Short term (≤ 2 years) |
| Gen-AI content operations cut time-to-market for campaigns | +2.1% | North America and Europe, expanding to Asia Pacific | Short term (≤ 2 years) |
| Mobile-commerce boom in emerging Asia drives mid-market demand | +1.9% | Asia Pacific core (India, Indonesia, Vietnam), spillover to Middle East | Medium term (2-4 years) |
| Democratization of composable and headless DXPs | +1.5% | Global, with early traction in North America and Western Europe | Long term (≥ 4 years) |
| EU Data Act and US Open Data initiatives mandate interoperability | +1.2% | Europe and North America, influencing global vendor roadmaps | Long term (≥ 4 years) |
| Source: Mordor Intelligence | |||
Cloud-First Enterprise IT Strategies Accelerate DXP Adoption
Organizations continue to replace on-premises licenses with software-as-a-service models that bundle compute, storage, and content-delivery bandwidth, trimming total cost of ownership by up to 40% over five years.[1]Oracle Corporation, “Oracle Experience Cloud Multi-Cloud Support,” Oracle.com Cloud platforms also enable continuous delivery, letting teams deploy code updates multiple times per day instead of waiting for maintenance windows. Microsoft Azure and Amazon Web Services offer one-click marketplaces that shorten proof-of-concept cycles from months to weeks.[2]Microsoft Corporation, “Azure Marketplace DXP Solutions,” Azure.microsoft.com Multi-cloud support further reduces vendor-lock-in fears and satisfies sovereignty requirements, spurring large enterprises to migrate mission-critical workloads.
Rapid Shift to Omnichannel, AI-Driven Personalization
Consumers now engage across six to eight touchpoints before purchase, creating demand for platforms that unify identity, behavior, and real-time context. Retail and e-commerce dominated 2025 revenue because merchants deploy recommendation engines that surface relevant items within milliseconds. Adobe integrated Firefly generative models to automate product copy in 29 languages, accelerating campaign iterations and boosting conversion potential.[3]Adobe Inc., “Adobe Firefly Services,” Adobe.com BFSI institutions leverage open-banking APIs to deliver balance aggregation and personalized loan offers, trimming acquisition costs and shortening conversion cycles.
Gen-AI Content Operations Cut Time-to-Market for Campaigns
Generative artificial intelligence compresses production timelines by handling copywriting, image synthesis, video editing, and localization. Adobe’s Agent Orchestrator lets marketers set objectives such as click-through rate, then deploy autonomous agents that iterate creative and adjust bids in real time. Salesforce’s Agentforce drafts service responses and triages tickets, shaving 30% from resolution times.[4]Salesforce Inc., “Agentforce: Autonomous AI Agents for Customer 360,” Salesforce.com These AI-native capabilities mitigate talent shortages while maintaining consistent brand guidelines, although enterprises must monitor intellectual-property risks and deploy output-filtering controls.
Mobile-Commerce Boom in Emerging Asia Drives Mid-Market Demand
Smartphone adoption surpassed majority rate in India, Indonesia, and Vietnam by 2025, and mobile purchases account for more than 80% of regional e-commerce. Unified Payments Interface (UPI) processed 13.4 billion transactions in December 2025 alone. Cloud-based DXPs priced per API call now allow mid-market retailers and fintech firms to launch direct-to-consumer channels without building extensive in-house stacks. Vendors such as Contentstack and Bloomreach added localized onboarding, regional currency terms, and integrations with logistics leaders Gojek and Grab, unlocking rapid rollouts across bandwidth-challenged geographies.
Restraints Impact Analysis*
| Restraint | (~) % Impact on CAGR Forecast | Geographic Relevance | Impact Timeline |
|---|---|---|---|
| Integration complexity with legacy stacks | -2.3% | Global, acute in North America and Europe with mature IT estates | Medium term (2-4 years) |
| Escalating data-privacy compliance costs | -1.8% | Europe (GDPR), North America (state-level laws), expanding to Asia Pacific | Long term (≥ 4 years) |
| Shortage of skilled MACH-architecture talent | -1.1% | Global, concentrated in developed markets | Medium term (2-4 years) |
| Proprietary schema lock-in raises migration risk | -0.9% | Global, affecting enterprises with multi-decade vendor relationships | Long term (≥ 4 years) |
| Source: Mordor Intelligence | |||
Integration Complexity with Legacy Stacks
Large enterprises run 15 to 20 marketing and commerce applications that rely on proprietary APIs and batch integrations. Re-platforming to composable DXPs requires mapping data schemas, reconciling duplicate records, and ensuring transaction consistency, often stretching projects to 18 months and absorbing 40% of budgets. Financial institutions face additional hurdles because mainframe cores cannot expose RESTful APIs without expensive modernization. Pre-built connectors cover standard use cases, but custom workflows and compliance rules still demand hand-coded middleware, fueling demand for specialized systems integrators.
Escalating Data-Privacy Compliance Costs
GDPR fines totaled EUR 1.3 billion (USD 1.39 billion) in 2024, highlighting the price of non-compliance. The EU Data Act now requires data portability, compelling vendors to expose export APIs even when it weakens customer lock-in. Meanwhile, 14 U.S. states enacted unique privacy laws from 2023-2025, forcing enterprises to deploy geo-fenced consent banners and jurisdiction-specific retention policies. Similar statutes in India and China require regional data centers and local certifications, inflating platform operating costs and stretching compliance teams.
*Our forecasts treat driver/restraint impacts as directional, not additive. The impact forecasts reflect baseline growth, mix effects, and variable interactions.
Segment Analysis
By Component: Services Surge as Integration Demands Escalate
The services segment accounted for 31.27% of 2025 revenue and is on track for a 12.34% CAGR, the quickest growth among component groups. This trajectory stems from enterprises allocating 40-50% of Digital Experience Platform market budgets to systems integration, managed operations, and strategic consulting. Platforms still generated 68.73% of sales in 2025 through recurring subscriptions, content-delivery capacity, and API-call metering. Yet the pivot toward composable stacks multiplies third-party touchpoints, escalating demand for integrators with cross-platform credentials. Global consultancies broadened their DXP practices by onboarding specialists in headless content management, customer data platforms, and marketing automation. Training engagements now teach marketing teams low-code development, API management, and experimentation methods, democratizing tasks once reserved for technical departments. Services also encompass ongoing optimization for generative-AI modules, as clients fine-tune prompts and guardrails to comply with brand and regulatory requirements.
While license revenue remains essential, a steady shift toward usage-driven billing models is poised to reshape earnings portfolios. Vendors now bundle white-glove onboarding, performance tuning, and continuous experimentation as premium tiers, cultivating high-margin annuity streams. At the same time, managed-service offerings address talent shortages by providing 24/7 site reliability and optimization, enabling customers to focus on content and commerce strategy rather than infrastructure maintenance. This dynamic positions services as the primary lever for sustained wallet share in the market.


By Deployment Mode: Cloud Dominates as Hybrid Models Gain Traction
The cloud segment secured 57.83% revenue in 2025 and is expanding at 13.11% annually, well ahead of on-premises deployments. Elastic scalability, consumption-based pricing, and automated security patching appeal to organizations seeking predictable costs and rapid experimentation. Even security-sensitive industries now pilot hybrid frameworks that keep sensitive data on-premises while offloading content delivery and analytics to public clouds, balancing compliance with agility. Oracle’s multi-cloud support illustrates growing demand for workload portability, letting enterprises negotiate favorable terms across providers while meeting sovereignty rules.
Continuous integration pipelines, enabled by container orchestration and infrastructure-as-code, enable multiple code pushes daily, supporting real-time inventory synchronization and AI personalizers. However, reliance on third-party uptime exposes the service to service-level breaches. Enterprises mitigate risks through multi-region failovers, API rate-limit monitoring, and contractual penalties for downtime. As tooling matures, hybrid models should capture incremental share, but public cloud is set to remain the growth engine for the market.
By End-User Industry: BFSI Leads Growth as Open Banking Reshapes Engagement
Retail and e-commerce maintained the largest 2025 slice at 27.83% after unifying web, store, and social-commerce channels under omnichannel platforms that synchronize inventory and pricing in real time. The Digital Experience Platform market share for BFSI is slated to climb fastest, driven by a 12.78% CAGR, as open-banking mandates force banks to expose APIs and deploy consumer-grade portals. Financial firms leverage account-aggregation views, spending insights, and automated loan offers to elevate engagement. Telecommunications operators implement self-service portals and plan recommendation engines to reduce call center volumes, while healthcare providers adopt HIPAA-compliant patient portals and telehealth integrations.
Manufacturers use DXPs to power field-service apps and configure-to-order experiences, integrating with enterprise resource planning and product lifecycle systems. Education, government, media, and hospitality segments round out demand, each with compliance-driven feature requirements. Cross-industry convergence is evident as vertical templates accelerate deployment, yet domain-specific regulations ensure tailored roadmaps remain essential.

By Organization Size: SMEs Embrace Cloud to Bypass IT Constraints
Large enterprises controlled 60.93% of 2025 revenue owing to extensive digital estates that demand advanced governance, yet small and medium enterprises are the fastest-growing cohort at a 12.66% CAGR. Pay-as-you-go pricing lowers capital barriers, while drag-and-drop builders and pre-bundled integrations neutralize skills gaps. Vendors introduced starter packages under USD 1,000 per month that scale automatically with traffic and user counts. This flexibility narrows capability gaps between resource-rich incumbents and agile newcomers, fostering competitive parity.
SMEs also benefit from the democratization of headless architectures, as RESTful APIs connect easily with popular JavaScript front-ends, removing the need for proprietary templating mastery. Embedded machine-learning features for churn prediction and product recommendations further raise the functional baseline. Collectively, these trends anchor SMEs as a strategic battleground for future market expansion.
Geography Analysis
North America generated 38.73% of 2025 revenue, anchored by Fortune 500 spend on enterprise-grade governance, SOC 2 Type II and ISO 27001 certifications, and multi-tenant architectures. United States privacy legislation, fragmented across 14 states, compels geo-fenced consent and retention policies, lifting entry barriers for smaller vendors but opening advisory revenue for compliance specialists. Canadian enterprises prioritize bilingual French-English content delivery, while Mexican retailers invest in cross-border e-commerce frameworks linking inventory, taxation, and logistics across United States–Mexico–Canada trade corridors.
Asia Pacific is forecast to post the highest 12.74% CAGR. India’s mobile-commerce sector hit USD 150 billion in 2025, fueled by the Unified Payments Interface’s 13.4 billion December 2025 transactions. Smartphone-first behavior in Indonesia, Vietnam, and the Philippines drives demand for vernacular content, local payment gateways, and low-latency delivery. China centers adoption on super-app ecosystems that require mini-program APIs and Personal Information Protection Law compliance. Japan and South Korea migrate legacy systems to cloud to support double-byte character sets, while Singapore, Malaysia, and Thailand leverage cross-border e-commerce frameworks to simplify customs and payment interoperability.
Europe commands significant share, underpinned by GDPR and the Data Act, which mandate interoperability and explicit consent, favoring open-source, API-centric platforms. Germany, the United Kingdom, and France continue heavy investment in omnichannel experiences across automotive, luxury, and finance sectors. The Interoperable Europe Act obliges public agencies to adopt standardized APIs, expanding procurement opportunities for compliant vendors. Southern European nations accelerate modernization using European Union recovery funds, while the Nordic region advances fully serverless deployments. South America, the Middle East, and Africa remain emerging markets; Brazil leads Latin America through retail and fintech investments, Saudi Arabia and the United Arab Emirates prioritize smart-city initiatives, and South Africa acts as the sub-Saharan technology hub despite infrastructure challenges.

Competitive Landscape
The Digital Experience Platform market is moderately concentrated. The top five suppliers, Adobe, Salesforce, SAP, Oracle, and Microsoft, held most of 2025 revenue, leaving meaningful share for more than 30 specialists. Incumbents cross-sell experience modules into existing customer relationship management and enterprise resource planning bases, bundling multi-year contracts and embedding AI features that heighten switching costs. Adobe’s Agent Orchestrator integrates autonomous agents across Creative, Experience, and Document Clouds, demonstrating the power of internal ecosystem leverage.
Hyperscale cloud providers, including Amazon Web Services, Microsoft Azure, and Google Cloud, are embedding DXP capabilities directly into infrastructure services, compressing standalone vendor margins. In response, independent players differentiate through vertical accelerators, domain-specific compliance certifications, and open-source cores that minimize lock-in. Contentstack, Bloomreach, and Contentful pursue mid-market organizations with low entry pricing, marketplace connectors, and community-driven extension libraries.
The technology arms race revolves around generative-AI integration for content creation, decisioning, and conversational interfaces. Patent filings in AI-driven personalization, federated identity, and real-time decisioning increased markedly in 2024-2025. Vendors invest heavily in training data, model fine-tuning, and explainability to satisfy governance teams across regulated industries. White-space opportunities persist for specialists offering domain-trained models and compliance dashboards tailored to healthcare, finance, and public sector.
Digital Experience Platform Industry Leaders
Adobe Inc.
Oracle Corporation
SAP SE
IBM Corporation
Progress Software Corporation
- *Disclaimer: Major Players sorted in no particular order


Recent Industry Developments
- May 2025: Press Ganey Forsta acquired InMoment to expand its Human Experience Platform across 43,000 clients.
- May 2025: Capillary Technologies bought Kognitiv, its fourth loyalty acquisition since 2021, to scale AI-powered personalisation in North America.
- May 2025: IgniteTech acquired Khoros, adding omni-channel engagement tools for 2,000 enterprises to its portfolio.
- March 2025: Adobe introduced Customer Experience Orchestration and the Experience Platform Agent Orchestrator featuring ten AI agents.


Research Methodology Framework and Report Scope
Market Definitions and Key Coverage
Our study defines the Digital Experience Platform (DXP) market as the global spend on integrated software suites that let enterprises build, manage, and optimize personalized interactions across websites, mobile apps, social channels, kiosks, and emerging conversational interfaces. A DXP typically bundles content and customer-data management layers with analytics, AI-driven personalization, workflow, and API connectors that unify previously siloed touchpoints.
Scope exclusion: custom, one-off in-house frameworks and plain Web Content Management tools that lack orchestration or data unification capabilities are not counted.
Segmentation Overview
- By Component
- Platform
- Services
- By Deployment Mode
- On-Premises
- Cloud
- By End-User Industry
- Retail and E-commerce
- IT and Telecom
- Banking, Financial Services and Insurance (BFSI)
- Healthcare
- Manufacturing
- Other End-User Industries
- By Organization Size
- Large Enterprises
- Small and Medium Enterprises
- By Geography
- North America
- United States
- Canada
- Mexico
- South America
- Brazil
- Argentina
- Rest of South America
- Europe
- Germany
- United Kingdom
- France
- Italy
- Spain
- Rest of Europe
- Asia-Pacific
- China
- Japan
- India
- South Korea
- ASEAN
- Rest of Asia-Pacific
- Middle East and Africa
- Middle East
- Saudi Arabia
- United Arab Emirates
- Rest of Middle East
- Africa
- South Africa
- Nigeria
- Rest of Africa
- Middle East
- North America
Detailed Research Methodology and Data Validation
Primary Research
Analysts then conduct interviews and short surveys with software product managers, solution integrators, and IT budget owners across North America, Europe, and Asia-Pacific. Their insights test price bands, refresh rates, and the mix between platform licenses and recurring managed services, allowing our team to tighten assumptions derived from secondary data.
Desk Research
We start with structured desk work that collects spend and adoption signals from trustworthy public datasets such as the US Census Bureau's quarterly e-commerce series, Eurostat ICT enterprise surveys, International Telecommunication Union connectivity statistics, GSMA Mobile Economy reports, and World Customs Organization shipment codes tracking packaged software flows. To size vendor revenue pools, Mordor analysts access D&B Hoovers company filings and mine Dow Jones Factiva for disclosed contract values and pricing moves. Patent searches on Questel help us gauge innovation velocity around composable DXPs and headless architectures, while trade association white papers (for example, the Content Marketing Institute) clarify use-case penetration by industry.
These inputs form the archival layer; numerous other open and paid sources are referenced during validation, and the list above is illustrative rather than exhaustive.
Market-Sizing & Forecasting
A top-down model converts enterprise software outlays, digital-commerce volumes, and channel traffic statistics into an addressable demand pool, which is then reconciled with sampled bottom-up checks such as vendor revenue roll-ups and regional partner billings. Key variables, including cloud migration rate, number of active commercial websites, CX budget share of total IT spend, average platform ASP, and subscription churn, drive year-by-year calculations. A multivariate regression links these drivers to historic revenue, generating the baseline and feeding an ARIMA scenario layer that projects through the forecast period. Where supplier roll-ups under-report mid-market activity, adjustment factors drawn from partner surveys bridge the gap.
Data Validation & Update Cycle
Outputs pass triple reviews: automated variance flags, peer analyst scrutiny, and a senior sign-off. We refresh models annually, and extraordinary events, such as major M&A, price resets, or regulatory shifts, trigger interim updates. Just before release, an analyst reruns the latest data so clients receive the freshest view.
Why Mordor's Digital Experience Platform Baseline commands confidence
Published estimates often diverge because firms vary the stack they include, the geographies they survey, and the cadence at which they refresh numbers.
Key gap drivers in this market are: some publishers limit coverage to license revenue and omit managed services; others exclude emerging composable micro-services; several rely on straight-line trend extensions that ignore shifts in cloud pricing and AI-led upselling, while Mordor's team revisits every driver annually and tests it with frontline experts.
Benchmark comparison
| Market Size | Anonymized source | Primary gap driver |
|---|---|---|
| USD 16.05 B (2025) | Mordor Intelligence | - |
| USD 5.01 B (2025) | Regional Consultancy A | Narrow stack, minimal Asia-Pacific sampling, limited primary checks |
| USD 13.50 B (2024) | Global Consultancy B | Counts licenses only, excludes services; single-factor forecast |
These comparisons show that Mordor's disciplined variable selection, annual refresh cycle, and blended top-down/bottom-up approach deliver a transparent, balanced baseline that decision-makers can reliably trace and replicate.


Key Questions Answered in the Report
How fast is the Digital Experience Platform market growing through 2031?
The market is projected to expand at an 11.06% CAGR from 2026 to 2031.
Which deployment mode is advancing the quickest?
Cloud deployments are growing at a 13.11% CAGR, outstripping on-premises and hybrid alternatives.
Why are services revenue rising faster than platform licenses?
Integration complexity, generative-AI customization, and managed operations push services to a 12.34% CAGR, the fastest component growth rate.
Which vertical will contribute the highest incremental growth?
BFSI is forecast to deliver the strongest momentum with a 12.78% CAGR, fueled by open-banking regulations and digital-only engagement models.
What drives Asia Pacific’s rapid adoption?
Mobile-first commerce, vernacular content demand, and low-entry cloud pricing underpin a 12.74% CAGR, the fastest among all regions.
Page last updated on:


