Diet And Nutrition Apps Market Size and Share
Market Overview
| Study Period | 2019 - 2030 |
|---|---|
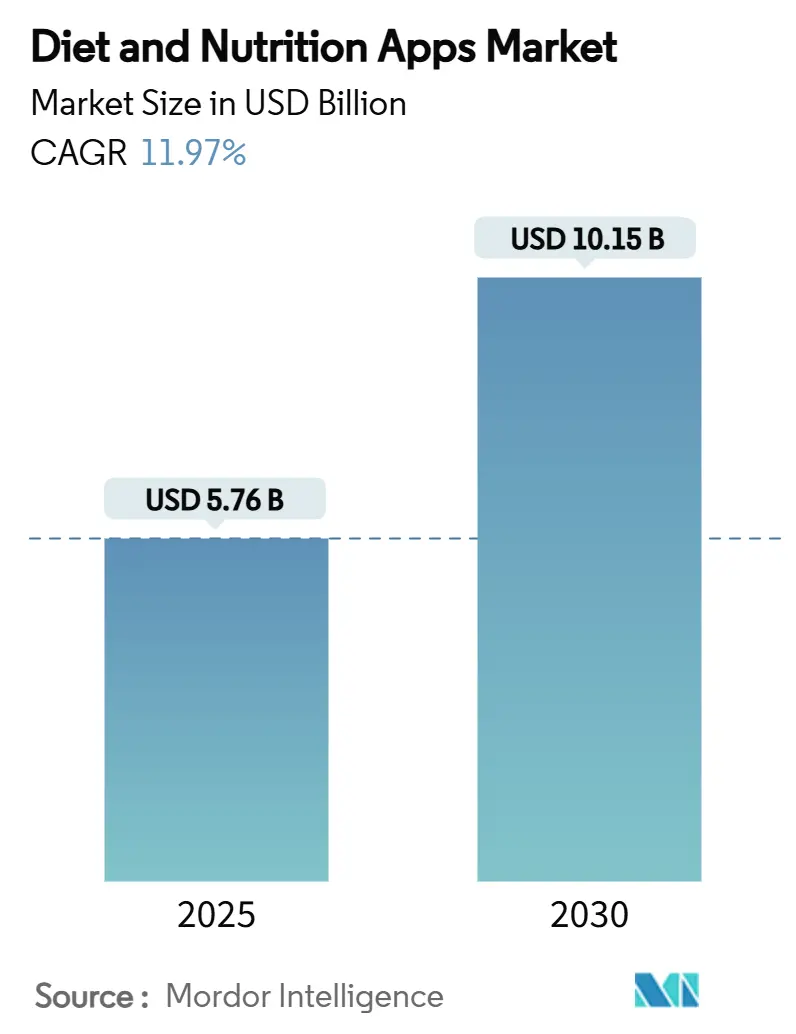
| Market Size (2025) | USD 5.76 Billion |
| Market Size (2030) | USD 10.15 Billion |
| Growth Rate (2025 - 2030) | 11.97% CAGR |
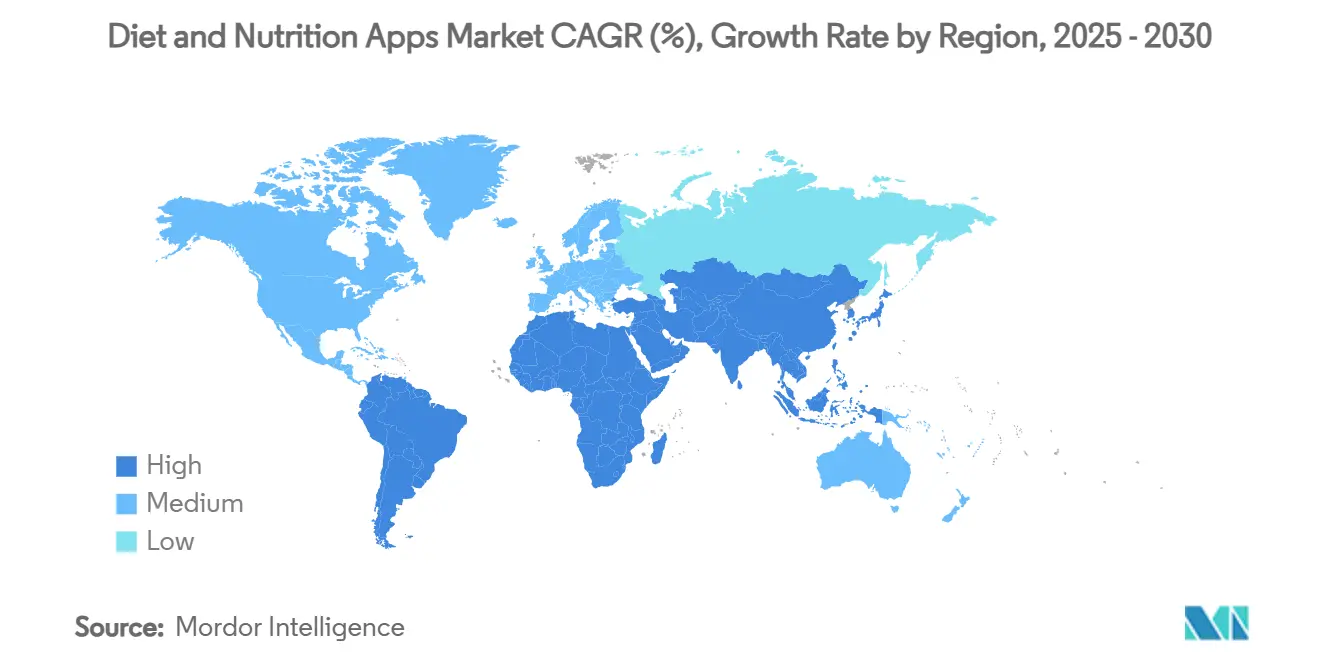
| Fastest Growing Market | Asia Pacific |
| Largest Market | North America |
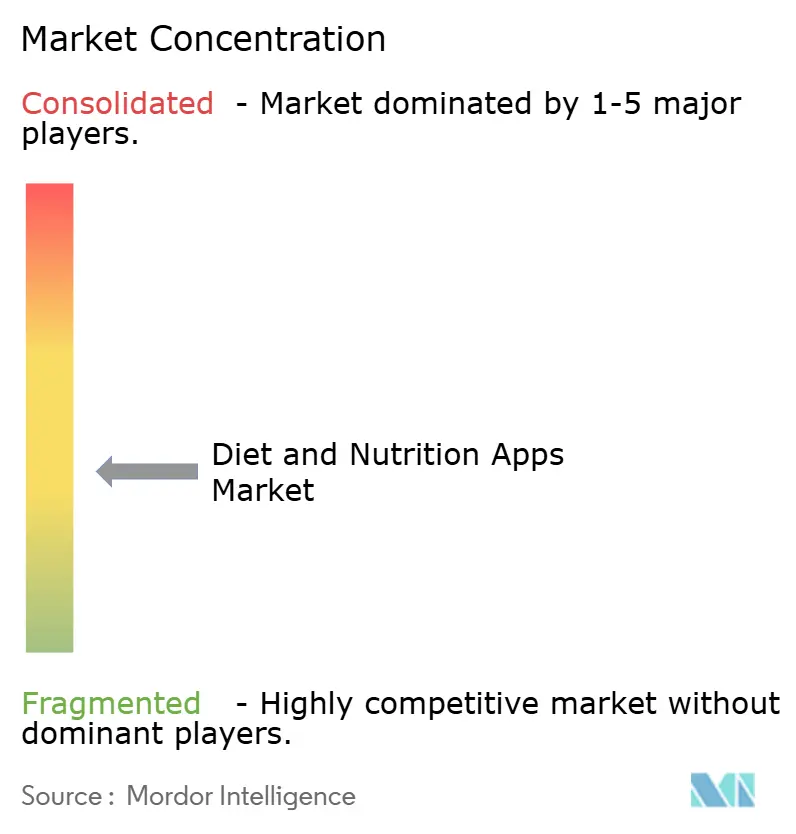
| Market Concentration | Medium |
Major Players *Disclaimer: Major Players sorted in no particular order Image © Mordor Intelligence. Reuse requires attribution under CC BY 4.0. | |
Diet And Nutrition Apps Market Analysis by Mordor Intelligence
The diet and nutrition apps market size reached USD 5.76 billion in 2025 and is forecast to attain USD 10.15 billion by 2030, advancing at an 11.97% CAGR. Expanding medical reimbursement for digital therapeutics, rapid improvements in AI-based food recognition, and growing corporate wellness budgets are steering growth in the diet and nutrition apps market. Wearable ecosystems that combine continuous glucose monitoring, smart scales, and activity trackers are raising user engagement by linking physiological data with dietary guidance. Enterprise adoption is accelerating as employers deploy subscription bundles to curb healthcare costs, while AI-driven portion-sizing technology is reducing logging friction and improving calorie-tracking accuracy. The fastest-growing end-user group comprises chronic-disease patients who now rely on clinically validated apps that qualify for payer reimbursement in regulated markets.[1]Mahana Therapeutics, “Mahana Secures Permanent Reimbursement in Germany for its Cara Care for Irritable Bowel Syndrome Digital Therapeutic,” mahana.com Competitive intensity is rising as leading platforms add medication programs, AI meal planning, and multi-modal sensor integration to increase revenue per user.
Key Report Takeaways
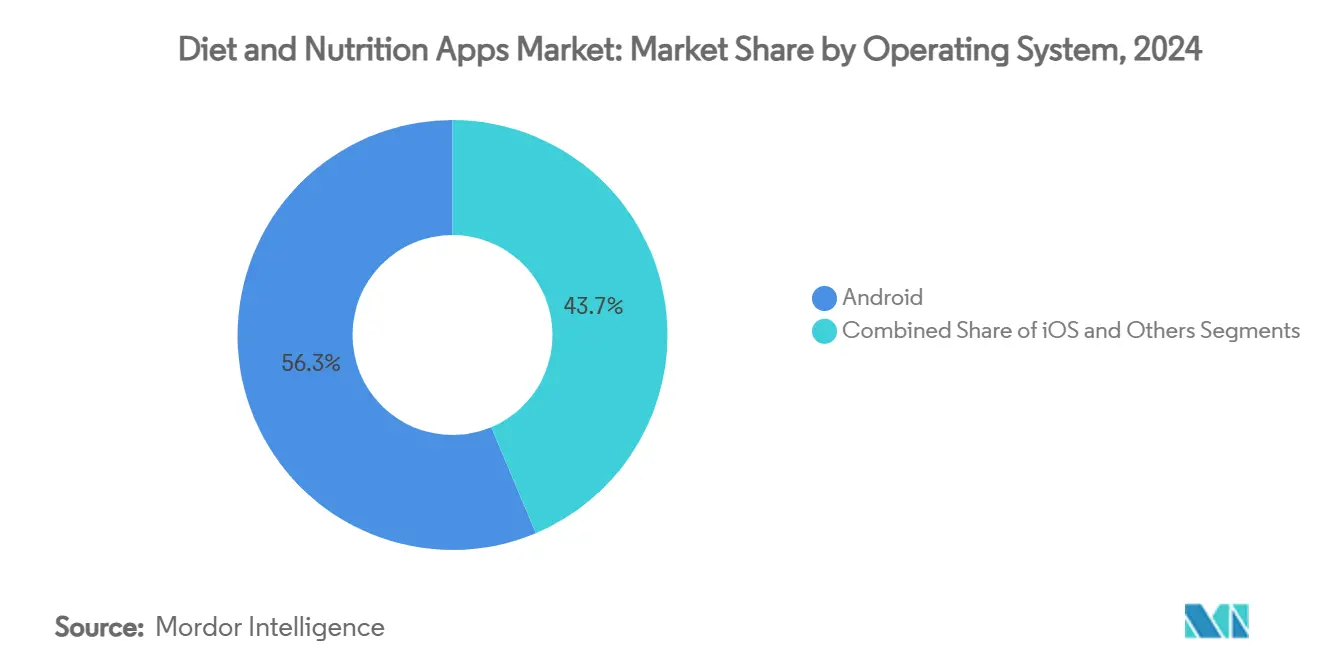
- By operating system, Android commanded 56.34% of the diet and nutrition apps market share in 2024, while others use is projected to climb at a 14.23% CAGR to 2030.
- By revenue model, subscriptions generated 44.89% of the diet and nutrition apps market size in 2024; enterprise B2B licensing is poised to rise at a 15.37% CAGR through 2030.
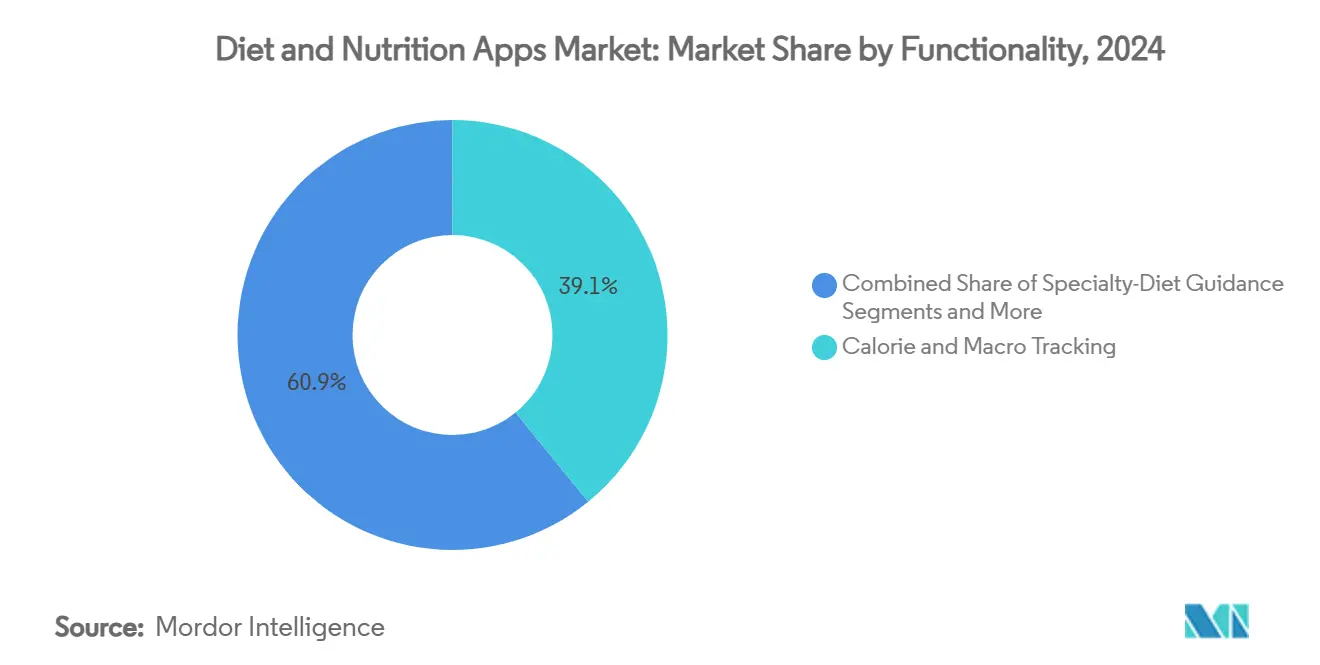
- By functionality, calorie and macro tracking held 39.13% of the diet and nutrition apps market size in 2024, whereas AI-driven portion-sizing is forecast to expand at a 13.89% CAGR to 2030.
- By end-user, chronic-disease patients segment is advancing at a 14.44% CAGR through 2030, outpacing the general population segment’s growth rate.
- North America captured 32.78% revenue share in 2024; Asia-Pacific is set to record the quickest regional CAGR at 14.03% through 2030.
Global Diet And Nutrition Apps Market Trends and Insights
Drivers Impact Analysis*
| Driver | (~) % Impact on CAGR Forecast | Geographic Relevance | Impact Timeline |
|---|---|---|---|
| Rising Health-Conscious Consumer Base | +2.1% | Global, with highest concentration in North America & Europe | Medium term (2-4 years) |
| Integration With Wearables & IoT Ecosystems | +1.8% | North America & APAC core, spill-over to Europe | Short term (≤ 2 years) |
| Growing Chronic-Disease Burden Demanding Diet Monitoring | +2.3% | Global, particularly North America & Europe aging populations | Long term (≥ 4 years) |
| AI-Powered Portion-Sizing Accuracy Gains | +1.6% | APAC core with technology leadership, expanding globally | Medium term (2-4 years) |
| Employer-Sponsored Wellness Benefits Covering App Subscriptions | +1.4% | North America & Europe corporate markets | Short term (≤ 2 years) |
| Digital-Therapeutics Reimbursement Pathways Opening | +1.9% | Europe leading, North America following, APAC emerging | Long term (≥ 4 years) |
| Source: Mordor Intelligence | |||
Rising Health-Conscious Consumer Base
Peer-reviewed trials show 52% of smartphone nutrition applications succeed in fostering healthier eating, especially among people managing chronic conditions.[1]Seid A. et al., “Internet-based smartphone apps improved healthy eating behaviors,” frontiersin.org More mainstream consumers are now adopting dietary tracking to prevent lifestyle illnesses, a trend reinforced by the FDA’s qualified health claim linking yogurt intake to reduced type 2 diabetes risk.[2]Lordan R., “FDA announces qualified health claim for yogurt intake,” dsx.journals.elsevier.com Employers are capitalizing on this momentum to cut absenteeism, while seniors over 65—a fast-growing online cohort—seek apps that manage nutrient-drug interactions and age-related needs.
Integration with Wearables & IoT Ecosystems
Partnerships such as Cronometer’s linkup with WHOOP allow users to correlate sleep stages, recovery scores, and skin temperature with micronutrient intake, tripling engagement compared with standalone logging. Glucose monitors, smart rings, and next-generation biosensors feed real-time biomarkers into meal-planning algorithms, while photoplethysmography-derived metabolic estimates inform adaptive calorie budgets. Suppliers that master API-level integration strengthen network effects, increasing customer lifetime value.
Growing Chronic-Disease Burden Demanding Diet Monitoring
Permanent German reimbursement for Cara Care underscores how validated nutrition therapeutics can secure payer funding. The FDA’s extended comment period on software detecting prediabetes signals a policy push that favors evidence-backed apps. Digital twin models now simulate individual glycemic responses, enabling hyper-personalized diet protocols that support remission pathways for type 2 diabetes.[3]Kumar R., “Personalized Nutrition via Digital Twin,” pmc.ncbi.nlm.nih.gov Hospital groups and pharmacies are trialing dedicated “digital aisles” that position prescription-grade apps next to traditional therapies.
AI-Powered Portion-Sizing Accuracy Gains
Deep-learning vision pipelines have cut average portion-estimation errors to 17.06%. NYU’s food-scanner prototype achieved a 0.7941 mean average precision score across mixed menus. Regional datasets—21,000 images covering 239 Central Asian dishes—have narrowed algorithmic bias and boosted inclusivity. Photogrammetry combined with smartphone LiDAR now renders 3-D volumetric profiles, pushing apps toward clinical-grade accuracy for calorie counting.
Restraints Impact Analysis*
| Restraint | (~) % Impact on CAGR Forecast | Geographic Relevance | Impact Timeline |
|---|---|---|---|
| Data-Privacy & Cybersecurity Concerns | -1.7% | Global, particularly Europe with GDPR, North America with CCPA | Short term (≤ 2 years) |
| High User Churn / Low Long-Term Engagement | -2.2% | Global, with highest impact in competitive markets | Medium term (2-4 years) |
| Tightening App-Store Tracking-Permission Policies | -1.3% | Global, iOS and Android ecosystem dependent | Short term (≤ 2 years) |
| Algorithmic Bias For Ethnically-Diverse Cuisines | -1.1% | APAC and emerging markets with diverse food cultures | Medium term (2-4 years) |
| Source: Mordor Intelligence | |||
Data-Privacy & Cybersecurity Concerns
GDPR audits of European diabetes apps spotlight uneven compliance, eroding user trust when data flows across borders without explicit consent. Privacy anxieties also surface in AI diet planning reviews, where opaque models raise questions about data storage and secondary sharing. Companies are adopting zero-knowledge encryption and localized processing to reassure customers while aligning with forthcoming U.S. national data-privacy legislation.
High User Churn / Low Long-Term Engagement
Systematic reviews reveal retention remains uneven, especially among healthy adults who perceive limited novelty after initial habit-formation stages. A 65-million-user data mining project by Lifesum emphasizes the importance of theory-driven nudges to prolong engagement, yet translating those findings into scalable design remains challenging. Links between calorie-counting apps and disordered-eating symptoms in vulnerable populations necessitate guardrails and clinical oversight.
*Our forecasts treat driver/restraint impacts as directional, not additive. The impact forecasts reflect baseline growth, mix effects, and variable interactions.
Segment Analysis
By Operating System: Android’s Scale Meets HarmonyOS Momentum
Android held 56.34% of the diet and nutrition apps market in 2024, thanks to its ubiquity across budget smartphones. The others segment is expected to notch a 14.23% CAGR to 2030 as Huawei’s ecosystem broadens in Asia and Eastern Europe. iOS retains a lucrative premium cohort that drives higher average revenue per user. Development teams increasingly embrace cross-platform frameworks so that feature parity remains consistent, mitigating OS fragmentation risks.
Global security debates also influence platform choices: jurisdictions wary of U.S. or Chinese operating systems promote forked Android builds or PWAs hosted on neutral servers. These shifts invite nimble entrants that leverage web-first architectures for rapid updates and reduced maintenance overhead. As 5G roll-outs mature, real-time video food logging becomes viable even on mid-range devices, enhancing Android’s value proposition among calorie-tracking novices.


By Revenue Model: Enterprises Race Ahead of Consumers
Subscriptions delivered 44.89% of total revenue in 2024, anchoring the diet and nutrition apps market. Yet enterprise B2B licensing is expanding at a 15.37% CAGR, buoyed by insurers and employers willing to pay per-member-per-month fees in exchange for verifiable health outcomes. Freemium models remain a popular funnel in emerging economies; however, privacy shifts curtail ad-tracking, nudging providers toward tiered paywalls. One-time purchases fade as consumers expect continuous feature delivery.
MyFitnessPal’s Premium+ tier, priced at USD 100 annually, underscores willingness to pay for AI meal plans that automate grocery lists and minimize cognitive load. Corporate wellness managers favor dashboard analytics and single sign-on, creating switching costs that enhance retention. ROI calculations increasingly highlight reduced metabolic syndrome claims, securing renewal budgets even in cost-conscious sectors.
By Functionality: Portion-Sizing Algorithms Redefine Logging
Calorie and macro logging still account for 39.13% of the diet and nutrition apps market size. However, image-based portion-sizing tools are outpacing legacy inputs at a 13.89% CAGR, propelled by depth-sensing hardware in flagship phones. Meal-planning engines now blend large-language-model recipe generation with allergen tagging, enhancing inclusivity for FODMAP, vegan, and halal requirements. Virtual dietitian chatbots supply behavioral-change counseling, nudging users toward evidence-based goals.
Accuracy benchmarks continue to climb: multi-modal systems integrating voice commands and ingredient recognition streamline kitchen workflows. The next frontier is predictive nutrition, where biomarker-linked algorithms adjust meal suggestions to maintain glycemic stability or optimize muscle-protein synthesis. Providers positioned at this intersection stand to capture physician referrals once clinical validation solidifies.
By End-User: Medical Uptake Outpaces Lifestyle Segments
The general population represented 36.78% revenue in 2024, nevertheless chronic-disease patients category is climbing at 14.44% CAGR as regulatory bodies endorse app-based therapy. Obesity, type 2 diabetes, and irritable bowel syndrome dominate indications, aided by programs that pair GLP-1 medications with behavioral coaching at USD 149 per month. Athletes embrace performance nutrition modules that sync with lactate sensors and recovery scores, paying premium for data-rich insights.
Maternal and pediatric sub-segments, though smaller, are seeing rapid uptake of gestational-diabetes monitoring and early-feeding guidance. Seniors form another high-potential niche as smartphone penetration among 65-plus Americans reaches 70%; features like medication-nutrition interaction alerts and large-font UX improve adoption. The diet and nutrition apps market thus widens its medical footprint, blurring lines between lifestyle aid and regulated device.
Geography Analysis
North America commanded a 32.78% revenue slice in 2024 and sustains leadership through mature reimbursement pathways and high willingness to pay. The FDA’s Digital Health Advisory Committee offers clear guidance, encouraging incumbents to bundle prescription drugs with app-based coaching, as seen in WW International’s Wegovy program priced at USD 299. Venture funding continues to flow, exemplified by Alma’s February 2025 launch backed by Menlo Ventures, signaling appetite for AI-first nutrition companions.
Asia-Pacific is set to record a 14.03% CAGR to 2030—the fastest worldwide—thanks to rising middle-class health awareness and local innovators such as HealthifyMe securing USD 45 million to scale personalized AI coaching beyond India. Chinese, Japanese, and Korean regulators are drafting streamlined pathways for digital therapeutics, shortening time-to-market for portion-sizing and glucose-monitoring hybrids. Local datasets that capture regional cuisines, from Thai stir-fries to bento assortments, reduce algorithmic bias and enhance user satisfaction.
Europe exhibits robust yet measured expansion. Germany’s statutory reimbursement for Cara Care cemented its status as a continental lighthouse case. Stringent GDPR norms mandate data-minimization architectures, which in turn strengthen consumer trust and retention. The United Kingdom and France invest in NHS-linked app libraries, stipulating clinical-effectiveness evidence for listing. Southern Europe’s smartphone adoption surge among seniors opens a new demographic front for Mediterranean-diet-aligned trackers.
Middle East & Africa plus South America together remain emerging contributors. GCC governments subsidize wellness apps under national diabetes-reduction drives, while Brazil’s urban millennials propel freemium downloads. Currency volatility and patchy broadband infrastructure temper growth yet leave ample white-space for localized content and carrier billing partnerships that bypass credit-card penetration hurdles.

Competitive Landscape
The diet and nutrition apps market remains moderately fragmented, though M&A velocity is picking up as platforms hunt AI talent and differentiated datasets. MyFitnessPal’s Intent acquisition delivered proprietary meal-planning algorithms that underpin its Premium+ tier. Noom diversified into pharmaceutical adjuncts, pairing GLP-1 delivery with in-app coaching under a forthcoming FDA PDURS model.
White-space opportunities revolve around culturally specific databases that lift recognition accuracy for mixed or regional dishes, an area underserviced by global leaders. Start-ups trained on Central Asian or Middle Eastern meal patterns can achieve defensible moats via local partnerships with grocers and telecoms. Intellectual-property filings covering 3-D volumetric estimation and biomarker-linked recommendation engines surge, indicating that the next contest will hinge on sensor fusion rather than pure software.
Enterprise channels elevate switching costs through integration with HR dashboards and insurance claims systems. Meanwhile, consumer-facing challengers differentiate on community features and game-like reward loops. Regulatory scrutiny—epitomized by the FDA committee—raises compliance thresholds, advantaging incumbents with legal resources. Still, agile newcomers can exploit niche medical indications to gain footholds before expanding horizontally.
Diet And Nutrition Apps Industry Leaders
MyFitnessPal
Noom Inc.
WW International
Lose It! (FitNow)
Lifesum AB
- *Disclaimer: Major Players sorted in no particular order

Recent Industry Developments
- February 2025: Alma, a smart nutrition companion app backed by Menlo Ventures and Harvard T.H. Chan School of Public Health data, debuts with hyper-personalized insights.
- February 2025: MyFitnessPal acquires Intent, rolling out Premium+ subscriptions at USD 100 annually with AI-generated meal plans.
- October 2024: HealthifyMe raises USD 45 million to fuel U.S. expansion and refine culturally tuned AI coaching.


Global Diet And Nutrition Apps Market Report Scope
| iOS |
| Android |
| Others (HarmonyOS, KaiOS, web PWA) |
| Freemium with in-app ads |
| Subscription (monthly / annual) |
| One-time purchase |
| Enterprise/B2B licensing |
| Calorie & macro tracking |
| Meal-planning & recipe discovery |
| Diet coaching & virtual RD support |
| Specialty-diet guidance (keto, vegan, FODMAP, etc.) |
| General population |
| Athletes & fitness enthusiasts |
| Chronic-disease patients (diabetes, CVD, obesity) |
| Maternal & pediatric users |
| Seniors (65+) |
| North America | United States |
| Canada | |
| Mexico | |
| Europe | Germany |
| United Kingdom | |
| France | |
| Italy | |
| Spain | |
| Rest of Europe | |
| Asia-Pacific | China |
| Japan | |
| India | |
| Australia | |
| South Korea | |
| Rest of Asia-Pacific | |
| Middle East and Africa | GCC |
| South Africa | |
| Rest of Middle East and Africa | |
| South America | Brazil |
| Argentina | |
| Rest of South America |
| By Operating System | iOS | |
| Android | ||
| Others (HarmonyOS, KaiOS, web PWA) | ||
| By Revenue Model | Freemium with in-app ads | |
| Subscription (monthly / annual) | ||
| One-time purchase | ||
| Enterprise/B2B licensing | ||
| By Functionality | Calorie & macro tracking | |
| Meal-planning & recipe discovery | ||
| Diet coaching & virtual RD support | ||
| Specialty-diet guidance (keto, vegan, FODMAP, etc.) | ||
| By End-User Demographic | General population | |
| Athletes & fitness enthusiasts | ||
| Chronic-disease patients (diabetes, CVD, obesity) | ||
| Maternal & pediatric users | ||
| Seniors (65+) | ||
| By Geography | North America | United States |
| Canada | ||
| Mexico | ||
| Europe | Germany | |
| United Kingdom | ||
| France | ||
| Italy | ||
| Spain | ||
| Rest of Europe | ||
| Asia-Pacific | China | |
| Japan | ||
| India | ||
| Australia | ||
| South Korea | ||
| Rest of Asia-Pacific | ||
| Middle East and Africa | GCC | |
| South Africa | ||
| Rest of Middle East and Africa | ||
| South America | Brazil | |
| Argentina | ||
| Rest of South America | ||


Key Questions Answered in the Report
How big is the diet and nutrition apps market in 2025?
The diet and nutrition apps market size reached USD 5.76 billion in 2025 and is projected to grow rapidly through 2030.
What CAGR is expected for diet-tracking applications through 2030?
The segment is forecast to post an 11.97% CAGR between 2025 and 2030.
Which operating system leads adoption of nutrition apps?
Android holds the largest share at 56.34%, though HarmonyOS is the fastest-growing platform to 2030.
What revenue model is expanding quickest among app publishers?
Enterprise B2B licensing is advancing at a 15.37% CAGR as employers integrate digital nutrition into wellness programs.
Page last updated on:


