Personalized Nutrition Market Size and Share
Market Overview
| Study Period | 2020 - 2031 |
|---|---|
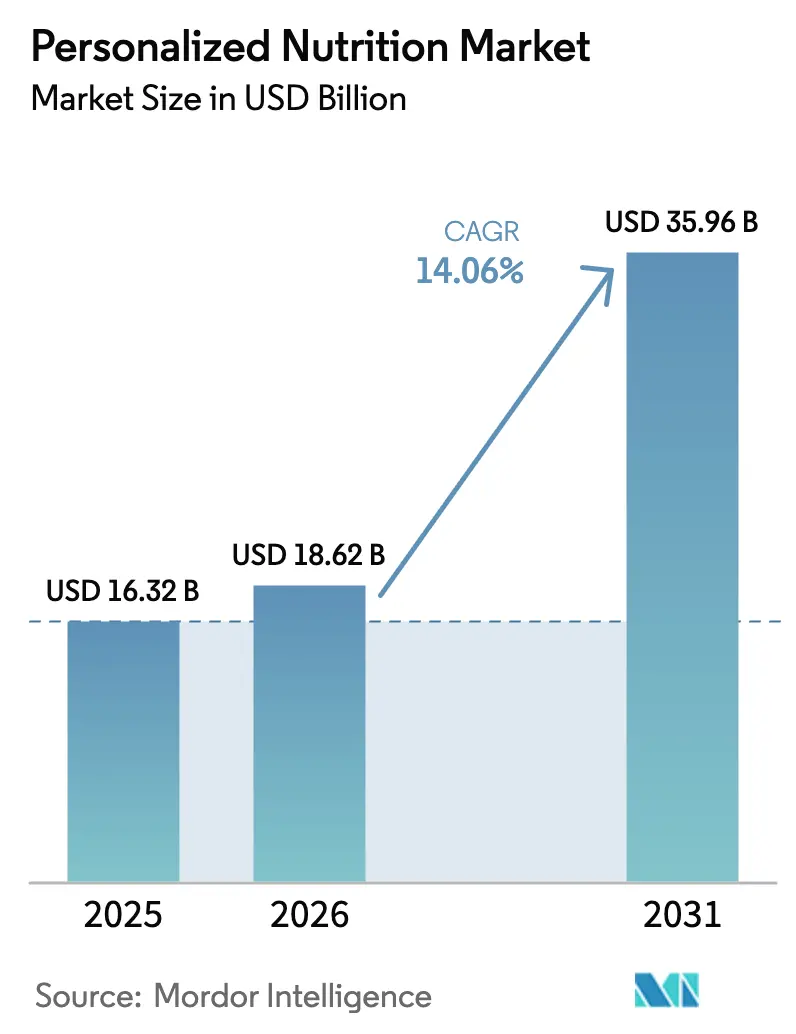
| Market Size (2026) | USD 18.62 Billion |
| Market Size (2031) | USD 35.96 Billion |
| Growth Rate (2026 - 2031) | 14.06% CAGR |
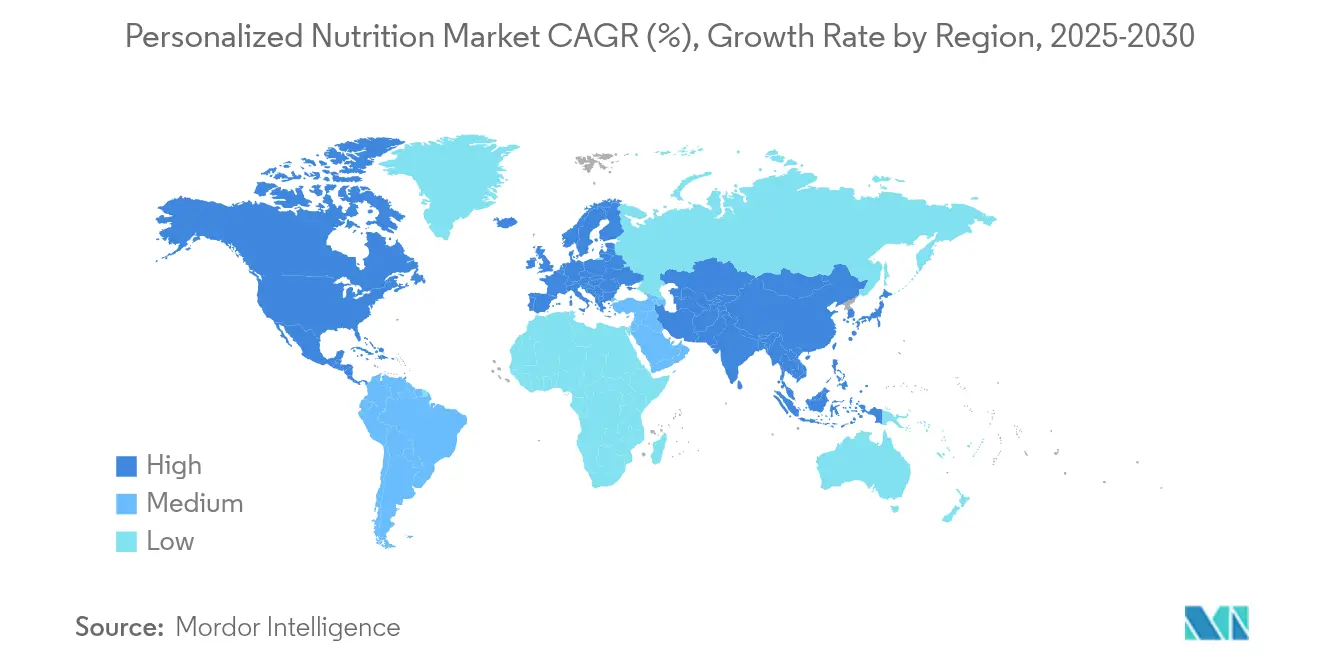
| Fastest Growing Market | Asia Pacific |
| Largest Market | North America |
| Market Concentration | Medium |
Major Players *Disclaimer: Major Players sorted in no particular order Image © Mordor Intelligence. Reuse requires attribution under CC BY 4.0. | |
Personalized Nutrition Market Analysis by Mordor Intelligence
The personalized nutrition market size is expected to grow from USD 16.32 billion in 2025 to USD 18.62 billion in 2026 and is forecast to reach USD 35.96 billion by 2031 at 14.06% CAGR over 2026-2031. This expansion reflects the shift from wellness add-ons to core healthcare tools powered by artificial intelligence, multi-omics testing, and continuous digital monitoring. Consumer willingness to invest in prevention rose sharply after the pandemic, while global spending on GLP-1 medications has made metabolic health top of mind across age groups. Employers are embedding precision wellness into benefit plans, and insurers in selected markets have begun to reimburse evidence-backed programs, signaling deeper integration into formal care pathways. Regulatory agencies now encourage science-based claims, which accelerates product approvals yet raises the bar for clinical proof and data stewardship.
Key Report Takeaways
- By product type, Active Measurement solutions held 57.48% revenue share in 2025, while Standard Measurement products recorded the highest projected CAGR at 15.95% through 2031.
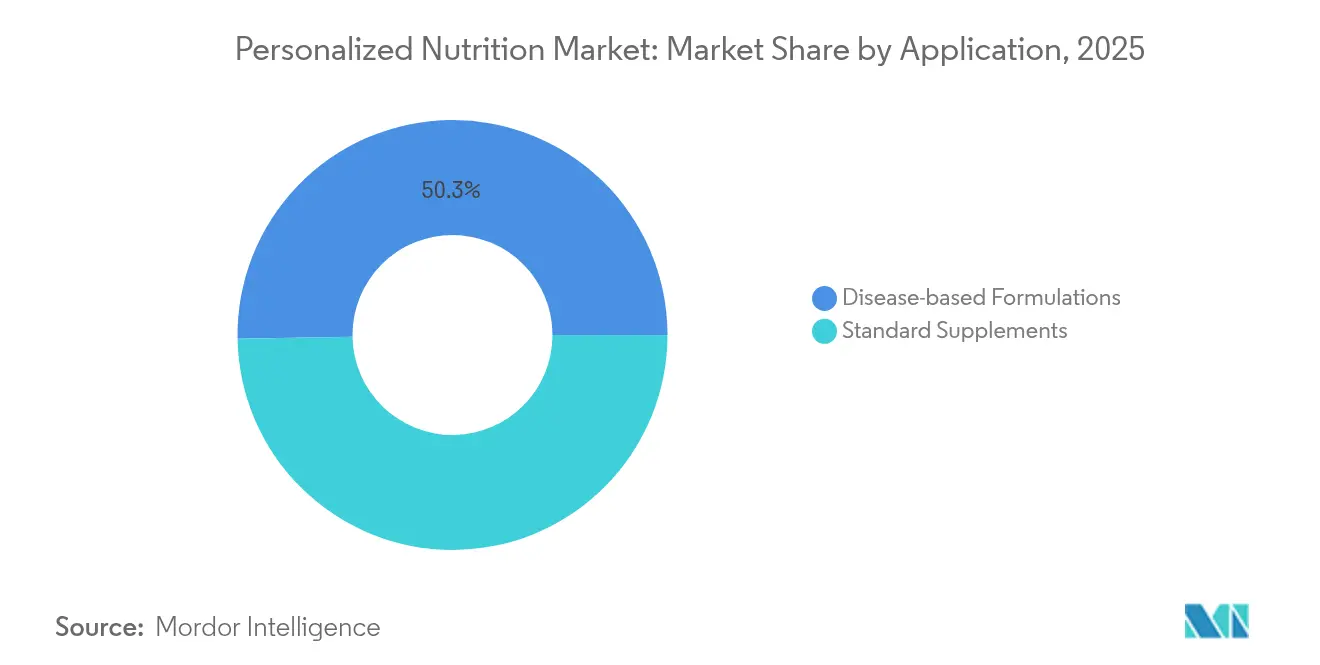
- By application, Standard Supplements captured 49.72% of personalized nutrition market share in 2025; Disease-based Formulations are expected to expand at a 14.72% CAGR to 2031.
- By end user, Direct-to-Consumer channels controlled 62.85% of demand in 2025, whereas Wellness & Fitness Centres are projected to grow at 14.18% CAGR through 2031.
- By geography, North America led with 43.92% revenue share in 2025, while Asia Pacific is on track to grow at 14.34% CAGR over the forecast period.
Note: Market size and forecast figures in this report are generated using Mordor Intelligence’s proprietary estimation framework, updated with the latest available data and insights as of 2026.
Global Personalized Nutrition Market Trends and Insights
Drivers Impact Analysis*
| Driver | (~) % Impact on CAGR Forecast | Geographic Relevance | Impact Timeline |
|---|---|---|---|
| Shift In Consumer Health Awareness | +2.10% | Global, strongest in North America & Europe | Medium term (2-4 years) |
| Burden Of Chronic Disease & Ageing Population | +2.80% | Global, acute in developed markets | Long term (≥ 4 years) |
| Digital-Health & Wearables Ecosystem Expansion | +2.40% | North America & APAC core, spill-over to Europe | Short term (≤ 2 years) |
| Direct-To-Consumer (DTC) Test Kit Affordability | +1.90% | Global, accelerated in emerging markets | Medium term (2-4 years) |
| Employer-Sponsored Precision-Wellness Programs | +1.60% | North America & Europe primarily | Medium term (2-4 years) |
| AI-Enabled Microbiome Precision Formulations | +2.70% | Global, led by North America innovation hubs | Long term (≥ 4 years) |
| Source: Mordor Intelligence | |||
Shift in Consumer Health Awareness
Consumers now view food as a primary lever for disease prevention rather than an afterthought in treatment. Post-pandemic surveys show that 78% intend to make new wellness purchases by 2025, and more than half of those interested in personalized solutions are targeting weight management. Genetic testing kits appeal to a similar proportion, confirming mainstream readiness for individualized approaches. Companies such as Bioniq have capitalized, reporting a five-fold user increase in 2024 as transparency and measurable outcomes become non-negotiable purchasing criteria. The trend favors offerings that translate complex biomarker data into clear dietary actions, cementing demand for subscription-based models that enable continuous refinement.
Burden of Chronic Disease and Ageing Population
Type 2 diabetes affects more than 400 million people worldwide, and metabolic syndrome touches one-quarter of adults, pushing healthcare costs to unsustainable levels.[1]“Microbiome Precision Formulations,” News Medical, news-medical.net Nutritional targeting has proved cost-effective in delaying progression, and randomized studies report measurable improvements in triglycerides, weight, and HbA1c when programs are personalized. Ageing intensifies the opportunity: adults over 65 are the fastest-growing group, seeking muscle preservation and cognitive support. Abbott’s Ensure exceeded USD ~3 billion in 2024 on the back of this demographic shift. As payers recognize the economic upside, reimbursement pilots for nutrition-as-medicine are emerging, particularly for metabolic and cardiovascular indications.
Digital-Health and Wearables Ecosystem Expansion
Continuous glucose monitors, smart rings, and sleep trackers generate real-time data that feeds adaptive nutrition algorithms. Market value for wearables is projected to reach USD 101.8 billion in 2025, enlarging the data lake for personalized programs.[2]Jocelyn Kaiser, “Huge U.S. ‘precision nutrition’ project aims to tailor diets to people’s needs,” Science, science.org InsideTracker now merges blood, DNA, and fitness inputs to craft minute-level nutrition advice, demonstrating the convergence of devices and dietary guidance. Platform interoperability enables dynamic meal planning that adjusts to stress, activity, and hormonal fluctuations, reinforcing user engagement and retention rates above traditional supplement models.
AI-Enabled Microbiome Precision Formulations
Machine learning can parse trillions of microbial data points to predict optimal probiotic and prebiotic blends. Early studies report significant gains in gut diversity and metabolic markers after AI-driven interventions. Digital twin simulations run hypothetical diet changes before a user adopts them, reducing trial-and-error cycles. The United States National Institutes of Health invested USD 156 million in precision nutrition research to refine such models, ensuring a pipeline of validated algorithms.[3Uday C. Ghosh, “Wearable Technology and Personalized Nutrition: A Review,” Nutrients, mdpi.com] These tools create high-margin opportunities for ingredient suppliers that can tailor formulations at batch sizes of one.
Restraints Impact Analysis*
| Restraint | (~) % Impact on CAGR Forecast | Geographic Relevance | Impact Timeline |
|---|---|---|---|
| High Product & Testing Costs | -1.80% | Global, acute in emerging markets | Short term (≤ 2 years) |
| Limited Awareness In Emerging Nations | -1.40% | APAC, MEA, Latin America primarily | Medium term (2-4 years) |
| Data-Privacy & Ownership Concerns | -1.20% | Europe & North America regulatory focus | Long term (≥ 4 years) |
| Limited Clinical-Outcomes Validation | -1.60% | Global, regulatory scrutiny increasing | Medium term (2-4 years) |
| Source: Mordor Intelligence | |||
High Product and Testing Costs
Comprehensive programs can reach USD 500 per month when testing, coaching, and customized supplements are bundled, limiting adoption among middle-income consumers. Manufacturing remains 3-5 times more expensive than standard capsules because small batches run counter to economies of scale. Insurance coverage is still sparse, exacerbating affordability issues in emerging markets where chronic disease prevalence is rising fastest. Tiered subscription models and simplified biomarker panels are lowering entry prices, yet core cost structures continue to restrain penetration until scale or automation offsets premium inputs.
Data-Privacy and Ownership Concerns
Personalized nutrition platforms collect genetic, microbiome, and metabolic data that fall under strict privacy regulations. The European Union’s GDPR grants individuals ownership rights that complicate secondary data use, while forthcoming United States legislation seeks comparable protections. Breaches can erode trust and draw heavy fines, prompting firms to invest in secure cloud architectures and zero-knowledge protocols. Transparent consent flows and on-device analytics offer partial solutions, but ongoing compliance costs weigh on smaller providers more than on global incumbents.
*Our forecasts treat driver/restraint impacts as directional, not additive. The impact forecasts reflect baseline growth, mix effects, and variable interactions.
Segment Analysis
By Product Type: Active Measurement Drives Market Evolution
Active Measurement solutions contributed 57.48% of revenue in 2025, underscoring the appeal of quantified health feedback loops. The personalized nutrition market size for this segment is projected to expand at 15.23% CAGR to 2031, fueled by the rise of at-home biomarker kits and continuous glucose monitors that replace guesswork with data. Hyper-personalized blends generated from AI analysis of blood micronutrient gaps, such as Bioniq’s “Build Your Own,” position providers to upsell premium tiers that adjust compositions monthly.
Standard Measurement products still draw a loyal base seeking basic vitamin corrections at lower price points. However, their growth lags as consumers migrate toward offerings that promise measurable impacts. Partnerships with pharmacies and grocery chains could revive momentum by embedding entry-level kits into everyday shopping journeys. A hybrid strategy that pairs low-cost baseline formulations with optional data upgrades may allow Standard Measurement players to defend share without cannibalizing margins.


By Application: Disease-Based Formulations Emerge as Growth Engine
Standard Supplements represented 49.72% of 2025 revenue, reflecting widespread use of personalized micronutrient packs for immunity, cognition, and energy. Nonetheless, Disease-based Formulations increased at a faster 14.72% CAGR and are projected to become the lead growth driver as healthcare systems adopt nutrition-as-therapy protocols. The personalized nutrition market share for metabolic syndrome regimens is rising because regulators now accept food-health claim linkages, as highlighted by the FDA’s yogurt-diabetes decision.
Therapeutic programs demand rigorous clinical validation yet command higher reimbursement and longer customer lifecycles. Companies that invest early in randomized trials can secure first-mover advantage and premium pricing while building intellectual property around ingredient synergies. Standard Supplements will remain the widest gateway for new users, especially when combined with digital scoring that unlocks objective feedback without invasive tests.
By End User: DTC Dominance Reshapes Distribution Models
Direct-to-Consumer services captured 62.85% of demand in 2025 as digital native brands removed clinical gatekeepers and delivered doorstep convenience. The personalized nutrition market size for DTC channels is expected to expand steadily as subscription retention surpasses 18 months on average, underpinning predictable recurring income. Viome processed 350,000 tests across 106 countries by 2024, proving the scalability of remote sampling logistics.
Wellness & Fitness Centres are forecast to grow fastest at 14.18% CAGR because face-to-face guidance enhances compliance for users pursuing performance goals. Gyms and boutique studios increasingly bundle genetic testing with training plans, creating integrated propositions that traditional clinics rarely match. Hospitals & Clinics preserve a niche for patients requiring multidisciplinary oversight, especially in oncology and bariatric care, where nutrition intersects with complex treatment regimens.
Geography Analysis
North America accounted for 43.92% of global revenue in 2025 and remains the primary innovation hub for personalized nutrition market players. Venture funding, regulatory clarity, and high disposable incomes support premium pricing. The FDA’s updated “healthy” labeling framework has further professionalized product claims. Canada contributes niche advances such as plant-based protein blends that outperform whey in clinical studies, reflecting regional demand for sustainable options. Employer wellness contracts and early insurer experiments continue to underpin North American leadership.
Asia Pacific is the fastest-growing region with a 14.34% CAGR forecast through 2031. China’s three-year weight management plan and consumer openness to metabolic solutions draw multinational suppliers eager to localize formulas. India’s 136 million pre-diabetic adults present a sizable addressable base, and local firms like Zantus Lifesciences have launched culturally adapted meal replacements to serve religious and taste preferences. Japan’s Foods with Function Claims system, now valued at JPY 357 billion, provides a stringent yet predictable approval route, attracting cross-border entrants with evidence-backed ingredients. South Korea and Australia add momentum through technology adoption and public health campaigns.
Europe holds a significant share owing to evidence-driven consumer cultures and GDPR safeguards that encourage data trust. The European Food Safety Authority streamlined novel food evaluations in 2025, accelerating time to market for precision formulations. Germany, the United Kingdom, and France lead purchases, while Mediterranean countries focus on cardiovascular prevention programs that integrate nutrigenomics. Middle East and Africa, plus South America, remain in early adoption phases but benefit from rising internet penetration and private health investments. Strategic partnerships with local distributors, seen in iPRO’s Saudi Arabia entry, illustrate the necessity of regional tailoring over one-size-fits-all approaches.

Competitive Landscape
The personalized nutrition market features moderate fragmentation with accelerating consolidation as incumbents and disruptors vie for technology, data, and distribution advantages. Nutrition multinationals such as Abbott, Nestlé Health Science, and DSM-Firmenich leverage manufacturing scale and regulatory fluency to integrate precision offerings into established brands. Abbott reported a 6.8% organic increase in adult nutrition sales during Q1 2025, powered by Ensure and Glucerna upgrades. Nestlé opened a deep tech center in Switzerland to advance AI-powered fermentation for custom ingredients.
Specialists like Viome, 23andMe, Bioniq, and InsideTracker differentiate through proprietary algorithms and multi-omics databases. Bioniq employs over 6 million biochemical data points to craft micro-batch supplements, and celebrity backing from Cristiano Ronaldo raised its valuation to USD 82 million in 2025. Regeneron’s USD 256 million purchase of 23andMe signals the pharmaceutical sector’s intent to harness consumer genetic data for both drug discovery and nutrition-adjacent therapeutics.
Competitive playbooks emphasize vertical integration and omnichannel reach. Providers are coupling at-home kits with clinic partnerships to balance convenience and credibility. Data security investments and transparent consent processes are fast becoming table stakes, as any breach could vaporize brand equity in a privacy-sensitive arena.
Personalized Nutrition Industry Leaders
Abbott
Amway Corporation
Superior Supplement Manufacturing
Metagenics, Inc.
Herbalife International of America, Inc
- *Disclaimer: Major Players sorted in no particular order

Recent Industry Developments
- June 2025: Danone launched AI-powered Iron Tracker and Growth Tracker tools in Singapore, expanding preventive capabilities within its D-Lab.
- February 2024: Nestlé has announced the launch of a new deep tech center to enhance its precision fermentation capabilities. This center will focus on AI-driven product development and biotech applications, aiming to deliver personalized nutrition solutions in Switzerland.
- February 2025: EFSA implemented updated guidelines for novel foods to streamline personalized ingredient approvals.
- January 2025: Bioniq introduced 'Build Your Own' hyper-personalized supplement using 6 million data points.


Research Methodology Framework and Report Scope
Market Definitions and Key Coverage
Mordor Intelligence defines the personalized nutrition market as the total value generated when nutrient products, diagnostic kits, mobile apps, and advisory services are explicitly tailored to an individual's genetic, biomarker, microbiome, or lifestyle profile and then delivered through direct-to-consumer, wellness center, or clinical settings. We count revenue only once at the point the customized solution reaches the end user.
Generic multivitamins, mass-market sports drinks, and bulk meal replacements that do not reference an individual data set remain outside our scope.
Segmentation Overview
- By Product Type
- Active Measurement
- Standard Measurement
- By Application
- Standard Supplements
- Disease-based Formulations
- By End User
- Direct-to-Consumer
- Wellness & Fitness Centres
- Hospitals & Clinics
- By Geography
- North America
- United States
- Canada
- Mexico
- Europe
- Germany
- United Kingdom
- France
- Italy
- Spain
- Rest of Europe
- Asia Pacific
- China
- Japan
- India
- South Korea
- Australia
- Rest of Asia Pacific
- Middle East & Africa
- GCC
- South Africa
- Rest of Middle East & Africa
- South America
- Brazil
- Argentina
- Rest of South America
- North America
Detailed Research Methodology and Data Validation
Desk Research
We start with wide-ranging desk work that pulls consumption and health-outcome dashboards from sources such as the World Health Organization, FAO food balance sheets, OECD health expenditure data, and customs shipment logs for test kits and nutraceutical inputs. Our team also scans academic journals like Nutrients and the American Journal of Clinical Nutrition for adoption rates of omics-based interventions.
Subsequently, we mine company 10-Ks, investor decks, and trade-association releases (Council for Responsible Nutrition, International Food Information Council) to spot pricing pivots and emerging distribution plays. Where deeper financial splits are required, D&B Hoovers and Dow Jones Factiva give us segment sales that feed our model. This list is illustrative; many other credible open-source and paid points were referenced during validation.
Primary Research
Mordor analysts interview founders of DTC platforms, dietitians at hospital metabolic clinics, and suppliers of microbiome tests across North America, Europe, and key Asian metros. Insights on average test uptake, refill cadence, and emerging price bands let us cross-check desk estimates and refine regional weightings.
Market-Sizing & Forecasting
Top-down sizing begins by reconstructing 2024 household spend on vitamins, functional foods, and wellness apps, then applying our measured penetration rates for active and standard personalization tiers. Selective bottom-up rolls of leading platform subscribers plus sampled average selling prices validate the totals before adjustments. Core variables, DNA kit purchases, continuous glucose monitor shipments, probiotic capsule ASPs, diet-related chronic disease prevalence, and smartphone health-app installs drive both the historical base and our multivariate regression forecast. Scenario overlays account for regulatory shifts and disposable-income elasticity; gaps in emerging markets are bridged using proxy indicators such as online nutrition query volumes.
Data Validation & Update Cycle
Model outputs pass three analyst reviews where outliers are flagged against independent metrics like nutraceutical export values and app-store revenue charts. Reports refresh each year, and we trigger interim updates when major funding rounds, legislative changes, or ingredient supply shocks alter market math.
Why Mordor's Personalized Nutrition Baseline Earns Trust
Published figures often diverge because firms pick different inclusion rules, price points, and refresh cadences.
We openly list ours so decision-makers see how the numbers were built.
Benchmark comparison
| Market Size | Anonymized source | Primary gap driver |
|---|---|---|
| USD 16.32 B | Mordor Intelligence | - |
| USD 15.79 B | Global Consultancy A | Omits digital-only coaching apps and counts services net of promotional discounts |
| USD 17.90 B | Industry Association B | Bundles generic sports nutrition powders and mass multivitamins into total |
The comparison shows that wider or narrower scopes, differing price-capture rules, and infrequent dataset refreshes are the main gap drivers. By grounding our baseline in transparent definitions, current-year primary checks, and an annual refresh promise, Mordor Intelligence provides a dependable starting point for strategic choices.


Key Questions Answered in the Report
How big is the personalized nutrition market in 2026?
The personalized nutrition market stands at USD 18.62 billion in 2026 with a 14.06% CAGR outlook to 2031.
Which product segment leads the personalized nutrition market?
Active Measurement solutions lead with 57.48% revenue share in 2025 thanks to data-driven testing kits and continuous monitoring tools.
Which geographic region is growing fastest?
Asia Pacific is projected to post a 14.34% CAGR through 2031, propelled by government metabolic health initiatives and expanding middle-class awareness.
What is driving adoption of personalized nutrition programs?
Rising chronic disease prevalence, improved digital-health infrastructure, and AI-enabled microbiome formulations are key catalysts.
How significant are data-privacy concerns in this market?
Data ownership rules such as GDPR impose strict controls and increase compliance costs, reducing forecast CAGR by about 1.2%.
What level of market consolidation exists today?
The market is moderately consolidated with a concentration score of 5, meaning leading firms hold slightly more than half of total revenue without stifling innovative startups.
Page last updated on:


