Food Allergy Market Size and Share
Market Overview
| Study Period | 2019 - 2030 |
|---|---|
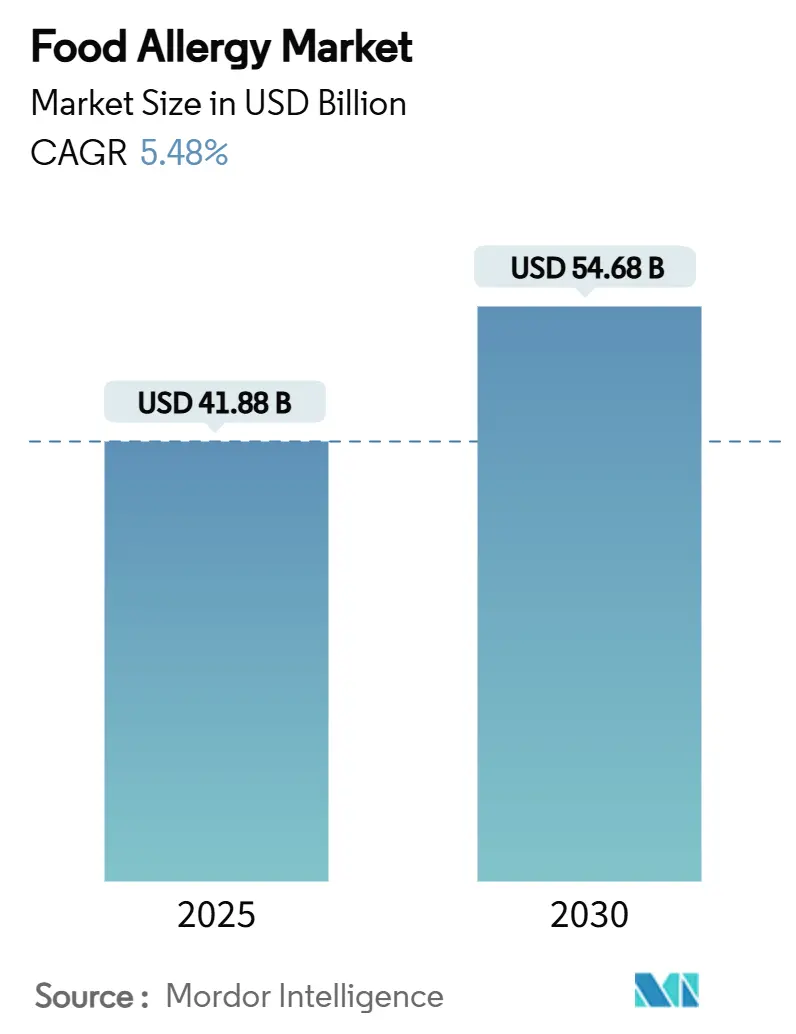
| Market Size (2025) | USD 41.88 Billion |
| Market Size (2030) | USD 54.68 Billion |
| Growth Rate (2025 - 2030) | 5.48% CAGR |
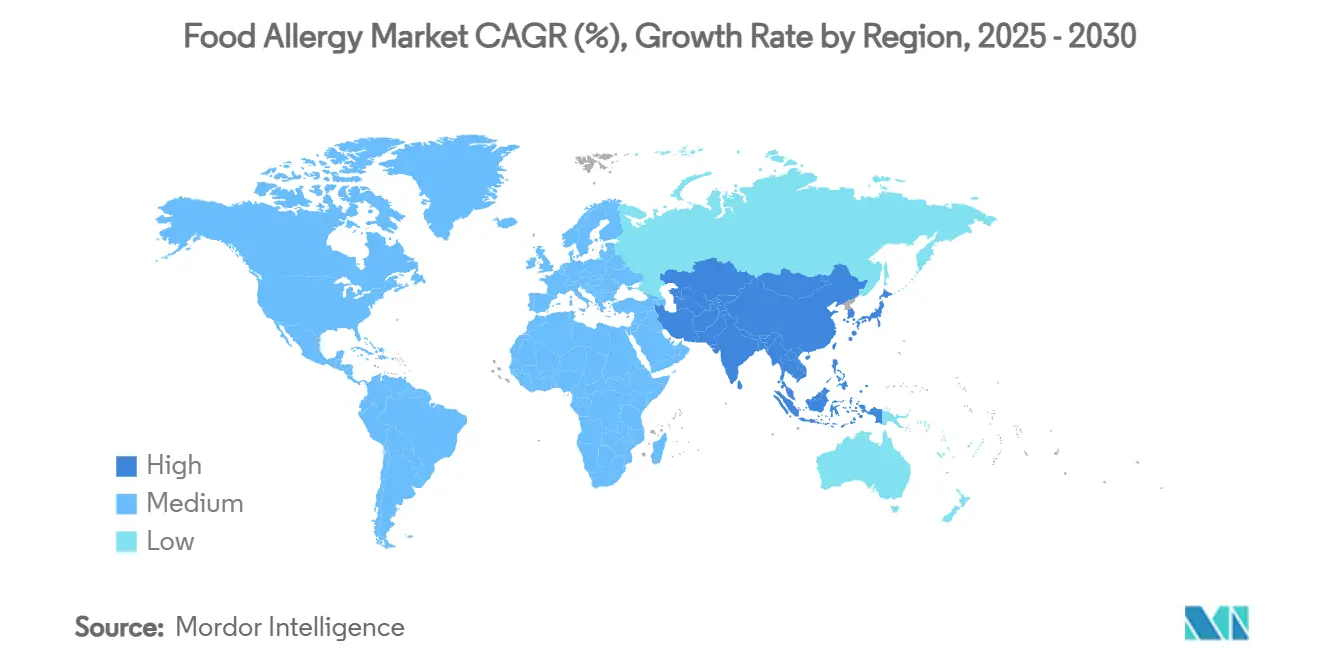
| Fastest Growing Market | Asia Pacific |
| Largest Market | North America |
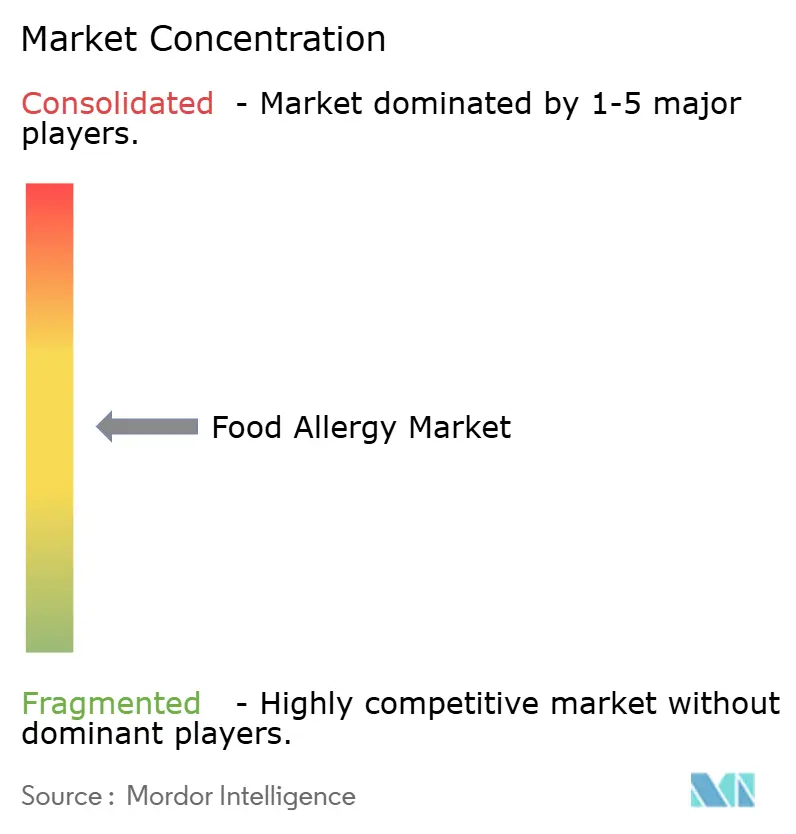
| Market Concentration | Medium |
Major Players *Disclaimer: Major Players sorted in no particular order Image © Mordor Intelligence. Reuse requires attribution under CC BY 4.0. | |
Food Allergy Market Analysis by Mordor Intelligence
The global food allergy market size stands at USD 41.88 billion in 2025 and is forecast to reach USD 54.68 billion by 2030, expanding at a 5.48% CAGR during 2025-2030. Strong regulatory tailwinds, a steady rise in clinically diagnosed allergies, and breakthrough approvals such as omalizumab are repositioning interventions from reactive symptom relief toward proactive tolerance-building. Component-resolved diagnostics, AI-enabled dosing algorithms, and sesame’s elevation to “major allergen” status are catalyzing product innovation and reshaping manufacturer compliance strategies. Demand for at-home test kits is unlocking new consumer channels, while biologics and oral immunotherapy (OIT) platforms are attracting fresh capital as payers begin to value long-term quality-of-life gains. Competitive rivalry is intensifying as incumbents defend share through digital health partnerships and smaller biotechs push nanoparticle, epicutaneous, and enzymatic-processing solutions.
Key Report Takeaways
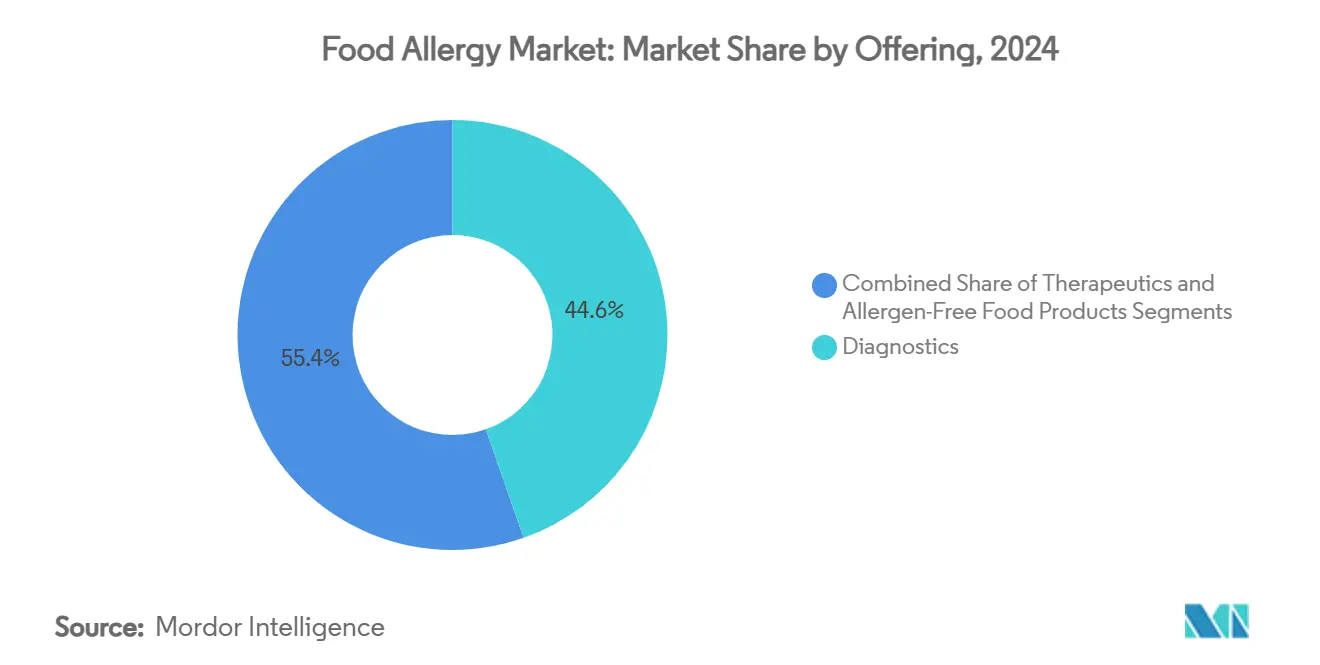
- By offering, diagnostics commanded 44.62% revenue in 2024, while therapeutics are projected to deliver the fastest expansion at an 8.38% CAGR to 2030.
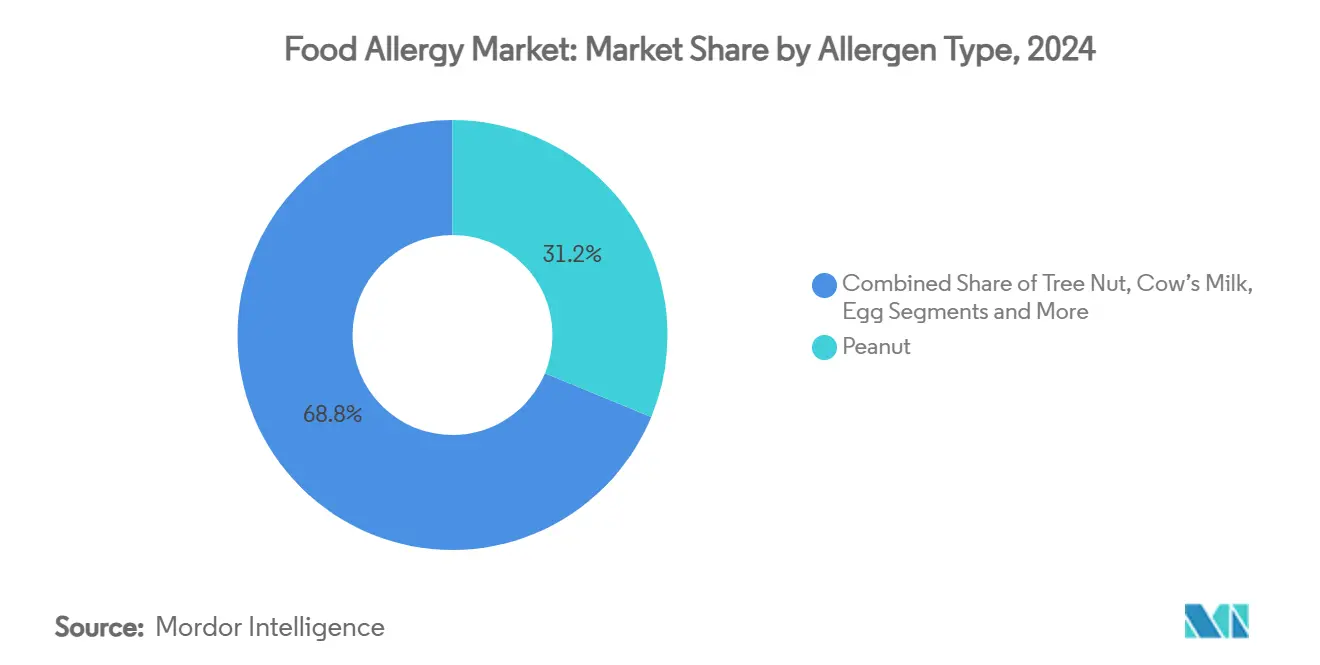
- By allergen type, peanut retained 31.23% of the food allergy market share in 2024, whereas sesame is advancing at a 9.39% CAGR through 2030.
- By end user, hospitals and clinics held 39.76% of the food allergy market size in 2024; home and self-testing consumers record the highest projected CAGR at 8.63% to 2030.
- By geography, North America led with a 36.72% share of the food allergy market in 2024, while Asia-Pacific is set to grow at a 7.49% CAGR during the forecast horizon.
Global Food Allergy Market Trends and Insights
Drivers Impact Analysis*
| Driver | (~) % Impact on CAGR Forecast | Geographic Relevance | Impact Timeline |
|---|---|---|---|
| Rising Prevalence Of Food Allergies In Children & Adults | + 1.2% | Global, with highest impact in North America & Europe | Long term (≥ 4 years) |
| Stricter Global Food‐Allergen Labelling Regulations | + 0.8% | Global, led by US FASTER Act and EU regulations | Medium term (2-4 years) |
| Rapid Adoption Of Component-Resolved & At-Home Diagnostics | + 1.0% | North America & Europe core, expanding to APAC | Medium term (2-4 years) |
| FDA/EMA Approvals Of First-In-Class Biologics & OIT Products | + 1.5% | North America & Europe, with regulatory spillover globally | Short term (≤ 2 years) |
| AI-Driven Personalised Immunotherapy Dosing Platforms | + 0.7% | North America & Europe, early adoption in APAC urban centers | Long term (≥ 4 years) |
| Food-Processing Tech (Pulsed-Light, Enzymatic) Lowering Allergenicity | + 0.6% | Global, with industrial adoption in developed markets first | Long term (≥ 4 years) |
| Source: Mordor Intelligence | |||
Rising Prevalence of Food Allergies in Children & Adults
Hospitalizations for anaphylaxis in England climbed from 12,361 in 2002-03 to 25,721 in 2022-23, and U.S. annual economic burden is now USD 24.8 billion.[1]Tonya Winders, “Navigating the Landscape of Food Allergies: Insights and Perspectives From the AMCP Market Insights Program,” Journal of Managed Care & Specialty Pharmacy, jmcp.org Urbanization, westernized diets, and microbiome alterations are escalating sensitization rates across Asia-Pacific, where shellfish now ranks as the dominant trigger. Mechanistic research pinpointing Thetis cells confirms a developmental window for establishing oral tolerance, suggesting that prophylactic therapies could emerge for high-risk infants.[2] Steven M. Gendel, “Comparison of International Food Allergen Labeling Regulations,” Food and Chemical Toxicology, sciencedirect.com As prevalence rises, caregivers are shifting from episodic emergency care toward continuous risk-mitigation solutions, a trend that expands total addressable demand for diagnostics, digital coaching, and prophylactic treatments. Consequently, multi-allergen product pipelines and monitoring tools are growing more attractive to venture investors, reinforcing momentum in the food allergy market.
Stricter Global Food-Allergen Labeling Regulations
The U.S. FASTER Act added sesame as the 9th major allergen in 2023, obliging manufacturers to manage cross-contact and reformulate supply chains. Similar expansions are under review in Canada, the United Kingdom, and parts of Asia, yet regulatory lists vary, forcing multinational brands to juggle divergent compliance codes. Some U.S. bakeries opted to deliberately add sesame to avoid cleaning costs, exposing enforcement gaps and re-energizing advocacy groups. These discrepancies raise demand for lab-based protein screening, inline sensors, and enterprise allergen-management software capable of harmonizing region-specific thresholds. Small and midsize food processors, facing cost pressures, increasingly outsource validation testing to third-party labs, reinforcing volumes for diagnostics leaders within the food allergy market.
Rapid Adoption of Component-Resolved & At-Home Diagnostics
Component-resolved assays that quantify IgE responses to discrete proteins such as Ara h 2 sharpen risk stratification and guide personalized immunotherapy. Basophil activation tests are moving toward FDA clearance, promising functional confirmation of clinical reactivity. Meanwhile, direct-to-consumer kits, bundled with app-based analytics, are gaining traction despite clinician concerns over false positives and self-directed elimination diets. AI-enhanced interpretation engines now parse multi-allergen panels to flag high-risk profiles and prompt virtual consults, blending convenience with professional oversight. The democratization of testing expands the food allergy market beyond specialty clinics, creating a hybrid ecosystem in which lab networks, digital platforms, and tele-allergists collaborate on continuous monitoring.
FDA/EMA Approvals of First-in-Class Biologics & OIT Products
Omalizumab won FDA authorization in February 2024 for multi-food allergy, enabling 68% of participants to tolerate higher allergen doses versus 6% on placebo. The nod revolutionized therapeutic pathways, validated anti-IgE blockade, and ignited pipelines targeting IL-4/IL-13 and Siglec-8. Comparative trials show omalizumab-facilitated OIT raising desensitization rates to 36% for multiple allergens, nearly doubling standalone OIT. Investors responded with USD 306.9 million in new capital for epicutaneous patches, while ARS Pharmaceuticals’ neffy nasal epinephrine logged USD 7.8 million in Q1 2025 sales. Collectively, these approvals increase physician confidence, inspire payer evaluations of long-term cost offsets, and accelerate therapeutic penetration across the food allergy market.
Restraints Impact Analysis*
| Restraint | (~) % Impact on CAGR Forecast | Geographic Relevance | Impact Timeline |
|---|---|---|---|
| High Cost & Limited Reimbursement For Biologics/Immunotherapy | -1.1% | Global, most pronounced in emerging markets | Medium term (2-4 years) |
| Stringent Safety Requirements & Lengthy Regulatory Pathways | -0.7% | Global, with varying intensity by regulatory jurisdiction | Long term (≥ 4 years) |
| Scarcity Of Pharma-Grade Allergen Extracts For Therapy Manufacture | -0.5% | Global, affecting specialized therapy manufacturers | Medium term (2-4 years) |
| Patient Drop-Outs Due To Adverse Events & Adherence Concerns | -0.9% | Global, with cultural variations in treatment persistence | Short term (≤ 2 years) |
| Source: Mordor Intelligence | |||
High Cost & Limited Reimbursement for Biologics/Immunotherapy
Annual omalizumab therapy ranges from USD 5,000-15,000, levels that outstrip many private or public coverage schedules and restrict uptake outside wealthier cohorts.[3]Marcus Shaker, “Review: Providing Cost-effective Care for Food Allergy,” annallergy.orgOral immunotherapy centers report waiting lists of 500 + patients owing to low reimbursement and staffing constraints. Health-economic models price peanut OIT from USD 1,235-6,568 per year but highlight quality-of-life gains that insurers underrecognize. Until multi-year outcome data sway payers, manufacturers deploy patient-assistance programs and explore value-based contracts. Without broader coverage, biologics risk remaining confined to tertiary centers, tempering near-term growth in the food allergy market.
Patient Drop-Outs Due to Adverse Events & Adherence Concerns
Real-world persistence for sublingual immunotherapy plummets to 9% after 2 years, with 90.9% of early exits driven by side effects such as oropharyngeal pruritus. Oral immunotherapy posts substantial withdrawal due to gastrointestinal distress, daily dosing fatigue, and parental anxiety. Veterans show adherence links to PTSD status and clinic proximity, illustrating psychosocial influences on regimen completion. Early discontinuations compress efficacy rates, inflate per-patient costs, and dampen word-of-mouth adoption. Stakeholders are piloting digital coaching tools, gradual updosing algorithms, and shared-decision frameworks to curb attrition and preserve value for the food allergy market.
*Our forecasts treat driver/restraint impacts as directional, not additive. The impact forecasts reflect baseline growth, mix effects, and variable interactions.
Segment Analysis
By Offering: Therapeutics Outpace Diagnostics in Growth Momentum
Diagnostics held a 44.62% share of the food allergy market in 2024, underpinned by widespread skin-prick tests, serum IgE assays, and the emerging basophil activation test. Volumes are expanding through reference labs, hospital allergy clinics, and retail pharmacies that added drop-off sample services. Adoption of multiplex, component-resolved panels yields richer risk profiles and supports precision dosing. Simultaneously, the therapeutics category is forecast to post an 8.38% CAGR through 2030, accelerating the overall food allergy market size as biologics, epicutaneous patches, and nasal epinephrine spray widen treatment options. Omalizumab’s launch provides a blueprint for next-generation candidates, while DBV Technologies’ Viaskin patch builds momentum in pediatric desensitization. Portfolio expansion signals a long-term migration toward disease-modifying regimens that could eventually eclipse diagnostic revenue streams.
Therapeutic innovation is also fostering cross-sector collaboration. Pharmaceutical leaders are licensing machine-learning platforms that individualize updosing schedules and predict eosinophilic esophagitis risk. Digital therapeutics firms embed adherence nudges and real-time symptom logs, creating data flows that inform regulatory submissions and payer negotiations. This interplay of hardware, software, and biologics is reshaping competitive positioning, and investors view platform synergies as a route to recurring service revenue. By 2030, integrated care bundles that couple diagnostic monitoring with therapeutic delivery may dominate payer formularies and redefine value capture within the food allergy market.


By Allergen Type: Sesame Breaks Into the Mainstream
Peanut accounted for 31.23% of the food allergy market share in 2024, supported by established diagnostic coding, consumer awareness, and a mature pipeline that includes the only FDA-approved OIT product. Yet sesame has registered the fastest expansion, recording a 9.39% CAGR thanks to mandated U.S. labeling and previously under-reported prevalence. Manufacturers now face stringent cross-contact controls, spurring demand for specialized cleaning services and sesame-free contract manufacturing. Component-resolved testing panels that include oleosin proteins improve detection accuracy and reduce false negatives.
Tree nut, cow’s milk, egg, wheat, soy, fish, and shellfish segments each display unique geographic skew. Shellfish dominates Asia-Pacific sensitization patterns, influencing the regional therapeutic mix. Conversely, cow’s-milk and egg allergies peak in early childhood; many patients achieve tolerance naturally by adolescence, limiting long-term treatment spending. Processors are trialing enzymatic debittering and pressure-based protein denaturation to tame soy and wheat allergenicity, but clinical validation remains ongoing. The interplay of regulatory spotlight, scientific breakthroughs, and cultural diet shifts will continue to redistribute segment weights in the food allergy market.
By End User: Self-Testing Extends Market Reach
Hospitals and clinics represented 39.76% of the global food allergy market size in 2024, driven by comprehensive centers offering skin-prick testing, oral food challenges, and biologic administration. Reimbursement familiarity, emergency preparedness, and multidisciplinary expertise sustain patient flow. Specialty allergy centers add behavioral counseling and dietetics, further enhancing retention. However, home and self-testing users are forecast to grow at 8.63% CAGR through 2030 as mail-in dried-blood-spot kits and connected food scanners gain trust.
Consumer platforms leverage computer-vision and natural-language processing to decode ingredient labels and recommend safe alternatives in seconds. Although clinicians note interpretation pitfalls, partnerships with tele-allergists create closed-loop pathways that marry convenience with medical oversight. As prices fall and accuracy improves, hybrid testing-plus-consult subscriptions will likely cannibalize a portion of clinic-based screening yet expand total consumer engagement, amplifying growth prospects for the food allergy market.
Geography Analysis
North America generated 36.72% of 2024 revenue for the food allergy market. Federal legislation, broad insurance coverage for epinephrine auto-injectors, and early adoption of component-resolved diagnostics anchor leadership. Market expansion is further reinforced by school-based anaphylaxis protocols and active patient advocacy, which collectively sustain high diagnosis rates and spur payer experimentation with biologic coverage.
Europe mirrors North American precision in regulatory frameworks but shows greater heterogeneity in reimbursement. Countries such as Germany and the Netherlands reimburse OIT and biologics more liberally than Southern Europe, where public health budgets remain strained. The European Precautionary Allergen Labeling (PAL) scheme influences global packaging norms and encourages multinational food brands to pilot advanced allergen-control technologies in the region first.
Asia-Pacific registers the fastest CAGR at 7.49% through 2030, propelled by rapid urbanization, dietary westernization, and rising shellfish sensitization. However, limited epinephrine auto-injector availability and scarce subspecialty clinics create treatment gaps. Private insurers in Singapore and urban China are now piloting coverage for omalizumab, signaling an eventual move toward premium therapies. South America, the Middle East, and Africa trail due to lower public awareness and reimbursement hurdles yet represent sizeable white-space opportunities as global players seek untapped demand pools within the food allergy market.

Competitive Landscape
The food allergy industry shows moderate fragmentation. Genentech/Roche captured first-mover status with omalizumab, but pipeline congestion is rising as Regeneron-Sanofi push dupilumab into Phase 3 trials for peanut desensitization. DBV Technologies, backed by USD 306.9 million of fresh capital, is preparing a Biologics License Application for its epicutaneous Viaskin Peanut patch. ARS Pharmaceuticals’ neffy nasal spray offers needle-free epinephrine delivery, targeting the school and travel segments where device phobia has dampened auto-injector compliance.
Digital health entrants leverage payer appetite for longitudinal data. Clarify Health and FoodMaestro integrate grocery receipt analytics with symptom trackers to refine exposure maps, while Spoon Guru’s algorithm sits atop Google Cloud to personalize shopping. Laboratory specialists Thermo Fisher Scientific and Omega Diagnostics defend share by bundling multiplex IgE panels with clinical decision-support dashboards. Meanwhile, Northwestern University’s nanoparticle research hints at future disruption via mast-cell selective payloads that could pre-empt anaphylaxis without systemic immunosuppression. As platform partnerships multiply, data ownership and interoperability will influence bargaining power across the food allergy market value chain.
Food Allergy Industry Leaders
F. Hoffmann-La Roche Ltd
Thermo Fisher Scientific Inc.
Danaher Corporation
Nestlé Health Science (Aimmune Therapeutics)
ALK-Abelló A/S
- *Disclaimer: Major Players sorted in no particular order

Recent Industry Developments
- May 2025: Memorial Sloan Kettering scientists identify Thetis cells as gatekeepers of oral tolerance, opening avenues for early-life antigen micro-dosing therapies.
- March 2025: DBV Technologies secures up to USD 306.9 million to advance Viaskin Peanut toward U.S. launch.
- March 2025: James Cook University demonstrates 10-fold lower allergen levels in cell-cultivated fish, hinting at safer future protein alternatives.


Global Food Allergy Market Report Scope
| Diagnostics | In Vivo Tests | Skin-Prick Test |
| Oral Food Challenge | ||
| In Vitro Tests | Immunoassay (IgE, sIgG) | |
| Molecular Diagnostics | ||
| Therapeutics | Pharmacotherapy | Antihistamines |
| Epinephrine Auto-Injectors | ||
| Immunotherapy | Oral Immunotherapy (OIT) | |
| Sublingual Immunotherapy (SLIT) | ||
| Epicutaneous Immunotherapy (EPIT) | ||
| Biologics (anti-IgE, anti-IL-4/13) | ||
| Emerging Therapies (DNA vaccines, nanoparticle-AIT) | ||
| Allergen-Free Food Products | Dairy Alternatives | |
| Gluten-Free Products | ||
| Plant-Based Protein Alternatives | ||
| Peanut |
| Tree Nut |
| Cow’s Milk |
| Egg |
| Wheat & Gluten |
| Soy |
| Fish |
| Shellfish |
| Sesame |
| Other Emerging Allergens |
| Hospitals & Clinics |
| Diagnostic Laboratories |
| Specialty Allergy Centers |
| Home & Self-Testing Consumers |
| Research & Academic Institutes |
| Food & Beverage Manufacturers |
| North America | United States |
| Canada | |
| Mexico | |
| Europe | Germany |
| United Kingdom | |
| France | |
| Italy | |
| Spain | |
| Rest of Europe | |
| Asia-Pacific | China |
| Japan | |
| India | |
| Australia | |
| South Korea | |
| Rest of Asia-Pacific | |
| Middle East and Africa | GCC |
| South Africa | |
| Rest of Middle East and Africa | |
| South America | Brazil |
| Argentina | |
| Rest of South America |
| By Offering | Diagnostics | In Vivo Tests | Skin-Prick Test |
| Oral Food Challenge | |||
| In Vitro Tests | Immunoassay (IgE, sIgG) | ||
| Molecular Diagnostics | |||
| Therapeutics | Pharmacotherapy | Antihistamines | |
| Epinephrine Auto-Injectors | |||
| Immunotherapy | Oral Immunotherapy (OIT) | ||
| Sublingual Immunotherapy (SLIT) | |||
| Epicutaneous Immunotherapy (EPIT) | |||
| Biologics (anti-IgE, anti-IL-4/13) | |||
| Emerging Therapies (DNA vaccines, nanoparticle-AIT) | |||
| Allergen-Free Food Products | Dairy Alternatives | ||
| Gluten-Free Products | |||
| Plant-Based Protein Alternatives | |||
| By Allergen Type | Peanut | ||
| Tree Nut | |||
| Cow’s Milk | |||
| Egg | |||
| Wheat & Gluten | |||
| Soy | |||
| Fish | |||
| Shellfish | |||
| Sesame | |||
| Other Emerging Allergens | |||
| By End User | Hospitals & Clinics | ||
| Diagnostic Laboratories | |||
| Specialty Allergy Centers | |||
| Home & Self-Testing Consumers | |||
| Research & Academic Institutes | |||
| Food & Beverage Manufacturers | |||
| By Geography | North America | United States | |
| Canada | |||
| Mexico | |||
| Europe | Germany | ||
| United Kingdom | |||
| France | |||
| Italy | |||
| Spain | |||
| Rest of Europe | |||
| Asia-Pacific | China | ||
| Japan | |||
| India | |||
| Australia | |||
| South Korea | |||
| Rest of Asia-Pacific | |||
| Middle East and Africa | GCC | ||
| South Africa | |||
| Rest of Middle East and Africa | |||
| South America | Brazil | ||
| Argentina | |||
| Rest of South America | |||


Key Questions Answered in the Report
1. What is the current size of the food allergy market?
The food allergy market size is USD 41.88 billion in 2025 and is projected to hit USD 54.68 billion by 2030 at a 5.48% CAGR.
2. Which segment is growing fastest within the food allergy market?
Therapeutics, buoyed by omalizumab and epicutaneous patches, is forecast to record an 8.38% CAGR through 2030.
3. Why is sesame the fastest-growing allergen category?
Mandatory U.S. labeling exposed previously hidden prevalence, propelling sesame segment revenue at a 9.39% CAGR.
4. How big is the opportunity for at-home allergy testing?
Home and self-testing users are projected to expand at 8.63% CAGR as AI-enabled kits gain credibility and convenience.
5. What regions offer the highest growth potential?
Asia-Pacific leads with a 7.49% CAGR through 2030, driven by urbanization and rising shellfish sensitivities.
Page last updated on:


