Infant Nutrition Market Size and Share
Market Overview
| Study Period | 2020 - 2031 |
|---|---|
| Market Size (2026) | USD 52.48 Billion |
| Market Size (2031) | USD 76.01 Billion |
| Growth Rate (2026 - 2031) | 7.69% CAGR |
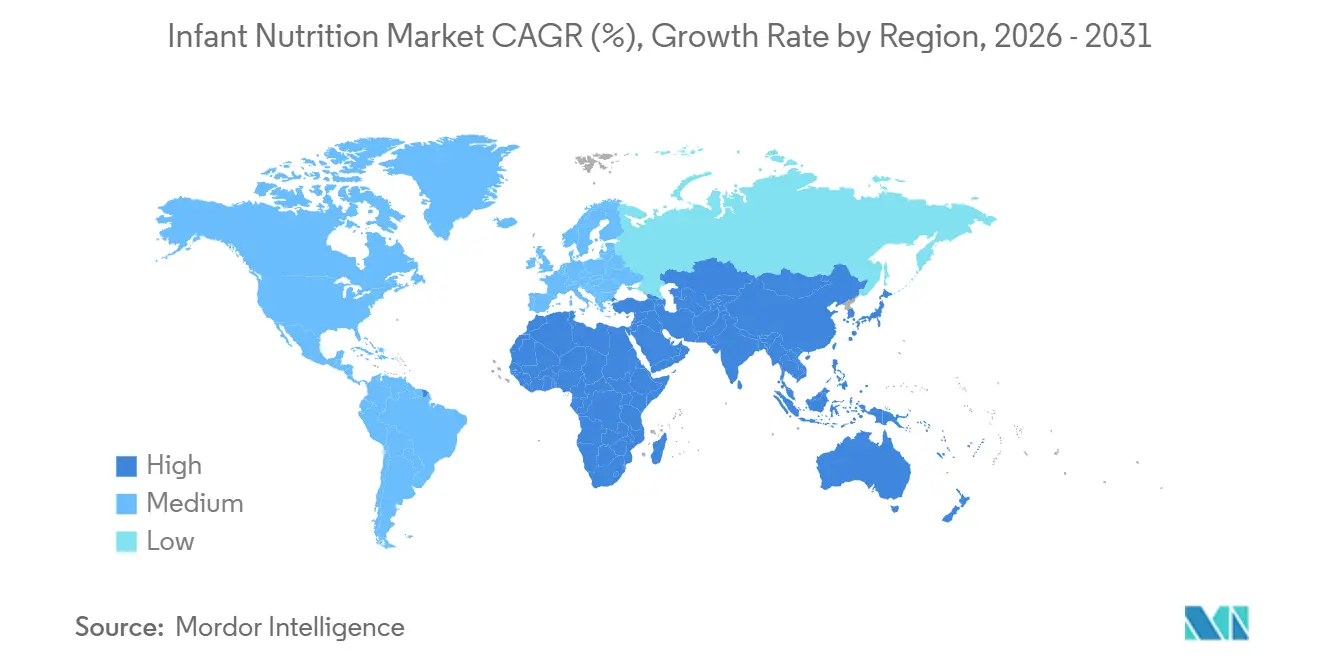
| Fastest Growing Market | Asia Pacific |
| Largest Market | Asia Pacific |
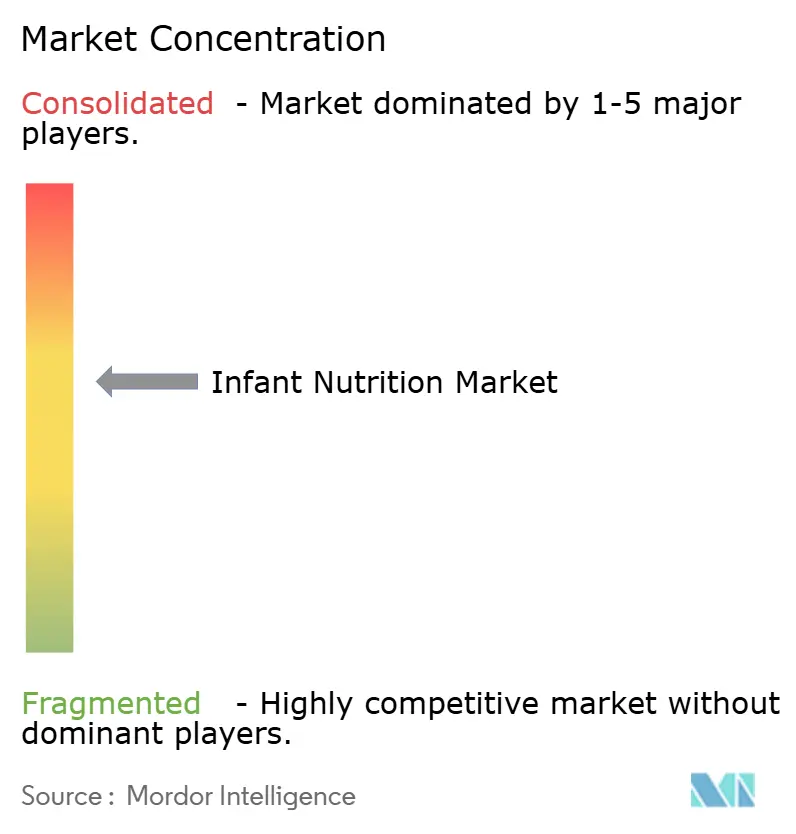
| Market Concentration | Medium |
Major Players *Disclaimer: Major Players sorted in no particular order Image © Mordor Intelligence. Reuse requires attribution under CC BY 4.0. | |
Infant Nutrition Market Analysis by Mordor Intelligence
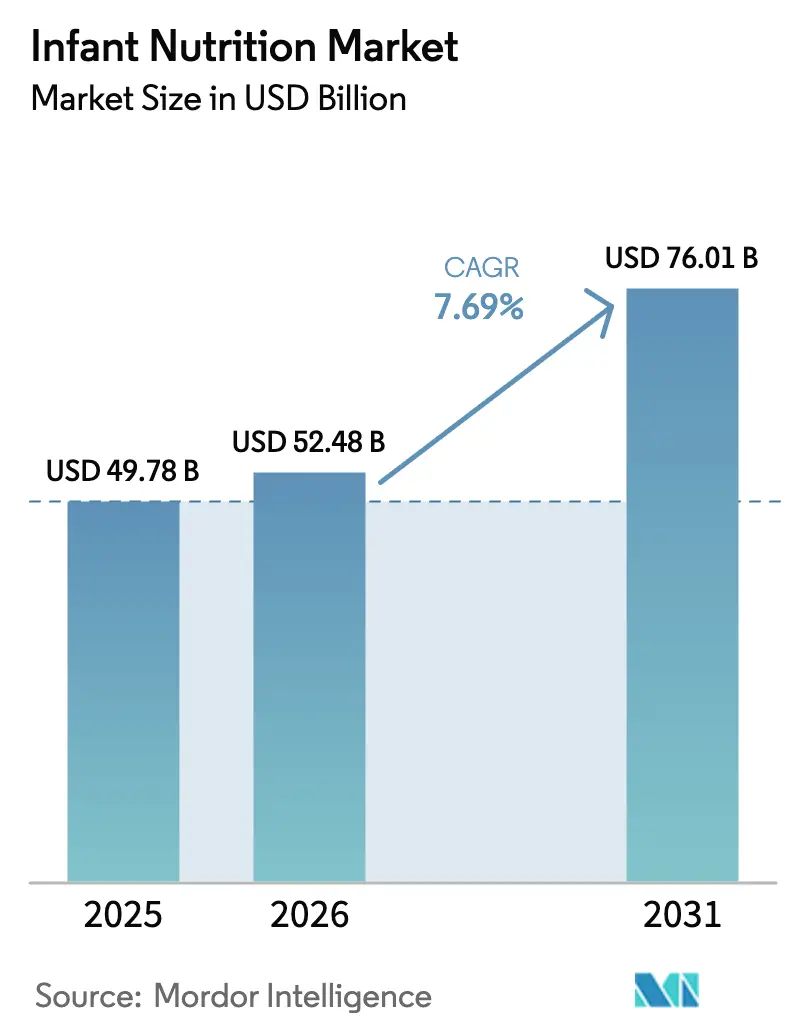
The Infant Nutrition Market size is projected to expand from USD 49.78 billion in 2025 and USD 52.48 billion in 2026 to USD 76.01 billion by 2031, registering a CAGR of 7.69% between 2026 to 2031.
Parents are trading up to premium and clean-label options as scrutiny of contaminants and ingredient provenance rises, while dual-income households lean on formula and convenient complementary foods that fit busy routines. Ingredient science, especially human milk oligosaccharides and targeted probiotics, is enabling clear product differentiation that supports pricing power. Digital and cross-border channels are widening access, helping niche entrants challenge incumbents in select price tiers and regions. Asia-Pacific leads current demand and near-term expansion, with 42.65% of 2025 value and the fastest 9.24% regional CAGR through 2031, a pattern that reflects urban lifestyles and rising incomes across key consumer hubs.
Key Report Takeaways
- By product category, infant formula accounted for 54.24% of 2025 value and prepared baby food is projected to expand at a 9.12% CAGR through 2031.
- By age group, 0-6 months captured 39.41% of 2025 value and 24-36 months is forecast to grow at an 8.34% CAGR through 2031.
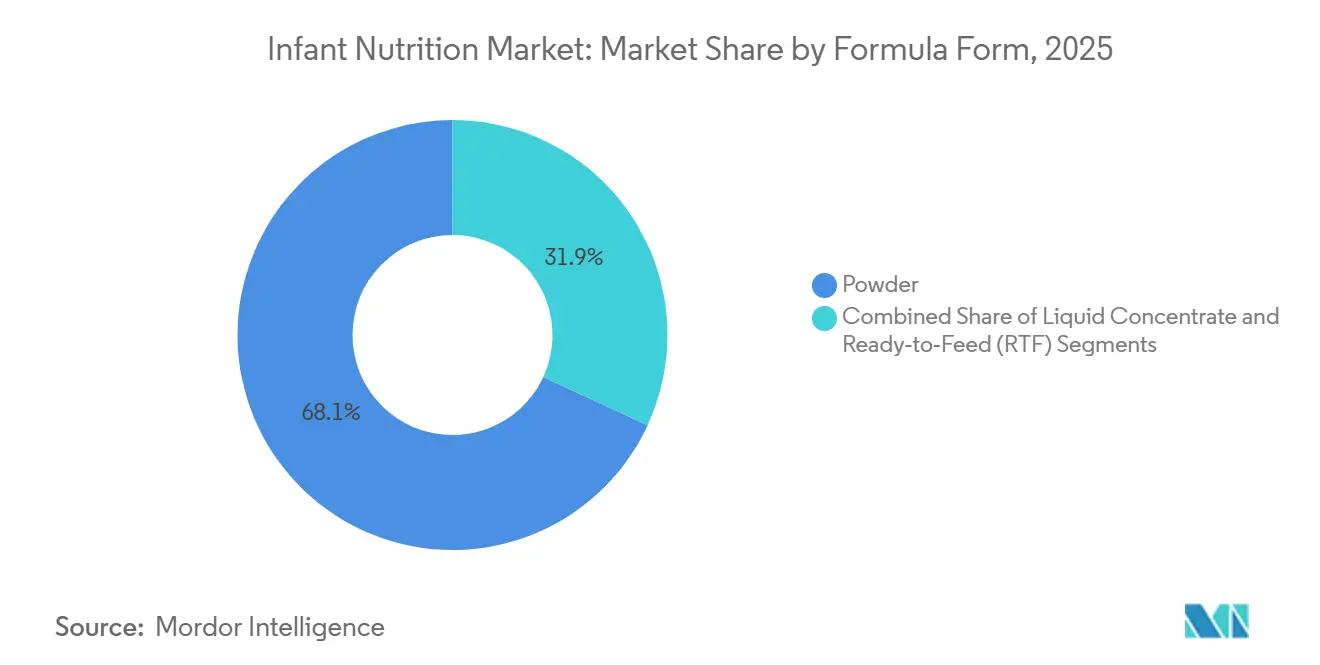
- By formula form, powder held 68.11% of 2025 value and ready-to-feed is set to grow at a 10.03% CAGR through 2031.
- By nature, conventional products retained 62.32% of 2025 value and organic offerings are projected to expand at a 9.25% CAGR through 2031.
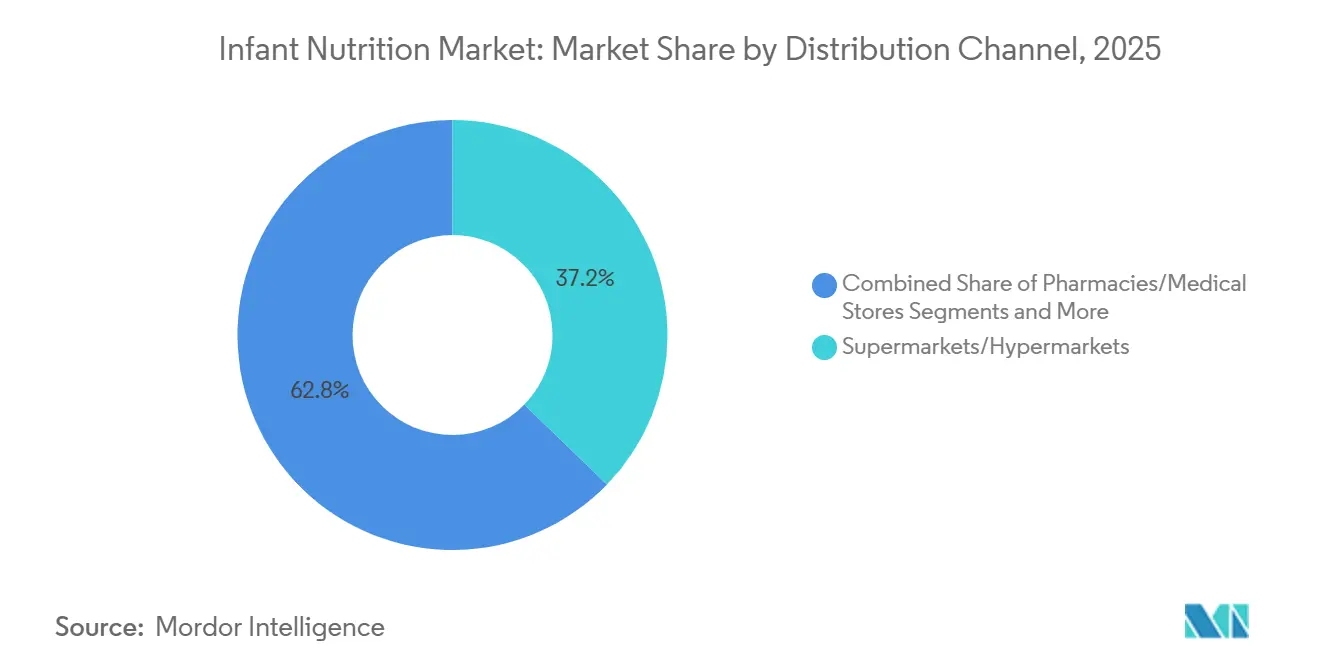
- By distribution channel, supermarkets and hypermarkets held 37.24% of 2025 value and online retail is forecast to grow at an 11.63% CAGR through 2031.
- By geography, Asia-Pacific accounted for 42.65% of 2025 value and is expected to advance at a 9.24% CAGR through 2031.
Note: Market size and forecast figures in this report are generated using Mordor Intelligence’s proprietary estimation framework, updated with the latest available data and insights as of January 2026.
Global Infant Nutrition Market Trends and Insights
Drivers Impact Analysis*
| Driver | (~) % Impact on CAGR Forecast | Geographic Relevance | Impact Timeline |
|---|---|---|---|
| Dual-income households reliance on formula and convenient foods | +1.8% | Global, acute in Asia-Pacific and North America | Medium term (2-4 years) |
| Premiumization and clean-label or organic demand | +1.5% | North America, Europe, Asia-Pacific urban centers | Long term (≥ 4 years) |
| Ingredient science innovation and premium pricing power | +1.3% | Global, led by EU and North America R&D hubs | Medium term (2-4 years) |
| Omnichannel and cross-border e-commerce expansion | +1.4% | Asia-Pacific core, spillover to MEA and South America | Short term (≤ 2 years) |
| Rising goat or alternative milk and hypoallergenic options | +0.7% | Global, notably North America, Europe, Middle East | Medium term (2-4 years) |
| Specialty medical nutrition adoption | +0.6% | North America, EU, high-income Asia | Long term (≥ 4 years) |
| Source: Mordor Intelligence | |||


Rising Female Workforce Participation and Dual-Income Households Increasing Reliance On Formula and Convenient Complementary Foods
Women’s labor-force engagement is high in many markets, while protections for paid leave and workplace breastfeeding support remain inconsistent, which raises daily-time constraints for caregivers and contributes to demand for formula and convenient complementary foods.[1]Constance Ching, Tuan T Nguyen, Catherine Pereira-Kotze, Paul Zambrano, Phillip Baker, and Roger Mathisen, “Implementation of the International Code of Marketing of Breast-milk Substitutes and maternity protection: correlations with commercial milk formula consumption in East Asia and the Pacific,” Frontiers in Pediatrics, pmc.ncbi.nlm.nih.gov In Mexico, value growth projections through the forecast horizon highlight the role of parents returning to workplaces and the appeal of ready-to-serve products for on-the-go feeding, which sustains category momentum within the infant nutrition market. In Canada, immigration-supported population gains and a preference for organic prepared foods have lifted demand for products aligned to dual-income lifestyles.[2]Agriculture and Agri-Food Canada, “Customized Report Service – Baby Food Trends in Canada, United States, Mexico (CUSMA),” Government of Canada, agriculture.canada.ca Product innovation that reduces preparation time and simplifies portion control connects with working parents who seek reliable nutrition without additional household labor, an effect that has reinforced brand switching toward convenient formats in the infant nutrition market. The combined effect is a sustained mix shift toward higher-convenience products that carry a modest premium, which helps offset unit-volume pressure in mature markets.
Premiumization And Clean-Label or Organic Demand Expanding Value Growth
Parents are prioritizing verified quality signals and ingredient transparency, and new regulations are reinforcing this direction by codifying testing and disclosure practices. California’s AB-899 requires heavy-metal testing disclosures for lead, arsenic, cadmium, and mercury, which has pushed brands to tighten raw material sourcing and reformulate to stay ahead of scrutiny. Major brands have responded with third-party certifications and portfolio cleanups, with Gerber citing more than 100 Clean Label Project certifications across its range, a position that builds trust among caregivers who associate seals and published standards with safety. New premium entries are anchoring position with dual certifications and staged formulations, as seen in Happy Family Organics’ USDA and EU-certified European-made formula with a proprietary prebiotic and probiotic system, positioned at a premium price point to reflect its formulation and sourcing.[3]Happy Family Organics, “Happy Family Organics Introduces NEW Happy Baby Infant Formulas, the First and Only USDA & EU-Certified Organic Formulas Made in Europe,” PR Newswire, prnewswire.comConsumers across parts of Central and Eastern Europe show a willingness to import organic baby foods from other EU markets when local availability is limited, reinforcing how premiumization can be demand-led where safety and selection are perceived as stronger abroad. These behaviors expand value even if volumes are flat, which has become a central dynamic of the infant nutrition market.
Ingredient Science Innovation Enabling Premium Differentiation And Pricing Power
Manufacturers are closing the compositional gap with human milk by advancing functional biomimetics such as HMOs and specific probiotics, which underpin premium claims. Analytical work using NMR metabolomics has documented shifts in HMO inclusion over time and by age stage, including the addition of 2′-fucosyllactose in new batches, while highlighting how age-specific profiles can track evolving needs across infancy and toddlerhood. Regulators are moving in parallel, as Taiwan’s draft rules in late 2025 would permit 2′-fucosyllactose and difucosyllactose in formulas for children up to age seven, setting maximum levels that give manufacturers a defined path to adopt HMO technologies across more products. Clinical positioning around alternative proteins continues to strengthen, with data indicating goat-milk-based formula may reduce sensitivities compared with cow-milk options, which is a tangible benefit that supports premium pricing and targeted labeling in the infant nutrition market. As validated nutrition science differentiates products, brands are channeling R&D investments into repeatable claims that resonate with pediatric guidance and caregiver priorities. This reallocation supports price realization and loyalty, since science-backed features create durable moats that are harder for low-cost replicas to match.
Omnichannel Expansion and Cross-Border E-Commerce Improving Access And Affordability
Digital channels are changing product discovery and purchase frequency, with online environments enabling precise targeting and flexible fulfillment models that support how parents shop today. Research shows the rise of online marketing tactics that reach parents directly in digital spaces, which has supported faster adoption cycles for new formulas and complementary foods in the infant nutrition market. Festival events and platform promotions have created spikes in omnichannel gross merchandise value for leading brands, showing how concentrated campaigns move demand across borders and store formats. Social commerce and creator-led content have been used to translate engagement into sales velocity, as category leaders test product messages and bundle offers through high-traffic events and lifestyle communities. The 2022 supply disruption exposed transparency gaps in inventory flows, a finding later documented by a National Academies review, which has since encouraged brands and retailers to strengthen visibility and contingency planning for time-sensitive categories. Regulatory flexibility also allowed select entrants to scale, as FDA enforcement discretion to increase supplies opened a path for brands to expand distribution while formal approvals progressed, an instance of policy enabling industry resilience.
Restraints Impact Analysis*
| Restraint | (~) % Impact on CAGR Forecast | Geographic Relevance | Impact Timeline |
|---|---|---|---|
| Falling birth rates limiting volumes | -1.2% | Global, acute in China, Japan, South Korea, Southern Europe | Long term (≥ 4 years) |
| Stricter marketing rules reduce promotion | -0.9% | Global, led by WHO member states implementing digital rules | Medium term (2-4 years) |
| Safety issues or recalls hurting trust | -0.7% | North America, sporadic global impact | Short term (≤ 2 years) |
| Tougher standards and re-registration increasing costs | -0.6% | North America, EU, China | Medium term (2-4 years) |
| Source: Mordor Intelligence | |||
Falling Birth Rates Limiting Volumes
Birth-rate declines in several large economies reduce the pool of new consumers, which creates persistent volume headwinds for the infant nutrition market. This demographic pattern is most acute in parts of East Asia and Southern Europe, where fertility rates remain low despite policy responses that aim to support families. Companies are adapting by expanding into adjacent life stages such as maternal nutrition and toddler milks, as well as exploring adult nutrition lines that extend household lifetime value. Premiumization helps offset the volume drag, since parents who remain in the category are trading up to products with validated science and quality labels. The net effect is a shift in growth mix toward value expansion and geographic diversification rather than broad-based volume gains.
Stricter Marketing Rules Reduce Promotion
Member states endorsed stronger action against digital promotion of breast-milk substitutes in 2025, including the development of AI tools to monitor compliance online, which is reshaping how brands communicate with parents. Evidence linking weaker maternity protections and high exposure to commercial messaging with increased formula use has encouraged regulators to close policy gaps and align with the International Code of Marketing of Breast-milk Substitutes. Many markets still rely on partial or voluntary measures, which creates uneven enforcement and gray areas in omnichannel advertising that brands must navigate carefully. Companies are shifting spending to healthcare-professional education, clinical trials, and product development, a reallocation that supports credibility while reducing consumer-facing promotions. Corporate compliance reporting has documented allegations tied to unauthorized third-party offers, underscoring how complex retail ecosystems can complicate adherence without continuous monitoring.
*Our forecasts treat driver/restraint impacts as directional, not additive. The impact forecasts reflect baseline growth, mix effects, and variable interactions.
Segment Analysis
By Product Category: Formula Anchors, Prepared Foods Surge
Infant formula held 54.24% of 2025 value, while prepared baby food is projected to expand at a 9.12% CAGR through 2031, signaling a steady mix shift within the infant nutrition market. Formula remains entrenched as a breast-milk substitute in medically indicated use and among working caregivers who value predictability and time savings. The powder segment’s cost-per-serving advantage sustains baseline demand even as the prepared category draws share on convenience features. In Canada, category trends show steady growth for prepared options where organic claims and texture variety align with modern feeding routines, reinforcing the pull toward convenience that is evident in the infant nutrition market. Fortified cereals continue to serve as a vehicle to address nutrient gaps during the 6-12 month window, and proposals to standardize iron levels in cereal would anchor consistent quality across brands.
Prepared foods stand out for portability, portion control, and flavor variety that ease the daily burden on dual-income households in the infant nutrition market. Packaging and labeling are part of the equation, with research documenting the increased use of health messaging and images of whole foods in retail promotions for infants and toddlers, which shapes perception even when claims are limited by policy. Specialty sub-segments such as goat-milk formula continue to widen caregiver choice, with clinical data indicating lower sensitivities for infants on goat-milk powder compared with cow-milk alternatives, a result that supports digestive-comfort positioning and targeted usage under pediatric guidance. The infant nutrition industry is therefore balancing the search for value with structural time constraints at home, which keeps both formula and ready-to-eat options central to category growth. Continued reformulation for contaminants compliance and steady progress on clean-label standards should sustain premium pricing in both pillars of the category.


By Age Group: Toddler Milks Outpace Infant Stages
The 0-6 months segment captured 39.41% of 2025 value and remains the anchor of demand due to exclusive feeding norms and higher clinical oversight, which concentrates prescription and recommendation influence in this window of the infant nutrition market share. Brands rely on Stage 1’s clinical rigor to build credibility that flows into later stages, since many caregivers maintain loyalty after successful early experiences. The 6-12 months window marks the start of complementary feeding, and proposals to include specific micronutrients in infant cereals reflect regulators’ focus on known deficiency risks during this period. The toddler segment stands out as a growth engine with an 8.34% projected CAGR, supported by functional claims that reassure parents about dietary adequacy as children shift to family foods. The infant nutrition market benefits when brands can translate early-stage trust into a lifecycle approach that aligns feeding to evolving nutrient needs.
Formulas for older infants and toddlers are leveraging ingredient science to tailor profiles to activity and cognitive development, with metabolomic work underscoring differences in amino acids and sugars across age stages. Branded solutions in Southeast Asia and other high-growth regions continue to emphasize microbiome and digestion benefits, as seen with new-stage launches across ASEAN in 2025, which reinforced the role of clinical features in capturing caregiver attention. In Japan, brand franchises that highlight decades of R&D and clinical validation maintain high awareness and professional endorsement, reinforcing parent confidence in stage-based formulas for children who are transitioning diets. The infant nutrition market will continue to rely on transparent stage definitions and trial-backed claims to stand out as choice expands.
By Formula Form: Ready-to-Feed Gains on Convenience Imperative
Powder commanded 68.11% of 2025 formula value due to affordability and shelf-stability, while ready-to-feed formats are set to grow at a 10.03% CAGR as convenience and sterile preparation needs broaden use cases in the infant nutrition market. Hospitals and NICU settings value ready-to-feed because it removes mixing error and supports stringent hygiene protocols, which filters into caregiver preferences after discharge. Powder remains entrenched in value-focused markets and among households that prioritize cost-per-serving, but ready-to-feed resonates with urban parents who trade price for time. The infant nutrition market size for ready-to-feed is thus supported by both clinical adoption and at-home convenience, making it a durable growth vector alongside powder.
Supply shocks since 2022, and the behaviors they triggered, have also nudged some parents toward formats perceived as more reliable under stress, including shelf-stable ready-to-feed that bypasses dilution and mixing uncertainty. Policymakers have focused on harmonizing form-agnostic nutrient and energy-density guidelines so that safe preparation and consistent intake are supported regardless of the format. Powder will retain its dominant baseline as producers improve scoop, storage, and mixing cues to reduce errors. Ready-to-feed will continue to gain in high-income urban centers where the convenience premium and sterile assurance matter most. These contrasts show why modular production and regional format flexibility can protect margins across cycles in the infant nutrition market.
By Nature: Organic Captures Premiumization Wave
Conventional products retained 62.32% of 2025 value as affordability and institutional programs keep price-sensitive buyers in mainstream offerings. Organic products are projected to expand at a 9.25% CAGR, supported by certification-based trust, ingredient restrictions, and the perception of superior oversight across farms and factories in the infant nutrition market. Parents who cannot trade up fully still look for clean-label indicators and fewer additives, which has created a middle option between conventional and certified-organic. In Europe, cross-border sourcing of organic baby foods has grown where local options are limited or more expensive, and import patterns illustrate how parents seek out perceived safety and quality across the single market.
Premium launches are raising the bar for category expectations, including dual USDA and EU certifications and staged formulations paired with patented prebiotic or probiotic systems, which support higher average selling prices in the infant nutrition market. Retail promotion studies show how health and natural imagery influence caregiver perceptions at the shelf, a dynamic that can guide packaging and claim strategies under evolving regulations. Compliance frameworks from USDA and EU organic standards act as practical constraints on ingredient sourcing and processing methods that smaller brands must plan for. The infant nutrition industry is likely to keep seeing tiered competition, with conventional brands capturing volume, clean-label lines appealing to value-minded upgraders, and organic leaders concentrating premium value.
By Distribution Channel: E-Commerce Disrupts Brick-and-Mortar Hegemony
Supermarkets and hypermarkets held 37.24% of 2025 sales, reflecting entrenched shopper routines and the advantage of store adjacency for household staples in the infant nutrition market. Online retail channels are projected to expand at an 11.63% CAGR as subscriptions, direct-to-consumer replenishment, and cross-border access reshape category purchase patterns. Research into online marketing shows how digital targeting reaches caregivers repeatedly across platforms, which reduces search costs and speeds up trial for new products. Major brand events during high-traffic shopping festivals show that omnichannel activations can drive sharp short-term lifts, reinforcing the role of platform partnerships in growth plans.
Pharmacies and specialty stores continue to matter for hypoallergenic and therapeutic formulas that often require pharmacist engagement, yet even these are joining online dispensing via telehealth and e-pharmacy integrations. Enforcement discretion measures taken to stabilize supplies in recent years opened the door for new entrants to reach more families through online channels while building toward full regulatory status, a step that widened product choice and sped up innovation cycles in the infant nutrition market. The infant nutrition market share for brick-and-mortar will remain sizable due to grocery missions and basket-building habits. At the same time, data-driven targeting online is likely to capture a growing share of replenishment because it removes friction, remembers preferences, and ensures timely delivery.
Geography Analysis
Asia-Pacific accounts for 42.65% of 2025 value and is pacing global expansion at a 9.24% CAGR through 2030, which underscores the region’s central role in demand formation for the infant nutrition market. Urbanization and rising incomes in large countries are reinforcing premium and clean-label preferences as caregivers balance work and family needs. Regulatory updates are guiding product formulations and permissible claims, as seen in Taiwan’s draft rules on HMOs that would enable wider adoption of advanced ingredients across the early-childhood portfolio. Brand launches across ASEAN have emphasized microbiome and digestive support to stand out in crowded shelves, with stage-appropriate positioning aligned to local clinical practice. As cross-border platforms increase access to international formulas and baby foods, brands must manage Code compliance while meeting high expectations on ingredient transparency and testing. The infant nutrition market in Asia-Pacific remains the anchor of global value growth, with omnichannel ecosystems amplifying awareness and speeding adoption of new science-led features.
North America represents a mature but resilient demand base for the infant nutrition market, supported by population inflows and steady consumer interest in clean-label and organic products. Consolidation remains a feature of the region, where the top three players control a large share of retail value, and WIC contracting shapes competitive dynamics in formula across states. The policy environment retains a central role in supply stability and market entry, with enforcement discretion programs helping expand product access during tight supply periods while formal approvals progress, a pathway that enabled several brands to scale and build clinical programs. Lessons from recent disruptions prompted a system-wide focus on data visibility, quality assurance, and contingency planning, which has become a core expectation of retailers and agencies that serve families. Canada’s regulatory modernization effort on infant foods and special dietary uses similarly signals a shift toward harmonized and evidence-based compositional standards that support both safety and innovation.
Europe remains a center of premium and organic adoption in the infant nutrition market, with layered certifications and strict compositional rules shaping portfolios. EU and USDA dual-certified offerings have grown in visibility, and parents in some Central and Eastern European markets are sourcing organic imports to access preferred choices and formats. National regulators continue to refine labeling and marketing oversight across age stages, and companies are steering investments toward clinical validation and nutritional science to strengthen differentiation. Established brands with long-standing pediatric endorsements maintain share through trust and rigorous quality controls, while new entrants use clean-label and gentle-on-the-gut narratives to gain footholds. Cross-border e-commerce within the EU supports product diversity and helps families access specific formulas and baby foods that are not always stocked locally. Over the medium term, premiumization and stage expansion will be the main levers to balance demographic pressures in parts of the region’s consumer base.
Mordor Intelligence provides coverage of the infant nutrition market across other key regional markets. Detailed country-level analysis extends to Indonesia incorporating local coverage and market participation, as required.

Regulatory Landscape
Infant nutrition regulation is anchored in strict compositional and safety baselines, with tightening requirements for specialty formulations and marketing conduct. In the United States, the FDA regulates infant formula under 21 CFR Part 107, covering 30 required nutrients, while also raising expectations around contaminant prevention and controls across manufacturing and supply chains.
Internationally, Codex Alimentarius (CXS 72-1981) and the Codex General Standard for Food Additives (GSFA, including category 13.1.1) are used as widely referenced benchmarks for safety, composition, labeling, and permitted additives. This framework supports cross-border trade and helps align national standards. In Europe, Commission Delegated Regulation (EU) 2016/127 governs compositional rules for infant and follow-on formula, and recent delegated acts have updated annexes for formulas made from protein hydrolysates. Commission Delegated Regulation (EU) 2025/2017 (adopted 8 October 2025) added a new set of protein-related requirements (group E), followed by Commission Delegated Regulation (EU) 2026/743 (adopted 30 March 2026) introducing an additional protein-related requirements pathway (group F). For manufacturers, the practical implication is continued focus on regulatory readiness, especially for hypoallergenic and hydrolysate-based portfolios that depend on precisely defined compositional criteria and supporting evidence.
Competitive Landscape
The infant nutrition market reflects a blend of consolidation and emergent competition, with incumbents leveraging scale in R&D, manufacturing, and regulatory compliance while challengers use digital channels and targeted claims to win share. The top three producers hold large shares across core developed markets, supported by pediatrician recommendations and long-standing clinical investments. Newer entrants compete on clean-label purity, ingredient transparency, and science-forward messaging, supported by direct-to-consumer models that drive replenishment and loyalty. Premium launches built around dual certifications and proprietary prebiotic or probiotic systems have expanded choice and reset expectations for premium pricing in the United States and Europe. Clinical narratives around digestive comfort and allergy management, including goat-milk-based options, provide distinct positioning where sensitivities are a concern, which is central to capturing high-value segments.
Strategic portfolio moves are shaping the competitive map. Reckitt identified Mead Johnson Nutrition as non-core in 2025 while committing to preserve the Enfamil brand’s clinical and professional equity as it simplifies the larger group for growth. Companies are also retooling manufacturing networks and advancing quality systems to meet evolving standards and inspection expectations, investments that weigh on near-term margins but protect market access over time. In Asia, organizational consolidation has been used to streamline operations and unlock synergies, as seen in Nestlé China aligning infant and Wyeth nutrition businesses in early 2026 to respond to shifting category dynamics.
Distribution strategy has become a key differentiator as brands juggle Code compliance, platform rules, and omnichannel economics in the infant nutrition market. Enforcement discretion actions since 2022 helped accelerate entry for brands that could meet safety and nutrition criteria, a bridge that also allowed firms to gather real-world data and scale manufacturing ahead of full approvals. Marketing oversight is tightening for digital channels, which redirects spending to clinician education and peer-reviewed trials that can sustain claims and pricing in competitive shelves. Over the next planning cycle, the most defensible positions will pair validated science with reliable supply and a balanced channel mix that reaches parents without running afoul of emerging rules.
Infant Nutrition Industry Leaders
Nestlé S.A.
Danone S.A.
Reckitt Benckiser
China Feihe Ltd.
Abbott Laboratories
- *Disclaimer: Major Players sorted in no particular order

Market Opportunities and Future Outlook
Innovation whitespace is forming around breast-milk-inspired functional ingredients and new production platforms that can support premium differentiation while meeting increasingly detailed regulatory scrutiny. A clear signal is Nestle's June 2026 partnership with Helaina to advance bioactive proteins for early-life nutrition using precision fermentation. It highlights a route to add human-identical proteins to formula design rather than relying only on conventional dairy fractionation. This complements the market's existing push into advanced HMO and probiotic systems, and it concentrates opportunity on suppliers and brands that can deliver pharmaceutical-grade quality systems, validated clinical claims, and scalable manufacturing for sensitive bioactives.
Supply resilience and regional manufacturing footprints remain another concrete opportunity after recent category supply shocks and heightened oversight on contaminants and quality systems. Abbott's April 2026 completion of the acquisition of Synlait Milk's North Island assets, including the Pokeno manufacturing facility in New Zealand, shows continued investment aimed at securing capacity and reducing single-point exposure for infant and pediatric nutrition supply in Pacific Asia. At the same time, expansion of omnichannel and cross-border e-commerce rewards companies that can combine compliant digital commercialization with traceability and rapid replenishment, particularly in Asia-Pacific where demand concentration and platform-driven discovery can amplify returns on region-ready portfolios.
Recent Industry Developments
- June 2026: Nestle partnered with biotechnology firm Helaina to study and advance bioactive proteins for early-life nutrition, leveraging precision fermentation capabilities. The collaboration links product development with a stronger push toward breast-milk-inspired formulations beyond standard dairy fractions. It also increases competitive pressure on incumbent and emerging brands to secure differentiated bioactives with scalable, quality-controlled supply.
- June 2025: Nestle expanded its NAN Sinergity infant formula across Europe, Latin America, and the Middle East, backed by an expanded clinical program and stronger manufacturing validation for multi-HMO and probiotic systems. The broadened scope indicates a shift toward premium gut-health positioning and evidence-driven claims in key growth markets.
- August 2024: Abbott expanded its Pure Bliss by Similac range in the United States to include European-made options and USDA-certified organic liquid infant formula. The expansion strengthens organic credentials and supports cross-border sourcing narratives for premium retail positioning.


Research Methodology Framework and Report Scope
Market Definition and Coverage
For this study, the infant nutrition market is defined as sales of commercially packaged nutrition products intended for infants and young children, covering breast milk substitute formulas and packaged baby foods consumed up to 36 months, across all retail and institutional channels.
Scope exclusions: We exclude homemade complementary foods, toddler beverages positioned for ages above three years, and disease-specific enteral feeds meant for older pediatric cohorts.
Segmentation Overview
- By Product Category
- Infant Formula
- Baby Cereals (Dried)
- Prepared Baby Food
- By Age Group
- 0–6 months (Stage 1)
- 6–12 months (Stage 2)
- 12–36 months (Toddler/Growing‑up Milks & Foods)
- By Formula Form
- Powder
- Liquid Concentrate
- Ready‑to‑Feed (RTF)
- By Nature
- Conventional
- Organic
- Clean‑label/No added sugars & additives
- By Distribution Channel
- Supermarkets/Hypermarkets
- Pharmacies/Medical Stores
- Specialty Mom & Baby Stores
- Online & Direct‑to‑Consumer
- Convenience & Grocery Stores
- By Geography
- North America
- United States
- Canada
- Mexico
- Europe
- Germany
- France
- United Kingdom
- Italy
- Spain
- Rest of Europe
- Asia-Pacific
- China
- Japan
- India
- South Korea
- Australia
- Rest of Asia-Pacific
- Middle East & Africa
- GCC
- South Africa
- Rest of Middle East & Africa
- South America
- Brazil
- Argentina
- Rest of South America
- North America
Data Sources, Market Sizing, and Validation
Desk Research
Desk work starts with building the demand and supply context, so we can set sensible volume and pricing boundaries before modeling. We refer to public sources such as UNICEF and WHO infant-feeding guidance, national vital statistics offices for births and age-cohort counts, and World Bank indicators for income and urbanization patterns.
To tighten the model, we also review sources such as UN Comtrade trade data for dairy and baby food related flows, government food safety and labeling rules, and peer-reviewed nutrition journals that explain ingredient standards and stage-based feeding needs. Company annual reports, investor presentations, and credible press releases are used to confirm portfolio mix shifts, such as powdered versus ready-to-feed, and channel expansion. Where needed, a paid subscription is used for company financials, patent checks, and shipment-level import-export spotting to validate directional moves. These examples are not exhaustive, and many other public materials were also reviewed for collection, cross-checking, and clarification.
Primary Interviews and Surveys
Primary interviews and surveys are used to pressure-test the desk assumptions around consumption by age, format mix, and how pricing moves across modern trade, pharmacy, and online. We speak with formula and baby food manufacturers, distributors, large retailers, pediatric nutrition experts, and regulatory or quality professionals across APAC, EMEA, and the Americas, so gaps in published data can be closed and final totals sense-checked against what stakeholders observe.
Distribution of primary research fieldwork respondents
| Company type | Respondent position | Region |
|---|---|---|
| Top tier: 36% | CXOs: 13% | APAC: 45% |
| Mid tier: 48% | Functional/Unit leaders: 32% | EMEA: 33% |
| Smaller Players: 16% | Managers: 55% | Americas: 22% |
Market-Sizing & Forecasting
Sizing is built with a top-down demand pool, where births and infant age cohorts are converted into treated users by feeding-pattern and product-penetration assumptions, followed by consumption rates and an average price per kg or per pack to reach value. Those totals are then corroborated with selective bottom-up approximations, such as rolling up sampled supplier revenues, checking channel mix through retailer conversations, and using price ladders by stage to see if the implied spend per child looks realistic.
Key inputs that influence the model include annual live births and infant population by region, formula penetration versus breastfeeding, average daily intake and pack size norms by stage, the split of powdered versus ready-to-feed formats, and the share of sales through modern retail, pharmacy, and online. Premiumization signals, such as organic and specialty mix, are tracked because they shift the average selling price even when volumes remain broadly stable. For forecasting, we typically use scenario analysis supported by short time series smoothing, where births, income, and channel shifts are varied within ranges agreed during expert discussions, and then the price curve is refreshed for inflation and mix. Where bottom-up references are incomplete for smaller markets, gaps are handled using proxy indicators like import dependence, urban household counts, and cross-country price bands before totals are reconciled.
Data Validation & Update Cycle
Outputs are checked against independent signals, including implied spend per infant, trade intensity for formula-related categories in import-reliant markets, and regional mix patterns that should align with known consumption behavior. Large variances trigger an analyst review step, where assumptions are re-run, outliers are flagged, and relevant interviewees are re-contacted to confirm what changed.
Before sign-off, the model, inputs, and calculations go through multi-step internal review so definitions stay consistent and arithmetic errors do not carry through. Reports are refreshed annually, and interim updates are made when material events occur, such as major regulation shifts, supply disruptions, or sharp pricing changes. Right before delivery, a final pass is performed so clients receive the most current view available.
Mordor Intelligence's Infant Nutrition Market Size Measured Against Other Published Estimates
It is normal to see different market sizes for infant nutrition because studies do not always count the same product boundaries, age limits, and pricing logic, even when they use similar labels. Differences also show up when one estimate is anchored to a different base year, or when currency conversion timing and inflation treatment are not aligned.
By tracking age-defined consumption rates, pack-weight conversion for powdered and ready-to-feed formats, and then refreshing price ladders with channel mix checks, Mordor Intelligence keeps the value build tied to infants up to 36 months and avoids spillover into older-child beverages or unrelated medical feeds.
Benchmark comparison
| Source | Market Size | Gaps in Research Methodology |
|---|---|---|
| Mordor Intelligence | USD 52.48 B (2026) | |
| Market Publisher A | USD 57.40 B (2025) | Uses an earlier anchor year and appears to apply a broader definition of infant nutrition across regions without clearly stating age cutoffs or how stage-based intake is converted into volumes, which can inflate totals when older-child items are blended in. |
| Industry Research Portal B | USD 52.30 B (2024) | Anchors the estimate to 2024 and focuses on a long-horizon projection, where price growth and mix upgrade assumptions can differ, especially if ready-to-feed and specialty shares are pushed faster than what channel feedback supports. |
Across the three values, the spread is mainly explained by anchor year choice and how strictly the scope is limited to infant and young-child products, rather than being a dispute about overall demand direction. When the inputs are kept traceable to births, penetration, consumption, and realistic price bands by format and channel, the final number stays easier to reproduce and update as conditions shift.


Key Questions Answered in the Report
What is the current size and growth outlook for the infant nutrition market?
The infant nutrition market size is USD 52.48 billion in 2026 and is forecast to reach USD 76.01 billion by 2031 at a 7.69% CAGR.
Which region leads demand in the infant nutrition market in 2026?
Asia-Pacific leads by value and expansion, holding 42.65% of 2025 value and advancing at a 9.24% regional CAGR through 2031, supported by urban lifestyles and rising incomes.
Which product types are growing fastest within the infant nutrition market?
Prepared baby food and ready-to-feed formats are growing fastest, supported by convenience and sterile preparation needs, with prepared baby food projected at a 9.12% CAGR and ready-to-feed at a 10.03% CAGR.
How is regulation shaping innovation and marketing practices?
New rules such as heavy-metal testing disclosures and HMO ingredient approvals are guiding formulations, while 2025 WHO actions on digital promotion push brands toward clinician education and clinical validation.
What are the main risk factors for the infant nutrition market?
Falling birth rates weigh on volumes, safety incidents can disrupt supply and trust, and evolving standards increase compliance costs, which together reshape growth strategies toward value and science-led differentiation.
How is e-commerce influencing the infant nutrition market?
Online targeting, subscriptions, and cross-border access are expanding reach and replenishment efficiency, while enforcement discretion programs have helped new entrants scale during supply tightness.
Page last updated on:


