Dielectric Material Market Size and Share
Market Overview
| Study Period | 2020 - 2031 |
|---|---|
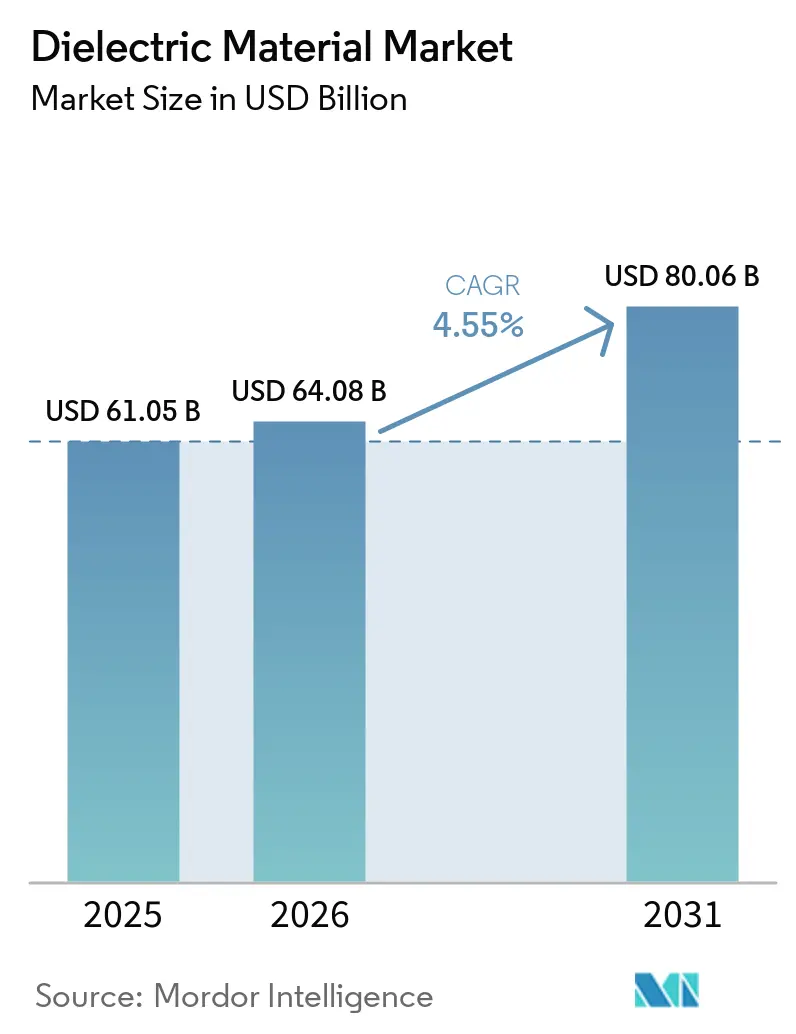
| Market Size (2026) | USD 64.08 Billion |
| Market Size (2031) | USD 80.06 Billion |
| Growth Rate (2026 - 2031) | 4.55% CAGR |
| Fastest Growing Market | Asia Pacific |
| Largest Market | North America |
| Market Concentration | Medium |
Major Players *Disclaimer: Major Players sorted in no particular order Image © Mordor Intelligence. Reuse requires attribution under CC BY 4.0. | |
Dielectric Material Market Analysis by Mordor Intelligence
The dielectric material market size is projected to be USD 61.05 billion in 2025, USD 64.08 billion in 2026, and reach USD 80.06 billion by 2031, growing at a CAGR of 4.55% from 2026 to 2031. Elevated demand for miniaturized, high-voltage components across 5G radios, electric-vehicle inverters, and renewable-energy converters is keeping capacity expansions on a tight schedule. Tighter board space in smartphones and foldable devices is accelerating the adoption of sub-0201 multilayer ceramic capacitors, while silicon-carbide power modules in 800-volt drivetrains are redirecting film-capacitor innovation toward thinner, higher-energy-density grades. Glass-ceramic dielectrics, once confined to niche aerospace markets, are gaining momentum in wind-turbine converters that cycle across severe temperature swings. Suppliers that control upstream barium-titanate powder or polypropylene film production are holding negotiating leverage as automakers and telecom OEMs secure multi-year allocations.
Key Report Takeaways
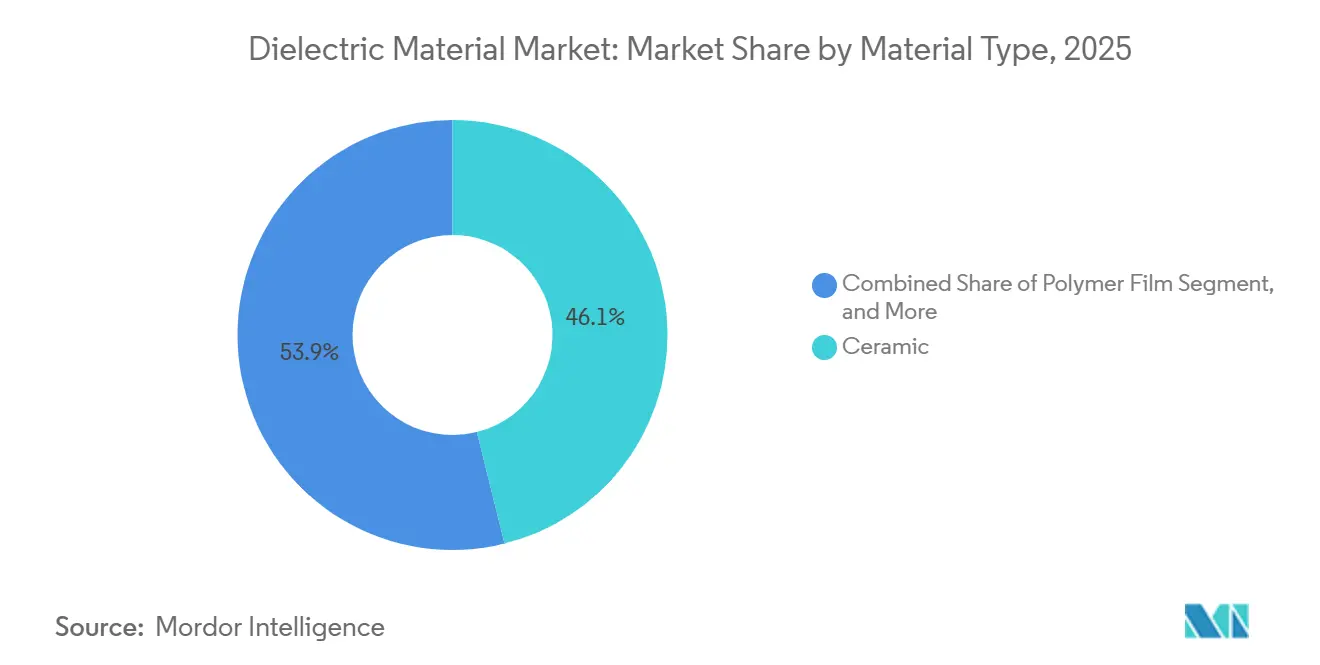
- By material type, ceramic dielectrics held 46.11% of the dielectric material market share in 2025, while glass and glass-ceramic grades are advancing at a 4.96% CAGR through 2031.
- By form factor, multilayer ceramic capacitor dielectrics captured 39.42% revenue in 2025; dielectric inks and pastes are forecast to expand at a 4.81% CAGR to 2031.
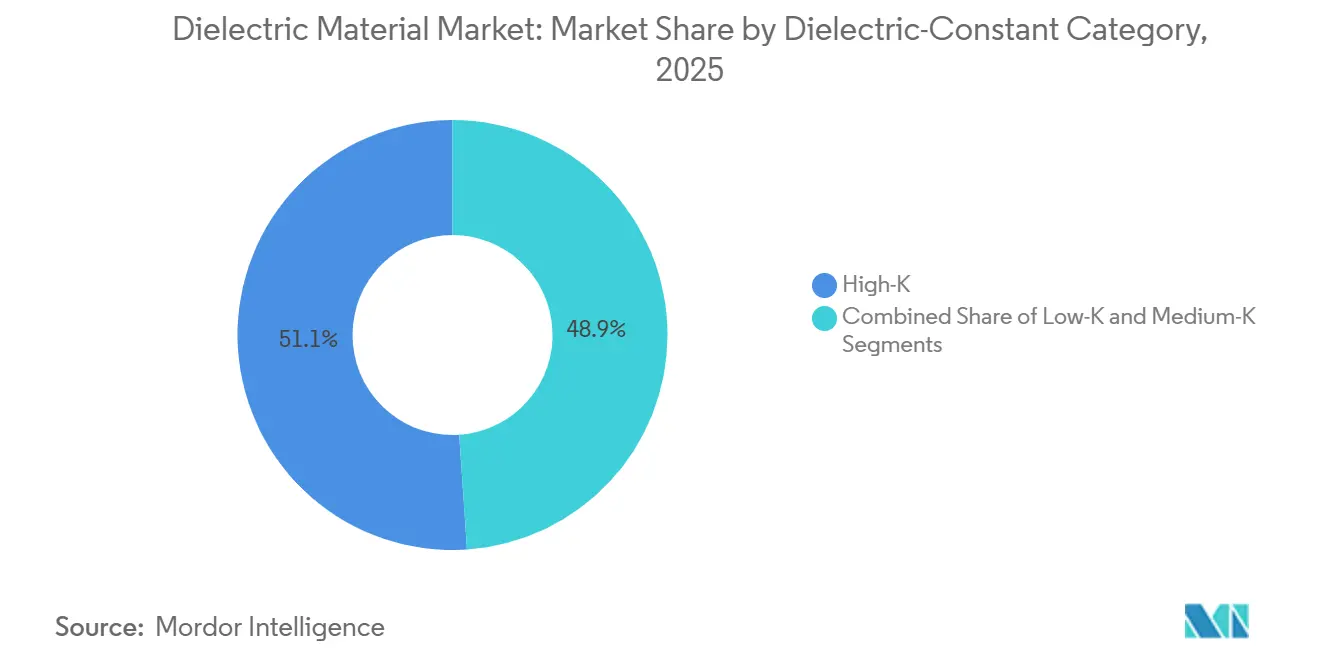
- By dielectric-constant category, high-K compositions commanded 51.07% of the dielectric material market size in 2025 and are growing at a 4.73% CAGR over 2026-2031.
- By application, passive electronic components led with a 37.87% share of the dielectric material market size in 2025, while printed and flexible electronics are set to rise at a 4.79% CAGR.
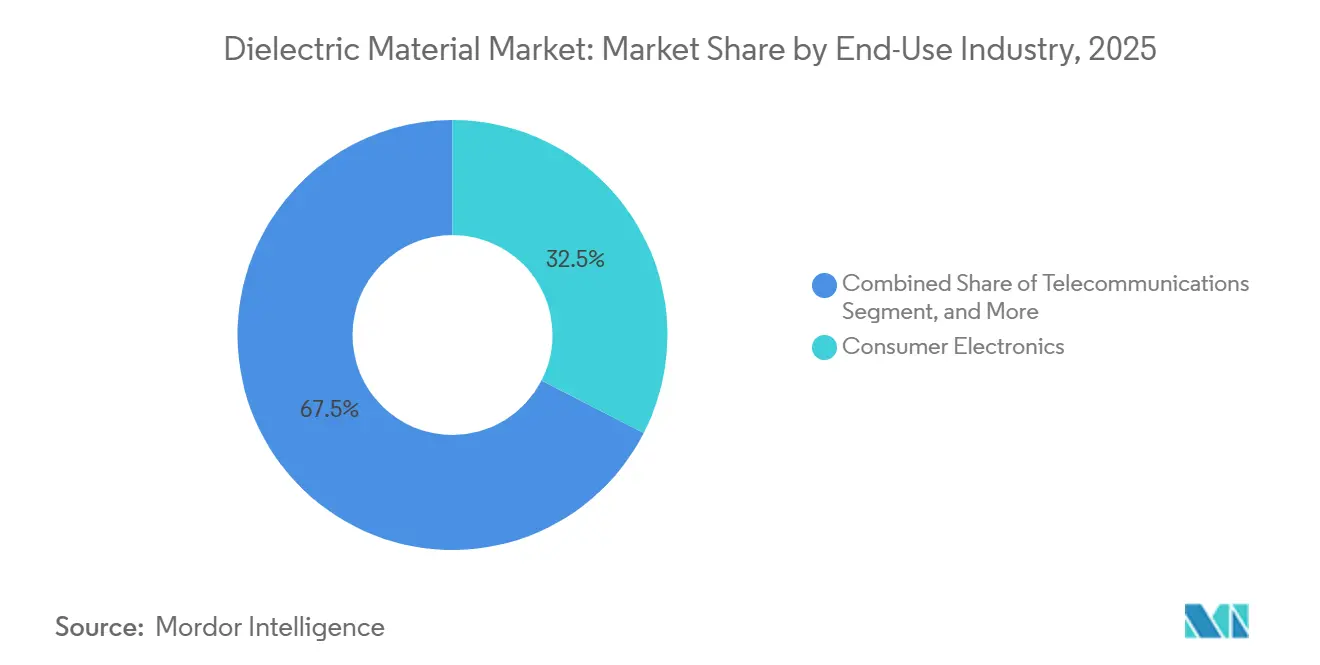
- By end-use industry, consumer electronics accounted for 32.54% of the dielectric material market in 2025; automotive and e-mobility applications are the fastest-growing, with a 5.31% CAGR.
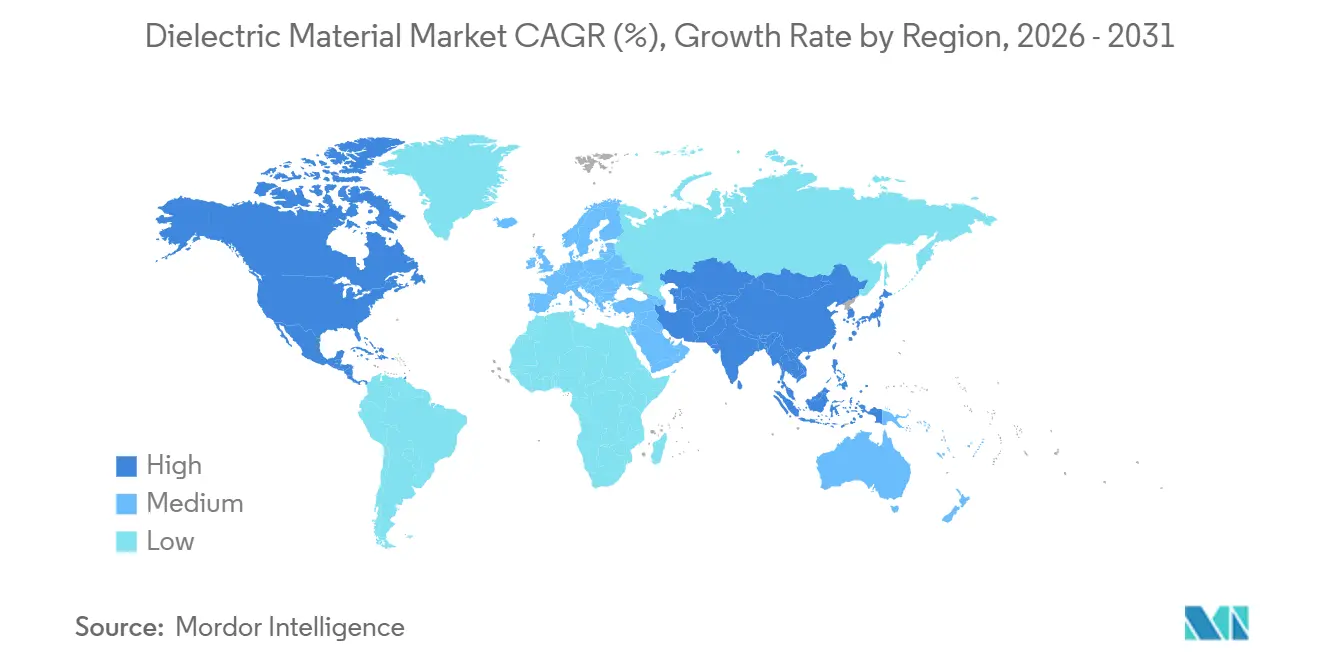
- By geography, Asia-Pacific controlled 47.67% of the dielectric material market share in 2025, outpacing all regions with a projected 5.22% CAGR to 2031.
Note: Market size and forecast figures in this report are generated using Mordor Intelligence’s proprietary estimation framework, updated with the latest available data and insights as of January 2026.
Global Dielectric Material Market Trends and Insights
Drivers Impact Analysis*
| Driver | (~) % Impact on CAGR Forecast | Geographic Relevance | Impact Timeline |
|---|---|---|---|
| Rapid Expansion of 5G and High-Frequency Communication Devices | +1.2% | Global, with early deployment in North America, South Korea, China | Medium term (2-4 years) |
| Proliferation of Electric Vehicles Boosting Demand for High-Energy Film Capacitors | +1.5% | Asia-Pacific, Europe, North America | Medium term (2-4 years) |
| Growth in Renewable Energy Installations Requiring High-Voltage Power Capacitors | +0.9% | Global, concentrated in Europe, China, United States | Long term (≥ 4 years) |
| Miniaturization Trend in Consumer Electronics Driving Ultra-Thin MLCC Dielectrics | +1.0% | Asia-Pacific manufacturing hubs, global consumer markets | Short term (≤ 2 years) |
| Emerging Use of Ferroelectric Hafnium-Oxide in Advanced Logic and Memory Chips | +0.3% | Taiwan, South Korea, United States semiconductor fabs | Long term (≥ 4 years) |
| Rising Adoption of Wireless-Charging Furniture with Embedded Dielectric Resonators | +0.1% | North America, Europe premium furniture markets | Long term (≥ 4 years) |
| Source: Mordor Intelligence | |||
Proliferation of Electric Vehicles Boosting Demand for High-Energy Film Capacitors
Electric-vehicle architectures moving to 800-volt batteries need film capacitors that store more than 5 J/cm³ at 900 Vdc without catastrophic failure at 105 °C. Metalized polypropylene winds enhanced with nano-aluminum electrodes meet these thresholds and self-heal after transient spikes, giving inverter makers confidence in 15-year warranties.[1]Panasonic Corporation, “Automotive Film Capacitor Technical Brief,” panasonic.com Silicon-carbide switches that toggle above 100 kHz increase harmonic stress, prompting multilayer polypropylene-polyethylene films to spread heat faster and shave 1.5 kg from inverter weight. Qualification cycles that run 1,000 thermal shocks and 2,000 h humidity aging now dominate launch schedules and tilt volume toward incumbents that can certify at scale. Automakers have responded with multi-year allocation contracts, locking in visibility into demand through the decade.
Rapid Expansion of 5G and High-Frequency Communication Devices
Millimeter-wave radios above 24 GHz impose loss-tangent limits below 0.002 on substrates, propelling low-temperature co-fired alumina-glass composites that condense filters and couplers into a single laminated block. Each macro-cell radio consumes hundreds of high-frequency capacitors, and with over 1 million 5G sites installed in China by 2025, volume pull-through is significant. Temperature-stable X7R stacks maintain ±15% capacitance from −55 °C to +125 °C, meeting the requirements of outdoor and automotive radios deployed on rooftops and roadway gantries. As operators pivot to standalone 5G core networks in 2026, edge servers require large banks of 100 A ripple-rated multilayer ceramic capacitors, a spec only a handful of suppliers can meet today.
Miniaturization Trend in Consumer Electronics Driving Ultra-Thin MLCC Dielectrics
Smartphone mainboards now host more than 1,000 capacitors in only 4 cm², forcing chips down to 0201 and below. Producers rely on 0.5 μm dielectric layers sintered at 1,250 °C and stack counts edging toward 1,000, yet must mitigate grain-boundary defects that trigger shorts. Nickel-barrier electrodes and reducing-atmosphere anneals curb oxygen-vacancy formation, extending mean time-to-failure in 3 nm application processors. Foldable phones add flex stress, so vendors introduced 0.25 mm-thick parts able to survive 10,000 bend cycles. The trajectory keeps the dielectric material market on a tight R&D cadence aligned with handset refresh cycles.
Growth in Renewable Energy Installations Requiring High-Voltage Power Capacitors
Utility-scale string inverters that handle 1,200 Vdc and 100 kW depend on polypropylene capacitors rated for 50 μF to smooth ripple and protect IGBTs from spikes. Offshore wind pitch-control electronics experience −40 °C to +85 °C swings, prompting the use of glass-ceramic composites with loss tangents below 0.001 to limit self-heating. After high-profile thermal runaway events in 2024, the International Electrotechnical Commission drafted new safety annexes that mandate thermal fuses in capacitor modules, raising bill-of-materials costs but restoring developer confidence. Glass-ceramic grades with near-zero thermal expansion are now penetrating silicon-carbide converter housings, reinforcing long-term demand.
Restraints Impact Analysis*
| Restraint | (~) % Impact on CAGR Forecast | Geographic Relevance | Impact Timeline |
|---|---|---|---|
| Volatile Prices and Limited Supply of Rare-Earth Elements for High-K Ceramics | -0.8% | Global, acute in Asia-Pacific ceramic production hubs | Medium term (2-4 years) |
| Stringent Environmental Rules on Fluorinated Polymer Dielectrics Disposal | -0.6% | Europe, North America, expanding to Asia-Pacific | Long term (≥ 4 years) |
| Reliability Issues of Additive-Manufactured Dielectric Inks | -0.2% | Global, concentrated in printed electronics R&D centers | Medium term (2-4 years) |
| Thermal-Runaway Concerns in Solid-State Capacitor Banks | -0.3% | Global, critical in grid-scale energy storage projects | Short term (≤ 2 years) |
| Source: Mordor Intelligence | |||
Volatile Prices and Limited Supply of Rare-Earth Elements for High-K Ceramics
Yttrium and lanthanum oxides swung 15-25% in price during 2024-2025 after export-quota moves in China, adding direct material inflation to X7R and X8R stacks. Japanese and South Korean producers resorted to six-month stockpiles, tying up working capital and slicing 200 bp off gross margins. Substitution with bismuth-sodium-titanate or potassium-sodium-niobate lowers permittivity by up to 30%, so layer counts creep upward, eroding miniaturization gains. Geopolitical risk has attracted U.S. Department of Energy funding for domestic separation plants, yet commercial volumes are unlikely before 2028, keeping the dielectric material market exposed in the mid-term.
Stringent Environmental Rules on Fluorinated Polymer Dielectrics Disposal
Proposed European Union restrictions on per- and polyfluoroalkyl substances may ban polytetrafluoroethylene and fluorinated ethylene propylene films by 2027, jeopardizing high-temperature capacitor lines for aerospace and oil-and-gas logging.[2]European Chemicals Agency, “PFAS Restriction Proposal,” echa.europa.eu The United States Environmental Protection Agency also labeled select fluorinated polymers as hazardous in 2024, triggering remediation liabilities. Alternative polyphenylene sulfide or polyetherimide films top out at 200 °C, short of the 260 °C ceiling required in downhole sensors, and add USD 0.02-0.05 per finished unit. Cost pressure is nudging OEMs toward ceramic dielectrics where voltage limits allow, dampening upside for fluoropolymer film suppliers.
*Our forecasts treat driver/restraint impacts as directional, not additive. The impact forecasts reflect baseline growth, mix effects, and variable interactions.
Segment Analysis
By Material Type: Ceramic Dominance Faces Glass-Ceramic Disruption
Ceramic grades secured 46.11% of the dielectric material market share in 2025 on the strength of barium-titanate systems that pack dielectric constants above 10,000, meeting X5R and X7R codes. Glass and glass-ceramic alternatives are growing at 4.96% through 2031 as power-electronics designers seek thermal-shock tolerance for −40 °C to +150 °C cycling. Polymer films hold a niche high-voltage territory, where self-healing prevents runaway failure in automotive and solar inverters. Mica and tantalum oxide remain specialized for aerospace radar and implantable devices, where lifetime reliability eclipses cost.
Advances in barium-strontium-titanate thin films support 5G tunable filters, while potassium-sodium-niobate piezoelectrics offer lead-free compliance but face 400 °C Curie points. Glass-ceramic substrates with lithium-aluminum-silicate phases are now being used in gallium-nitride HEMTs, offering near-zero expansion that reduces die stress. Polymer-film suppliers layer polypropylene with polyethylene naphthalate to lift thermal conductivity by 35%, giving the dielectric material market size a shot at durability for 15-year electric-vehicle lifetimes.


By Form Factor: MLCC Dielectrics Lead as Inks Accelerate
Multilayer ceramic capacitor stacks accounted for 39.42% of 2025 revenue, thanks to unmatched volumetric efficiency that smartphones, EVs, and industrial drives rely on. Dielectric inks and pastes, however, are sprinting at a 4.81% CAGR, promoted by roll-to-roll antenna and sensor printing on flexible PET. Thin- and thick-film coatings on alumina or AlN address hybrid microwave modules, while bulk sheets machined from sintered blocks stay relevant for traction drives and pulsed-power labs.
Ink formulations blending barium-titanate nanoparticles with silver flakes hit sheet resistances below 0.1 Ω/□, yet 900 °C sinter limits polymer substrates, so photonic flash sintering is the new frontier. Reliability lags MLCCs, with 15% drift after 500 thermal cycles, delaying automotive adoption. Bulk glass-ceramic plates still dominate medium-voltage vacuum interrupters, underlining how each form factor defends its sweet spot within the dielectric material market.
By Dielectric Constant Category: High-K Materials Sustain Leadership
High-K compositions accounted for 51.07% of the dielectric material market share in 2025 and are projected to grow at a 4.73% CAGR during the forecast period. This growth is primarily driven by the adoption of hafnium-oxide ferroelectrics in advanced 3 nm logic chips and DRAM cells, which require materials with high dielectric constants to enhance performance. Medium-K variants are widely utilized in package-embedded passives, as they offer a balance between adequate permittivity and mechanical robustness, making them suitable for various applications. Meanwhile, Low-K organosilicate glasses are critical for reducing crosstalk in GPU interconnects. However, these materials face challenges such as moisture uptake as pore sizes shrink below 2 nm, which could impact their long-term reliability.
Hafnium-zirconium-oxide films with thicknesses under 10 nm exhibit remnant polarization exceeding 20 µC/cm², enabling the development of logic-in-memory architectures that integrate processing and storage capabilities. Medium-K barium-strontium-titanate varactors are instrumental in creating reconfigurable RF filters, which reduce handset component counts by up to 40%, thereby improving device efficiency and compactness. On the other hand, ultra-high-K ceramics doped with niobium pentoxide achieve dielectric constants exceeding 15,000. However, these materials experience a temperature drift of ±15%, which limits their application to non-critical bypass roles where such variations are less impactful.
By Application: Passive Components Dominate While Printed Electronics Surge
Passive components controlled 37.87% of the dielectric material market size in 2025, reflecting universal reliance on capacitors for decoupling and filtering. Printed and flexible electronics grow at 4.79%, embedding transparent capacitors into rollable displays and automotive dashboards. Semiconductor gate dielectrics transition to high-K oxides for sub-3 nm nodes, while power-electronics insulation demands 30 kV/mm breakdown and 2 W/m·K thermal conductivity. RF substrates, built from low-loss ceramics, underpin phased-array antennas for 5G radios and automotive radar.
Decoupling MLCCs now integrates resistors and inductors, trimming discrete counts by 20%. Printed silver-nanowire electrodes achieve 85% transparency, enabling invisible touch consoles. Hafnium-oxide gate stacks reach equivalent oxide thickness below 0.5 nm, curbing leakage in gate-all-around FETs. AlN substrates replace alumina in gallium-nitride modules, dropping junction-to-case resistance 30% and illustrating cross-segment synergies steering the dielectric material market.
By End-Use Industry: Consumer Electronics Lead as Automotive Accelerates
Consumer electronics accounted for 32.54% of 2025 spending, with 1 trillion MLCCs shipped into smartphones, tablets, and laptops. Automotive and e-mobility demand is climbing at a 5.31% CAGR, fueled by electric-vehicle builds cresting 14 million units in 2025 and heading toward 30 million by 2030. Energy and power grids rely on film and ceramic capacitors that withstand 10,000 h at 105 °C, while telecom infrastructure uses low-loss laminates for 5G base stations. Aerospace, defense, and industrial automation specify military-grade temperature and radiation tolerance, keeping specialty lines profitable.
Foldable phones now house 1,200+ MLCCs each, 15% above rigid designs, underscoring handset influence. EV battery-management systems require AEC-Q200 compliance across −40 °C to +150 °C, which lifts qualification barriers. Solar inverter vendors target polypropylene parts with 100,000 h mean time between failures, and telecom operators shift to low-temperature co-fired modules that cut size and weight by 25%. Radar systems at X- and Ku-band require sapphire or ultra-pure alumina cores, where loss-tangent requirements are extreme.
Geography Analysis
Asia-Pacific retained 47.67% of the dielectric material market share in 2025 and is forecast to grow at a 5.22% CAGR through 2031. Japan and South Korea anchor multibillion-unit MLCC output, leveraging vertically integrated powder-to-placement lines capable of sub-0201 geometries at 10 billion units per month. China’s Fenghua Advanced Technology and Torch Electron are buying shares in consumer-grade segments by parlaying labor subsidies and provincial incentives, though they still lag automotive-grade quality metrics. India’s production-linked incentive program is attracting passive-component assembly from Taiwan-origin firms, helping cushion the impact of supply diversification.
Europe and North America combined for roughly 35% of revenue in 2025, led by Germany’s 800 V drivetrain projects and France’s offshore wind farms that specify glass-ceramic capacitors for 50-year turbine lives. Brussels-driven PFAS restrictions are accelerating film-to-ceramic substitution, while the United States CHIPS Act’s USD 52 billion outlay is pulling high-K dielectric volume into new Arizona and Texas fabs.[3]U.S. Department of Commerce, “CHIPS and Science Act Funding Announcement,” commerce.gov Canada’s rare-earth exploration in Saskatchewan and Quebec could temper dependence on yttrium post-2028, yet near-term supply remains Asia-centric.
Middle East and Africa, plus South Americ, a, accounted for the remaining 18% in 2025, driven by telecom densification and renewable-energy rollouts. Saudi Arabia’s NEOM city blueprint specifies low-loss ceramic nodes for pervasive 5G, and the United Arab Emirates’ 950 MW solar park relies on polypropylene capacitors in string inverters. South Africa’s EV shift is driving partnerships with regional distributors for AEC-Q200 passives, while Brazil’s 25 GW wind fleet is boosting demand for medium-voltage capacitors despite 15% import tariffs that favor local assembly. Argentina’s lithium boom is drawing battery-pack investments, creating downstream pull for dielectric materials in battery-management and charging gear.

Competitive Landscape
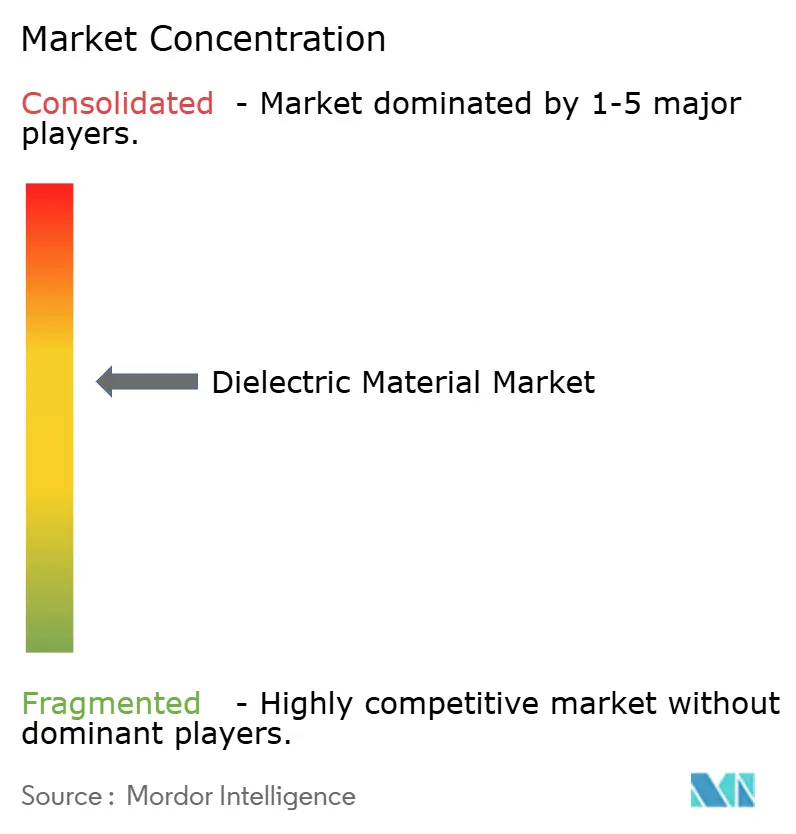
The dielectric material market is moderately concentrated, with leading players such as Murata Manufacturing, TDK, Samsung Electro-Mechanics, Taiyo Yuden, and Kyocera collectively accounting for approximately 55% of MLCC revenue in 2025. These companies leverage vertical integration, which allows them to control processes from powder synthesis to final placement. This capability enables the production of sub-0.5 µm layers and ensures 20 µm pick-and-place accuracy. Murata’s advancements, including its 1,000-layer 0201 prototypes and nickel-barrier electrodes, underscore its material innovation leadership. Additionally, automotive-grade AEC-Q200 requirements and the demand for 15-year warranties sustain a 30% price premium for certified product lines, creating a barrier to new Chinese entrants competing effectively in this space.
Patent filings indicate a shift toward hafnium-oxide ferroelectric stacks, with companies like Samsung Electronics and TSMC holding over 200 patents related to dopant chemistries and annealing processes.[4]IEEE Xplore, “High-Layer-Count MLCC Reliability Study,” ieeexplore.ieee.org Polymer-film manufacturers are increasingly automating winding and metallization processes to meet stringent automotive cost-reduction clauses, which typically demand a 3-5% annual price decrease. These manufacturers aim to protect their margins by improving process efficiencies. Meanwhile, glass-ceramic providers, led by SCHOTT, are focusing on silicon-carbide module applications where their near-zero thermal expansion properties justify a 50% pricing premium. This niche market is gaining traction as demand for high-performance materials in advanced applications continues to grow.
Emerging players in printed electronics are targeting low-voltage wearable devices, a segment with significant growth potential. However, these newcomers face challenges in overcoming reliability issues before they can scale production to meet market demands. While the wearable electronics market offers opportunities for innovation, achieving the necessary durability and performance standards remains a critical hurdle. Established players in the dielectric material market continue to dominate due to their advanced technologies, robust supply chains, and ability to meet stringent industry requirements, leaving limited room for smaller competitors to gain a foothold without significant technological breakthroughs.
Dielectric Material Industry Leaders
Murata Manufacturing Co., Ltd.
TDK Corporation
Taiyo Yuden Co., Ltd.
Yageo Corporation
Samsung Electro-Mechanics Co., Ltd.
- *Disclaimer: Major Players sorted in no particular order

Recent Industry Developments
- March 2026: Samsung Electro-Mechanics began commercial output at its second multilayer ceramic capacitor plant in Calamba, Philippines, adding 40 billion units of annual capacity targeted at automotive battery-management and ADAS modules.
- February 2026: TDK reported passive-component sales of JPY 523.4 billion (USD 3.5 billion) for the nine months ended Dec 2025 and will lift Akita Prefecture MLCC lines by 25% to clear backlogs into 2027.
- January 2026: Intel confirmed 18-angstrom process technology uses hafnium-zirconium-oxide ferroelectric gate dielectrics and invested USD 1.2 billion in atomic-layer-deposition tools at Arizona and Oregon fabs.
- December 2025: Murata earmarked JPY 47 billion (USD 314 million) to expand its Izumo City MLCC facility, lifting monthly output by 15 billion sub-0201 parts for foldable phones and automotive cameras.


Global Dielectric Material Market Report Scope
The Dielectric Material Market encompasses the global production, development, and commercialization of insulating materials that exhibit polarization under an electric field and are widely used in electronic and electrical systems. These materials play a critical role in energy storage, signal transmission, and insulation across a broad range of components and devices.
The Dielectric Material Market Report is Segmented by Material Type (Ceramic, Polymer Film, Glass and Glass-Ceramics, and Other Material Type), Form Factor (MLCC Dielectric, Thin/Thick Film Dielectric, Bulk Sheet/Plate, and Dielectric Ink and Paste), Dielectric Constant Category (Low-K, Medium-K, and High-K), Application (Passive Electronic Components, Semiconductor Gate Dielectric, Power Electronics Insulation, RF and Microwave Substrates, and Printed and Flexible Electronics), End-Use Industry (Consumer Electronics, Automotive and E-Mobility, Energy and Power, Telecommunications, Industrial and Manufacturing, and Aerospace and Defense), and Geography (North America, Europe, Asia-Pacific, Middle East, Africa, and South America). The Market Forecasts are Provided in Terms of Value (USD).
| Ceramic |
| Polymer Film |
| Glass and Glass-Ceramics |
| Other Material Type |
| Multilayer Ceramic Chip Capacitor (MLCC) Dielectric |
| Thin / Thick Film Dielectric |
| Bulk Sheet / Plate |
| Dielectric Ink and Paste |
| Low-K |
| Medium-K |
| High-K |
| Passive Electronic Components, Capacitors, Resonators |
| Semiconductor Gate Dielectric |
| Power Electronics Insulation |
| RF and Microwave Substrates |
| Printed and Flexible Electronics |
| Consumer Electronics |
| Automotive and E-Mobility |
| Energy and Power, Renewables, Grid |
| Telecommunications |
| Industrial and Manufacturing |
| Aerospace and Defense |
| North America | United States |
| Canada | |
| Mexico | |
| Europe | Germany |
| United Kingdom | |
| France | |
| Russia | |
| Rest of Europe | |
| Asia-Pacific | China |
| Japan | |
| India | |
| South Korea | |
| Australia | |
| Rest of Asia-Pacific | |
| Middle East | Saudi Arabia |
| United Arab Emirates | |
| Rest of Middle East | |
| Africa | South Africa |
| Egypt | |
| Rest of Africa | |
| South America | Brazil |
| Argentina | |
| Rest of South America |
| By Material Type | Ceramic | |
| Polymer Film | ||
| Glass and Glass-Ceramics | ||
| Other Material Type | ||
| By Form Factor | Multilayer Ceramic Chip Capacitor (MLCC) Dielectric | |
| Thin / Thick Film Dielectric | ||
| Bulk Sheet / Plate | ||
| Dielectric Ink and Paste | ||
| By Dielectric Constant Category | Low-K | |
| Medium-K | ||
| High-K | ||
| By Application | Passive Electronic Components, Capacitors, Resonators | |
| Semiconductor Gate Dielectric | ||
| Power Electronics Insulation | ||
| RF and Microwave Substrates | ||
| Printed and Flexible Electronics | ||
| By End-Use Industry | Consumer Electronics | |
| Automotive and E-Mobility | ||
| Energy and Power, Renewables, Grid | ||
| Telecommunications | ||
| Industrial and Manufacturing | ||
| Aerospace and Defense | ||
| By Geography | North America | United States |
| Canada | ||
| Mexico | ||
| Europe | Germany | |
| United Kingdom | ||
| France | ||
| Russia | ||
| Rest of Europe | ||
| Asia-Pacific | China | |
| Japan | ||
| India | ||
| South Korea | ||
| Australia | ||
| Rest of Asia-Pacific | ||
| Middle East | Saudi Arabia | |
| United Arab Emirates | ||
| Rest of Middle East | ||
| Africa | South Africa | |
| Egypt | ||
| Rest of Africa | ||
| South America | Brazil | |
| Argentina | ||
| Rest of South America | ||


Key Questions Answered in the Report
What is the expected value of the dielectric material market in 2031?
It is projected to reach USD 80.06 billion, rising from USD 64.08 billion in 2026.
Which region dominates demand for dielectric materials?
Asia-Pacific led with 47.67% share in 2025 and is forecast to grow fastest at 5.22% CAGR.
Why are electric-vehicle inverters important for dielectric growth?
800 V drivetrains need high-energy film capacitors rated 900 V or higher, lifting demand at a 5.31% CAGR in automotive applications.
Which material type holds the largest share today?
Ceramic dielectrics accounted for 46.11% of 2025 revenue due to high permittivity barium-titanate formulations.
How will PFAS regulations affect dielectric suppliers?
Proposed EU bans on PTFE and FEP films by 2027 could shift demand toward ceramic or PPS/PEI film alternatives.
What share do the top five MLCC makers hold?
Murata, TDK, Samsung Electro-Mechanics, Taiyo Yuden, and Kyocera together command about 55% of multilayer ceramic capacitor revenue.
Page last updated on:


