Passive Electronic Components Market Size and Share
Market Overview
| Study Period | 2020 - 2031 |
|---|---|
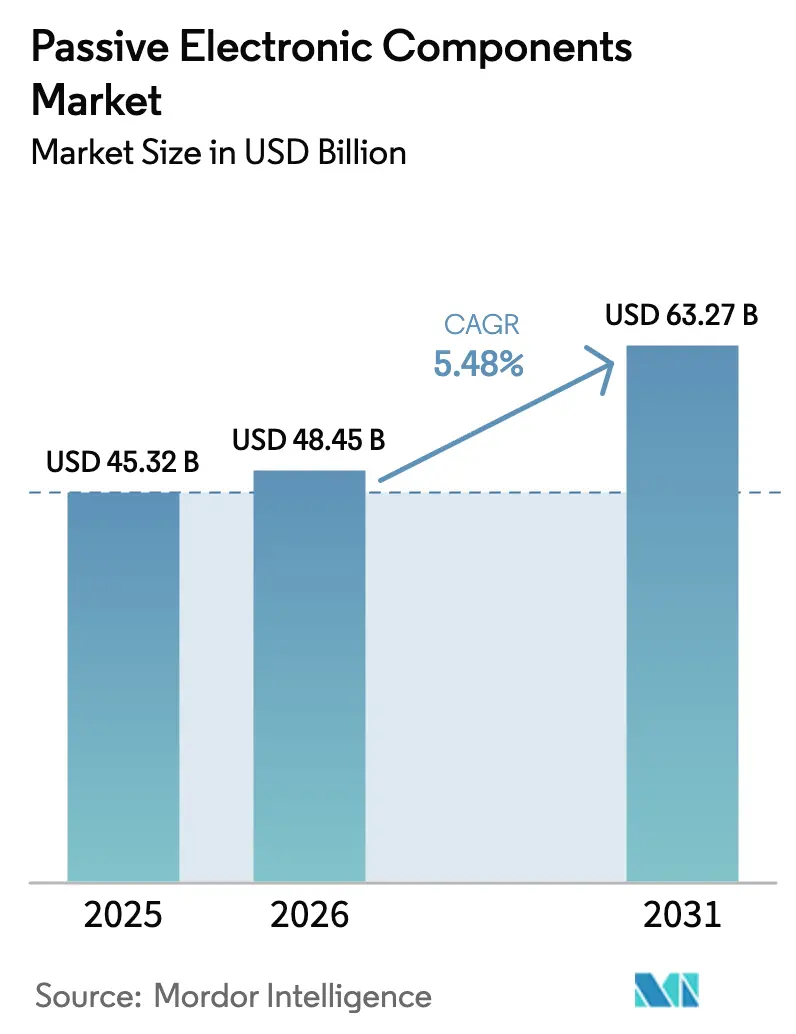
| Market Size (2026) | USD 48.45 Billion |
| Market Size (2031) | USD 63.27 Billion |
| Growth Rate (2026 - 2031) | 5.48% CAGR |
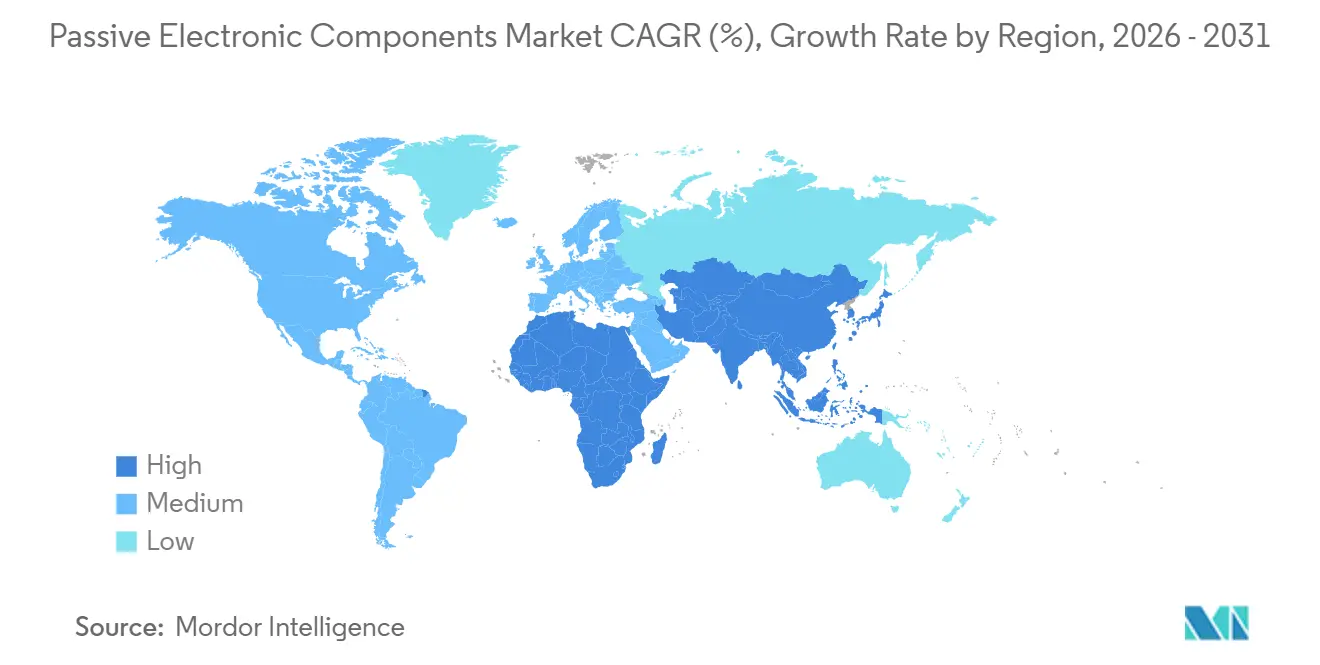
| Fastest Growing Market | Middle East |
| Largest Market | Asia-Pacific |
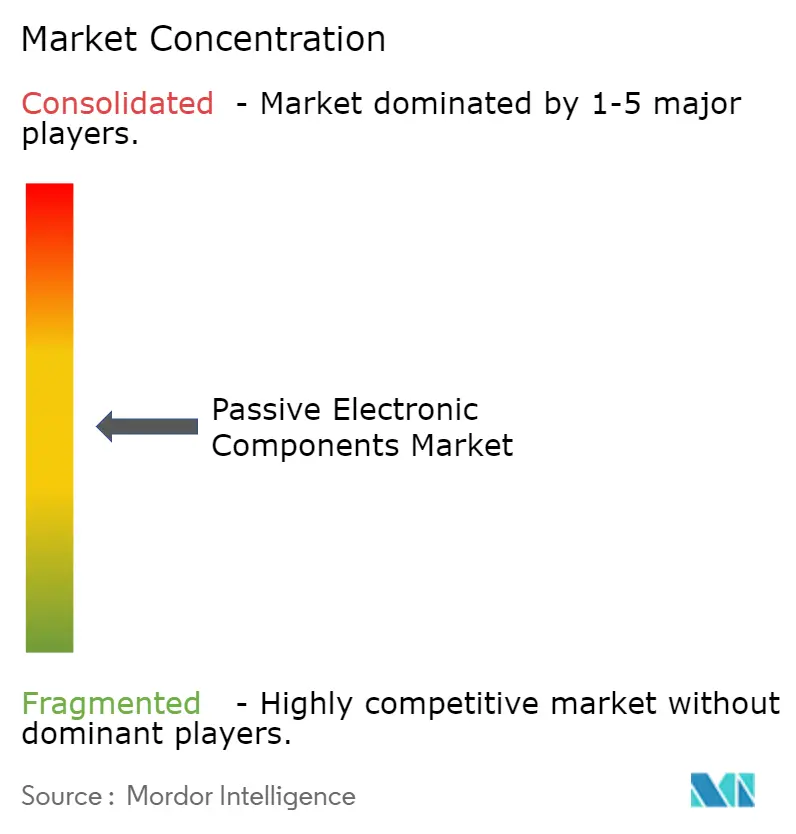
| Market Concentration | Medium |
Major Players *Disclaimer: Major Players sorted in no particular order Image © Mordor Intelligence. Reuse requires attribution under CC BY 4.0. | |
Passive Electronic Components Market Analysis by Mordor Intelligence
The passive electronic components market size was valued at USD 45.32 billion in 2025 and is estimated to grow from USD 48.45 billion in 2026 to reach USD 63.27 billion by 2031, at a CAGR of 5.48% during the forecast period (2026-2031). Expansion is led by electric-vehicle platforms that consume three to five times more capacitors, resistors, and inductors per unit than internal-combustion cars, while 5G and Wi-Fi 7 base-stations drive unprecedented demand for high-frequency filters. Equipment makers are embedding miniature passives in printed-circuit substrates to save board real estate, even as vertical integration into palladium and ruthenium supply dampens price shocks. Sovereign electronics programs in the Middle East, India, and Southeast Asia are regionalizing production, lowering logistics risk, and improving resiliency. Competitive focus has accordingly shifted from price wars to technology leadership, with leading suppliers patenting dielectrics that survive 260°C lead-free solder processes and integrating passives inside power-module packages for silicon-carbide inverters.
Key Report Takeaways
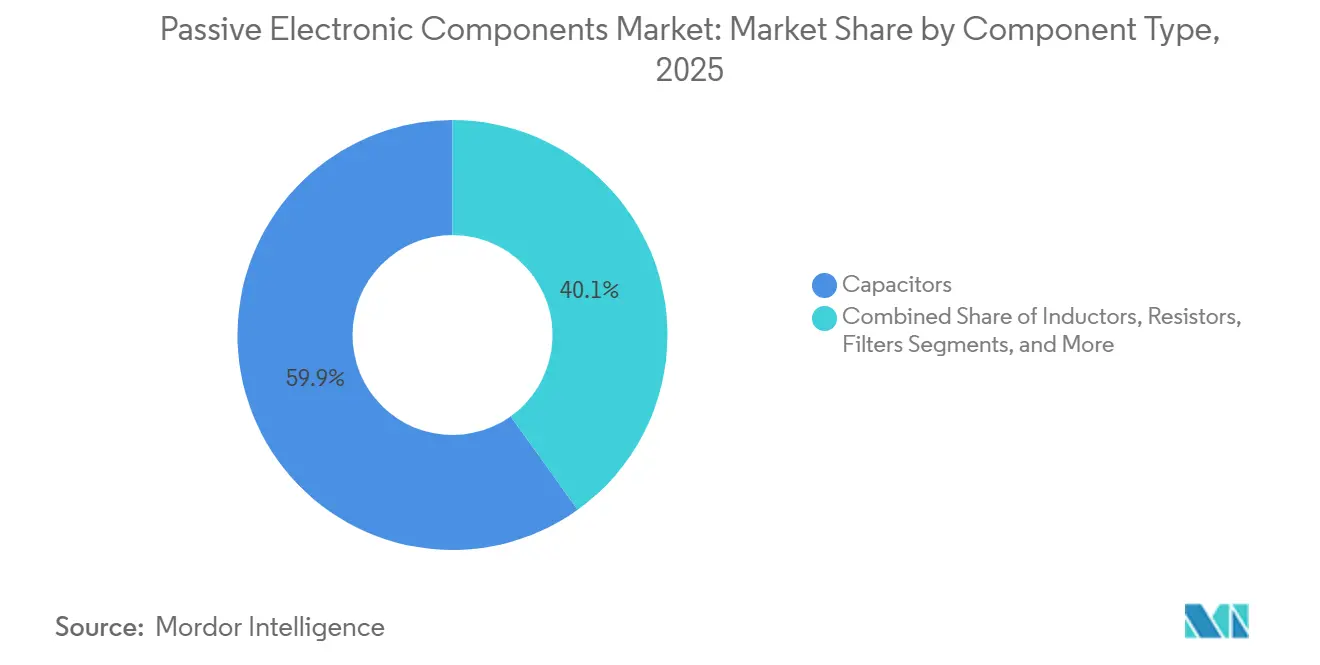
- By component type, capacitors accounted for 59.89% passive electronic components market share in 2025, while filters are expanding at an 8.23% CAGR through 2031.
- By capacitor product type, ceramic units led with 45.78% share of the passive electronic components market size in 2025; super capacitors are advancing at a 7.31% CAGR to 2031.
- By capacitor end-user industry, automotive captured 26.59% revenue share in 2025, yet energy applications are forecast to climb at a 7.02% CAGR.
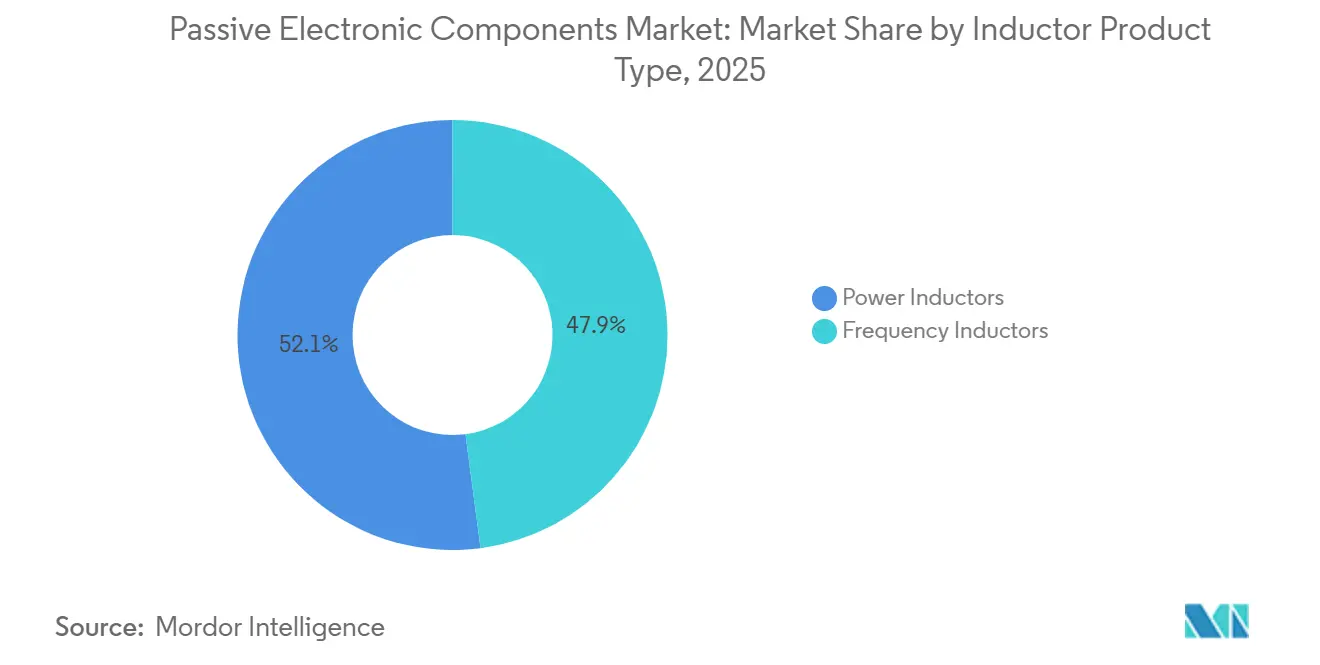
- By inductor product type, power inductors held 52.07% of revenue in 2025; RF inductors are set to record the quickest 6.82% CAGR by 2031.
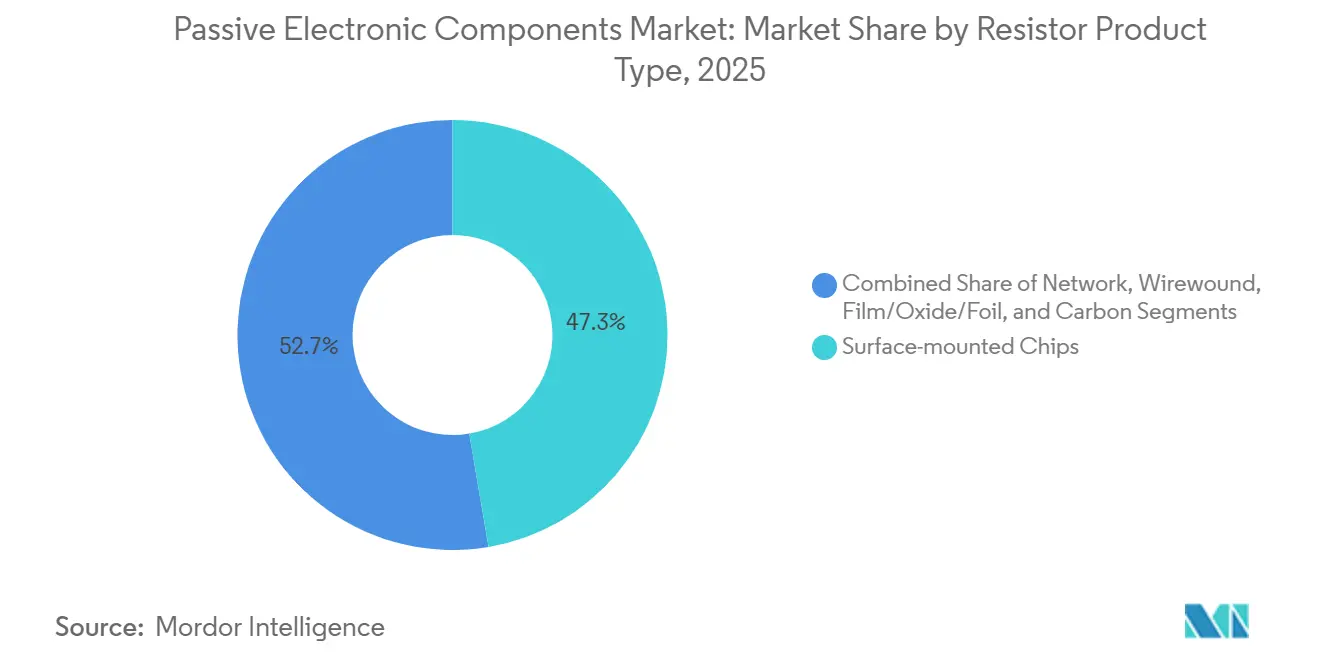
- By resistor product type, surface-mount chips commanded 47.32% share in 2025, whereas film, oxide, and foil devices are growing at a 6.03% CAGR.
- By geography, Asia Pacific contributed 36.12% of capacitor revenue in 2025, while the Middle East is expected to post a 6.76% CAGR through 2031.
Note: Market size and forecast figures in this report are generated using Mordor Intelligence’s proprietary estimation framework, updated with the latest available data and insights as of January 2026.
Global Passive Electronic Components Market Trends and Insights
Drivers Impact Analysis*
| Driver | (~) % Impact on CAGR Forecast | Geographic Relevance | Impact Timeline |
|---|---|---|---|
| Surge in automotive electronics for electric and autonomous vehicles | +1.8% | China, Europe, North America | Medium term (2-4 years) |
| 5G rollout driving high-frequency passive component demand | +1.5% | Asia Pacific, North America | Short term (≤ 2 years) |
| Growing adoption of IoT devices requiring ultra-low-power passives | +1.2% | Asia Pacific, Europe | Medium term (2-4 years) |
| Vertical integration of materials supply to secure palladium and ruthenium | +0.7% | Japan, South Korea, Taiwan | Long term (≥ 4 years) |
| Emergence of embedded passive technology in PCB substrates | +0.9% | Asia Pacific, North America | Medium term (2-4 years) |
| Regionalization of electronics manufacturing to mitigate supply-chain risk | +1.0% | Southeast Asia, India, Mexico, Central Europe | Long term (≥ 4 years) |
| Source: Mordor Intelligence | |||
Surge in Automotive Electronics for Electric and Autonomous Vehicles
Electric cars deploy up to 3,000 discrete passives, triple the count of legacy vehicles, because 800 V battery packs require high-ripple ceramic capacitors, current-sense resistors, and EMI filters. Battery-management systems alone integrate roughly 200 MLCCs per module, smoothing balancing currents to safeguard lithium-ion cells. Lidar and 77 GHz radar add inductors and temperature-stable capacitors that must meet minus-40 °C to plus-125 °C operating windows. Tesla reported an 18% rise in passive-component cost per vehicle in 2025, largely driven by these high-voltage upgrades.[1]Tesla Inc., “Annual Report 2025,” tesla.com Tier 1 suppliers are co-locating capacitor lines next to European and Chinese powertrain plants, cutting lead times from 12 to four weeks and freeing working capital.
5G Rollout Driving High-Frequency Passive Component Demand
Fifth-generation macro cells use spectrum above 3.5 GHz, where parasitics in conventional passives induce insertion loss. Massive-MIMO panels pack 64-256 radiators and need capacitors with self-resonant frequencies beyond 10 GHz. Global 5G standalone sites reached 1.2 million by end-2025, with China and South Korea hosting 60% of deployments.[2]GSMA, “Mobile Economy Report 2025,” gsma.com Each radio consumes roughly 400 passives, including RF inductors tuned for gigahertz operation. Ericsson documented a 25% weight cut in its mid-band radios by miniaturizing these passives, enabling lighter rooftop installs.[3]Ericsson, “Sustainability Report 2025,” ericsson.com Only a handful of vendors can sinter ferrite cores that keep permeability stable across temperature and humidity extremes.
Growing Adoption of IoT Devices Requiring Ultra-Low-Power Passives
Industrial sensors, smart agriculture nodes, and remote health monitors must survive years on coin cells, pushing vendors to design capacitors and inductors with leakage under 1 nA. Cellular IoT connections surpassed 3 billion in 2025, with agriculture and logistics the fastest adopters. Devices endure minus-40 °C to plus-85 °C swings and >90% humidity, which accelerates electromigration if terminations are not corrosion-proof. Manufacturers are applying conformal coatings to extend life beyond 10 years, a must for smart meters and pipeline monitors. Vishay noted that thin-film resistors originally tailored for engine-control units now appear in IoT gateways because they drift less than 0.1% over a decade.
Emergence of Embedded Passive Technology in PCB Substrates
Embedding resistors and capacitors inside PCB dielectric cuts board area 30% and shortens return paths, improving signal integrity. AT and S disclosed that embedded substrates represented 15% of 2025 HDI revenue, nearly double 2024 levels.[4]AT and S, “Annual Report 2025,” ats.net The method relies on sputter deposition and laser trimming, demanding USD 50 million per line in capital. Intel patented die-bump embedded decoupling capacitors that drop power-delivery impedance 40%, allowing clock speeds above 6 GHz without voltage droop. While cost-effective for sub-100 nF values, embedded passives lock customers to a single PCB supplier, raising switching costs.
Restraints Impact Analysis*
| Restraint | (~) % Impact on CAGR Forecast | Geographic Relevance | Impact Timeline |
|---|---|---|---|
| Volatility in precious metal prices impacting capacitor costs | -0.9% | Japan, South Korea, Taiwan | Short term (≤ 2 years) |
| Miniaturization limits for high-capacitance components | -0.6% | Global, most binding in consumer electronics | Medium term (2-4 years) |
| Environmental regulations on tantalum and lead usage | -0.5% | Europe, North America, Asia Pacific | Long term (≥ 4 years) |
| Talent shortages in high-frequency RF design expertise | -0.4% | North America, Europe, Japan | Medium term (2-4 years) |
| Source: Mordor Intelligence | |||
Volatility in Precious Metal Prices Impacting Capacitor Costs
Palladium traded between USD 900 and USD 1,400 per troy ounce during 2025, making MLCC margins swing up to 5 percentage points for suppliers without hedging. Ruthenium spiked 40% in early-2025 as Russian export curbs tightened availability, forcing reformulation of electrode pastes that sacrifice capacitance density. TDK said precious-metal inflation trimmed its capacitor margin by 150 basis points in fiscal 2025 and triggered repricing with auto and industrial buyers. Small vendors lacking scale faced steeper hits, accelerating sector consolidation.
Miniaturization Limits for High-Capacitance Components
Dielectric thickness in MLCCs has shrunk to 0.5 µm, but going thinner triggers quantum tunneling and breakdown. Murata calculated that an 0201 package holding 22 µF would require 1,000 layers, a yield-killer that makes the part uneconomic. Designers are instead stacking lower-capacitance chips or adopting polymer hybrids for high bulk energy in slim footprints. Apple’s iPhone 16 combined ceramic and tantalum arrays to bypass this ceiling, albeit at higher bill-of-materials complexity.[5]Apple Inc., “Supplier Responsibility Report 2025,” apple.com
*Our forecasts treat driver/restraint impacts as directional, not additive. The impact forecasts reflect baseline growth, mix effects, and variable interactions.
Segment Analysis
By Component Type: Capacitors Anchor Market, Filters Surge on RF Demand
In 2025 capacitors commanded 59.89% revenue in the passive electronic components market, validating their universality for power conditioning across automotive, industrial, and consumer gear. Filters, although smaller in base, will expand at an 8.23% CAGR to 2031 as every 5G handset now integrates up to 40 acoustic filters to isolate Wi-Fi 6E, Bluetooth, ultra-wideband, and 5G signals. Inductors underpin power converters, while resistors set currents and divide voltages in all circuits.
Embedded technology is redrawing category boundaries. Substrates hosting thin-film resistors and capacitors trim z-height for smartphones, but values above 100 nF still mandate discrete devices for energy storage. As a result the passive electronic components market size for discrete capacitors in automotive and industrial domains is expected to remain dominant, even as signal-chain-centric filters continue to seize incremental share in handsets and base stations.


By Capacitor Product Type: Ceramic Dominance Meets Super Capacitor Momentum
Ceramic units delivered 45.78% of capacitor sales in 2025, benefiting from wide capacitance range, low ESR, and high frequency response. Super capacitors are set to post a 7.31% CAGR, supported by regenerative braking and grid-frequency regulation where their rapid charge-discharge cycles excel.
While tantalum and aluminum electrolytic devices continue in aerospace and industrial drives, suppliers are blending film and ceramic dielectrics to reach 1,000 V ratings in 800 V EV onboard chargers. This mix ensures the passive electronic components market size attached to high-voltage EV blocks keeps growing despite overall smartphone maturity.
By Capacitor End User Industry: Automotive Leads, Energy Accelerates
Automotive absorbed 26.59% of capacitor demand in 2025 in the passive electronic components market. Energy generation and storage will climb at a 7.02% CAGR through 2031 as photovoltaic inverters and wind turbines adopt film capacitors capable of enduring kilovolt surges.
Industrial machinery, aerospace, and medical devices keep requiring rugged or biocompatible units, yet consumer electronics continues to ship volume in the tens of billions of pieces. Segment focus is therefore tilting from pure volume to application diversity, preserving passive electronic components industry profitability.
By Inductor Product Type: Power Inductors Lead, RF Variants Gain
Power inductors contributed 52.07% of inductor revenue in 2025 thanks to buck and boost converters feeding CPUs and battery chargers. Frequency inductors, though only a quarter of segment value, are expected to expand at 6.82% CAGR as mid-band 5G and sat-com terminals proliferate.
Automotive 48 V mild hybrids and LED lighting require shielded inductors above 20 A saturation, whereas data-center AI accelerators need tight-tolerance RF coils for multi-gigahertz filters. Vendors refining ferrite powder to sustain permeability at these frequencies will capture the next wave of passive electronic components market growth.
By Inductor End User Industry: Automotive Dominates, Comms Surge
Automotive claimed 28.61% of inductor spend in 2025, driven by distributed DC-DC converters within EVs. Communications, servers, and storage will log a 6.47% CAGR to 2031 as AI clusters deploy hundreds of power stages per board.
Aerospace and defense need radiation-tolerant magnetics, while industrial motor drives rely on high-current chokes. Top players therefore pair automotive AEC-Q200 certification with customization services for rugged verticals, insulating margins even as smartphone volumes plateau.
By Resistor Product Type: Surface-Mount Chips Prevail, Film Variants Rise
Thick-film chip resistors held a 47.32% share in 2025, serving in everything from voltage dividers to pull-ups. Film, oxide, and foil parts will outpace at 6.03% CAGR because medical, aerospace, and instrumentation equipment demand temperature coefficients under 25 ppm/°C.
Wirewound units continue in dynamic braking and load banks, while resistor networks simplify LED backlighting. The passive electronic components market size devoted to precision film and foil devices therefore expands as analog-heavy applications seek sub-0.1% drift over life.
By Resistor End User Industry: Consumer Electronics Lead, Energy Grows
Smartphones, laptops, and consoles absorbed 27.47% of resistor revenue in 2025. Solar and wind inverters will be the quickest riser at 6.43% CAGR through 2031 as renovables install megawatt-scale power blocks.
Automotive EVs need current-sense chips up to 5 W in 2512 footprints, while medical imaging requires ultra-stable resistors in gradient amplifiers. These specialized niches reinforce the passive electronic components industry pivot from commoditized consumer volumes to high-value sectors.
Geography Analysis
Asia Pacific accounted for 36.12% of capacitor sales in 2025 and remains the anchor of the passive electronic components market thanks to deep manufacturing clusters in China, Japan, South Korea, and Taiwan. Regional governments subsidize next-generation dielectric research and provide tax incentives for capacity expansion, allowing suppliers to co-locate with smartphone, PC, and EV final-assembly hubs.
Middle East demand, although just mid-single-digit share, is expanding at 6.76% CAGR through 2031 under sovereign initiatives that fund semiconductor fabs, data centers, and solar farms. Abu Dhabi and Riyadh allocate multi-billion-dollar budgets to localize passive assembly, insulating critical telecom and power infrastructure from foreign supply disruptions.
North America and Europe represent mature yet resilient markets. Vehicle electrification, edge computing, and industrial automation sustain component pull, while environmental regulations push adoption of lead-free and tantalum-free designs. Mexico, the Czech Republic, and Poland capitalize on reshoring trends, attracting new MLCC and chip-resistor lines to shorten logistics for U.S. and German OEMs.

Competitive Landscape
The top five suppliers, Murata, TDK, Yageo, Samsung Electro-Mechanics, and Kyocera, command roughly 45% of 2025 revenue, yielding a moderately concentrated structure where scale and patent portfolios matter. These leaders pour capex into sintering furnaces that deposit sub-micron dielectrics, pushing capacitance density beyond rivals.
Murata filed 47 MLCC material patents in 2024 and will add 15% more capacity via a USD 670 million Fukui line that starts in 2026.[6]Murata Manufacturing, “Technical Symposium Presentation 2024,” murata.com TDK teams with Infineon to embed passives inside silicon-carbide modules, a move that elevates switching frequency to 100 kHz and erodes the value of discrete inductors. Yageo’s 2025 purchase of a Malaysian plant adds 8 billion MLCCs per month, diversifying production away from earthquake-prone Taiwan.[7]Yageo Corporation, “Annual Report 2025,” yageo.com
Disruptors like Fenghua and Torch edge into consumer applications through government subsidies, yet they struggle to secure AEC-Q200 qualification for automotive sockets. Raw-material volatility further narrows margins for second-tier players lacking long-term palladium contracts. Consolidation is thus expected to continue as niche capacitor and resistor makers seek scale or exit.
Passive Electronic Components Industry Leaders
Panasonic Corporation
TDK Corporation
Vishay Intertechnology Inc.
Murata Manufacturing Co. Ltd
Yageo Corporation (KEMET)
- *Disclaimer: Major Players sorted in no particular order

Recent Industry Developments
- November 2025: Murata will invest JPY 100 billion (USD 670 million) to boost MLCC output in Fukui, Japan, targeting AEC-Q200 parts for EVs and industrial drives.
- September 2025: TDK partnered with Infineon to co-package inductors and capacitors inside silicon-carbide inverters, enabling above 100 kHz switching for EV traction systems.
- August 2025: Yageo acquired 51% of a Malaysian passive-component factory for USD 120 million, adding 8 billion MLCC units per month of capacity aimed at Southeast Asian auto customers.
- June 2025: Samsung Electro-Mechanics released 1,000 V MLCCs for EV chargers and solar inverters, using a proprietary dielectric stable from minus-40 °C to plus-125 °C.
- April 2025: Vishay opened an USD 80 million resistor plant in Monterrey, Mexico, with annual output of 50 billion units and AEC-Q200 qualification scheduled for 2026.
- February 2025: Panasonic formed a joint venture with a South African miner, locking five-year palladium supply at fixed pricing for MLCC electrodes.


Global Passive Electronic Components Market Report Scope
Passive electronic components are components that consume energy. They do not produce energy, are incapable of power gain, and require no electrical power to operate. They simply absorb energy. A standard example of passive electronic components would be resistors, inductors, and capacitors. The analysis is based on the market insights captured through secondary research and through the primaries. The market also covers the major factors impacting the growth of the passive electronic components market in terms of drivers and restraints.
The passive electronic components market is segmented by capacitors, inductors, and resistors.
Capacitors are further segmented by type (ceramic capacitors, tantalum capacitors, aluminum electrolytic capacitors, paper and plastic film capacitors, and supercapacitors), end-user industry (automotive, consumer electronics, aerospace and defense, energy, communications/servers/data storage, industrial, and medical), and geography.
Inductors are further segmented by type (power and frequency), end-user industry (automotive, consumer electronics and computing, aerospace and defense, and communications), and geography (North America, Europe, Asia-Pacific, and the Rest of the World).
Resistors are further segmented by type (surface-mounted chips, networks, wire-wound, film/oxide/foil, carbon), end-user industry (automotive, consumer electronics and computing, aerospace and defense, and communications), and geography (North America, Europe, Asia-Pacific, and Rest of the World).
The Market Forecasts are Provided in Terms of Value (USD).
| Capacitors | Product Type | Ceramic Capacitors |
| Tantalum Capacitors | ||
| Aluminum Electrolytic Capacitors | ||
| Paper and Plastic Film Capacitors | ||
| Super Capacitors | ||
| By End User Industry | Automotive | |
| Industrial | ||
| Aerospace and Defense | ||
| Consumer Electronics and Computing | ||
| Communications/Servers/Data Storage | ||
| Energy | ||
| Medical | ||
| By Geography | North America | |
| Europe | ||
| Asia-Pacific | ||
| Rest of World | ||
| Inductors | By Product Type | Power Inductors |
| Frequency Inductors | ||
| By End User Industry | Automotive | |
| Aerospace and Defense | ||
| Consumer Electronics and Computing | ||
| Communications/Servers/Data Storage | ||
| Other End User Industries | ||
| By Geography | North America | |
| Europe | ||
| Asia-Pacific | ||
| Rest of World | ||
| Resistors | By Product Type | Surface-mounted Chips |
| Network | ||
| Wirewound | ||
| Film/Oxide/Foil | ||
| Carbon | ||
| By End User Industry | Automotive | |
| Aerospace and Defense | ||
| Consumer Electronics and Computing | ||
| Communications/Servers/Data Storage | ||
| Other End User Industries | ||
| By Geography | North America | |
| Europe | ||
| Asia-Pacific | ||
| Rest of World | ||
| Filters and Other Components | By End User Industry | Automotive |
| Aerospace and Defense | ||
| Consumer Electronics and Computing | ||
| Communications/Servers/Data Storage | ||
| Other End User Industries | ||
| By Geography | North America | |
| Europe | ||
| Asia Pacific | ||
| Rest of World | ||
| By Component Type | Capacitors | Product Type | Ceramic Capacitors |
| Tantalum Capacitors | |||
| Aluminum Electrolytic Capacitors | |||
| Paper and Plastic Film Capacitors | |||
| Super Capacitors | |||
| By End User Industry | Automotive | ||
| Industrial | |||
| Aerospace and Defense | |||
| Consumer Electronics and Computing | |||
| Communications/Servers/Data Storage | |||
| Energy | |||
| Medical | |||
| By Geography | North America | ||
| Europe | |||
| Asia-Pacific | |||
| Rest of World | |||
| Inductors | By Product Type | Power Inductors | |
| Frequency Inductors | |||
| By End User Industry | Automotive | ||
| Aerospace and Defense | |||
| Consumer Electronics and Computing | |||
| Communications/Servers/Data Storage | |||
| Other End User Industries | |||
| By Geography | North America | ||
| Europe | |||
| Asia-Pacific | |||
| Rest of World | |||
| Resistors | By Product Type | Surface-mounted Chips | |
| Network | |||
| Wirewound | |||
| Film/Oxide/Foil | |||
| Carbon | |||
| By End User Industry | Automotive | ||
| Aerospace and Defense | |||
| Consumer Electronics and Computing | |||
| Communications/Servers/Data Storage | |||
| Other End User Industries | |||
| By Geography | North America | ||
| Europe | |||
| Asia-Pacific | |||
| Rest of World | |||
| Filters and Other Components | By End User Industry | Automotive | |
| Aerospace and Defense | |||
| Consumer Electronics and Computing | |||
| Communications/Servers/Data Storage | |||
| Other End User Industries | |||
| By Geography | North America | ||
| Europe | |||
| Asia Pacific | |||
| Rest of World | |||


Key Questions Answered in the Report
What is the current value of the passive electronic components market?
The passive electronic components market size is USD 48.45 billion in 2026 and is forecast to reach USD 63.27 billion by 2031.
Which component category dominates revenue today?
Capacitors command 59.89% of revenue in 2025, making them the largest component segment.
Which product type is growing fastest within capacitors?
Super capacitors are expanding at a 7.31% CAGR through 2031, fueled by regenerative braking and grid-frequency regulation.
How will 5G affect demand for passive parts?
Each 5G base station consumes about 400 passives, lifting high-frequency filter and inductor sales over the next two years.
Which region is the quickest-growing geography?
The Middle East is projected to post a 6.76% CAGR through 2031 thanks to sovereign investments in data centers and renewable energy.
Who are the leading suppliers?
Murata, TDK, Yageo, Samsung Electro-Mechanics, and Kyocera collectively hold around 45% of 2025 revenue.
Page last updated on:


