Material Informatics Market Size and Share
Market Overview
| Study Period | 2019 - 2030 |
|---|---|
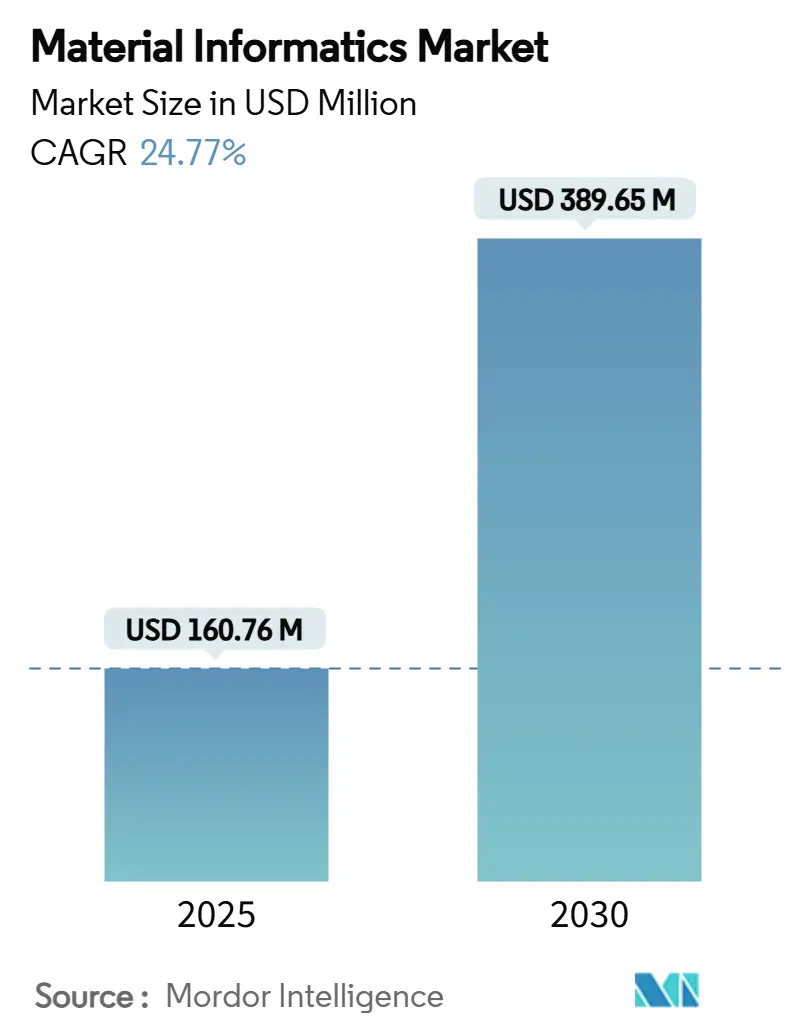
| Market Size (2025) | USD 160.76 Million |
| Market Size (2030) | USD 389.65 Million |
| Growth Rate (2025 - 2030) | 24.77% CAGR |
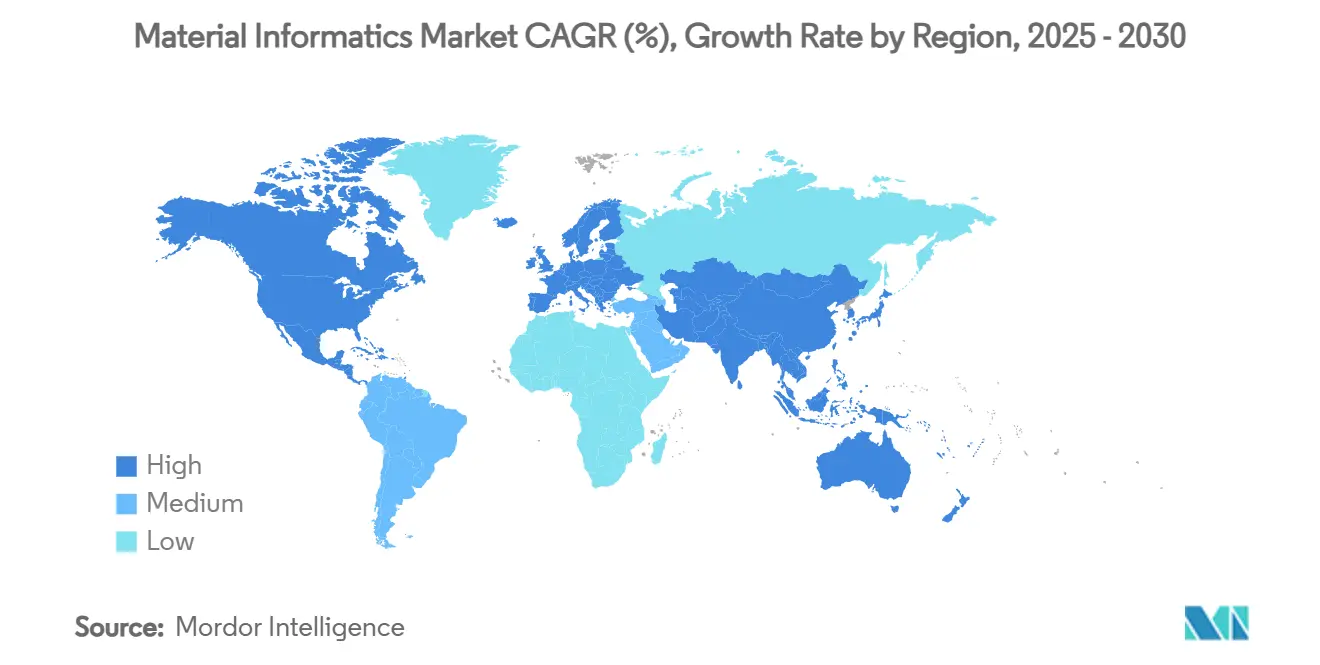
| Fastest Growing Market | Asia Pacific |
| Largest Market | North America |
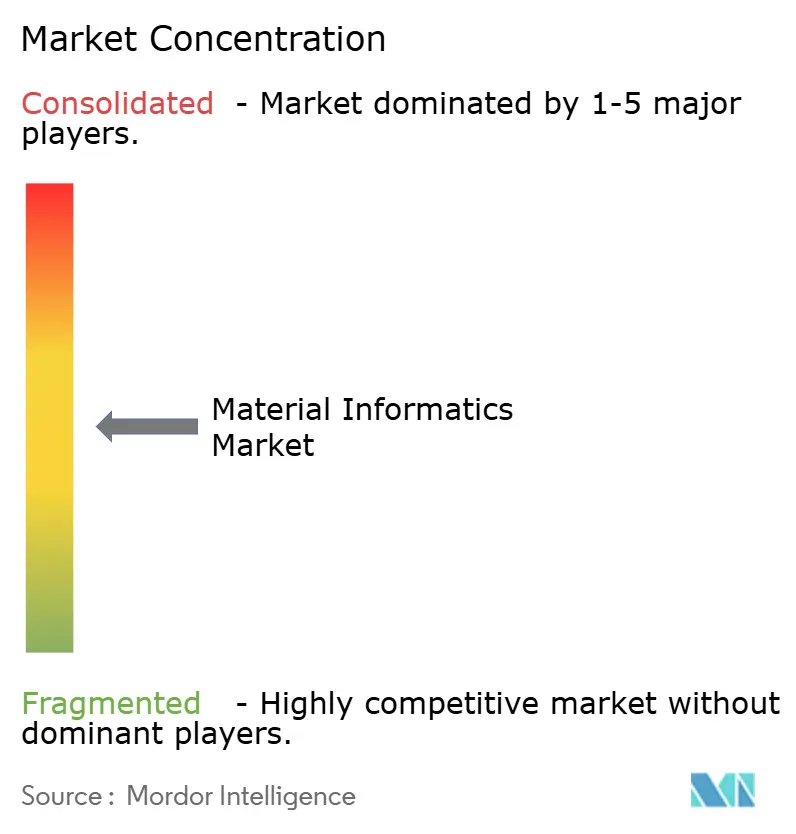
| Market Concentration | Medium |
Major Players *Disclaimer: Major Players sorted in no particular order Image © Mordor Intelligence. Reuse requires attribution under CC BY 4.0. | |
Material Informatics Market Analysis by Mordor Intelligence
The material informatics market size stands at USD 160.76 million in 2025, and it is forecast to advance to USD 389.65 million by 2030, reflecting a 24.77% CAGR. Strong growth comes from the convergence of artificial intelligence, high-performance computing, and materials science, which compresses discovery cycles and lowers experimentation costs. Momentum is reinforced by national programs such as the Materials Genome Initiative that aim to shrink development timelines from decades to mere years. Venture funding, autonomous laboratory platforms, and the rising availability of cloud HPC resources further accelerate adoption, while data-sharing frameworks start to reduce traditional silo barriers. Competitive intensity is building as software firms, AI-native start-ups, and chemical majors race to integrate predictive models with laboratory robotics. Yet white-space remains in quantum materials, sustainable chemistry, and niche verticals, offering ample latitude for new entrants.
Key Report Takeaways
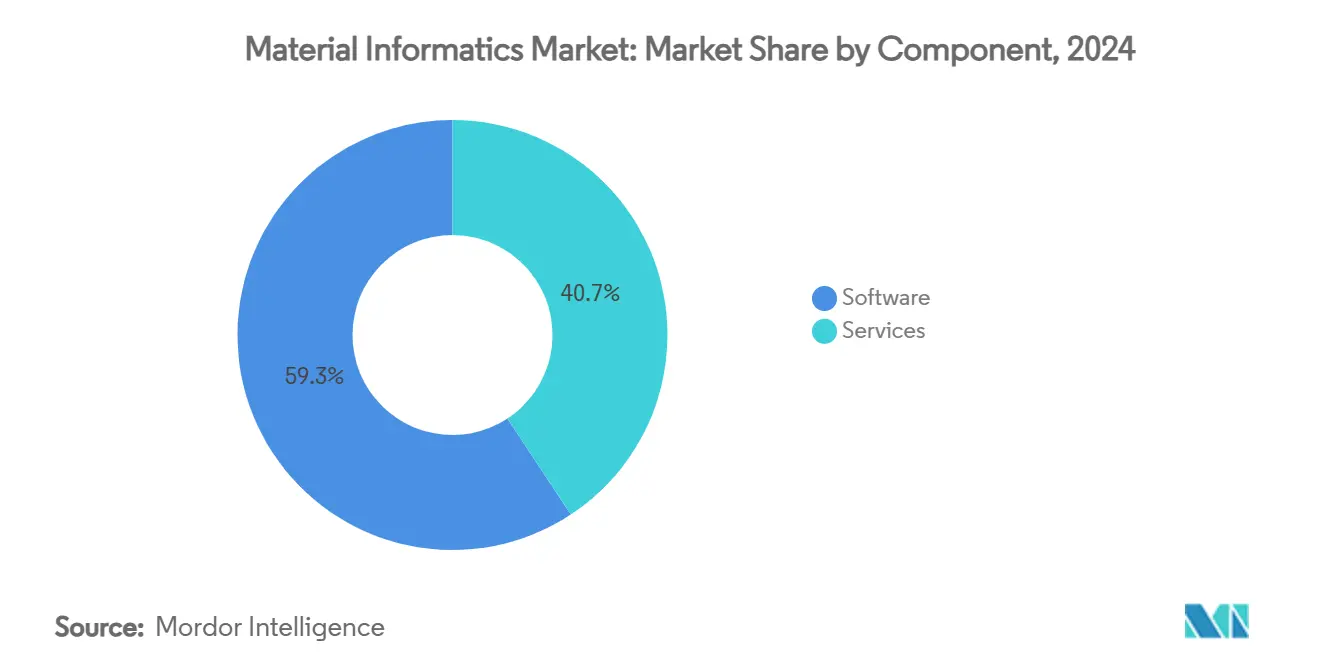
- By component, software solutions captured a 59.26% share of the material informatics market in 2024.
- By deployment mode, the material informatics market for cloud models is projected to grow at a 26.63% CAGR between 2025 to 2030.
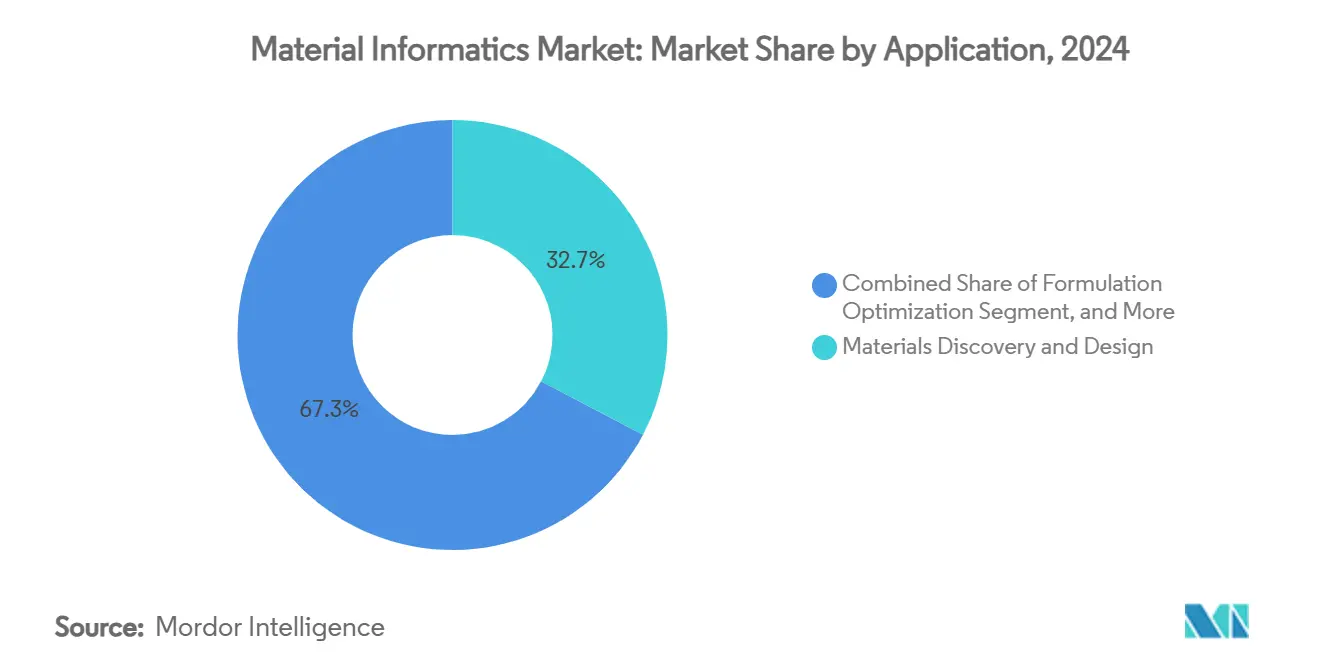
- By application, materials discovery and design captured a 32.67% share of the material informatics market in 2024.
- By end-user industry, the material informatics market for aerospace and defense is projected to grow at a 27.3% CAGR between 2025 to 2030.
- By geography, North America captured a 35.80% share of the material informatics market in 2024.
Global Material Informatics Market Trends and Insights
Drivers Impact Analysis*
| Driver | (~) % Impact on CAGR Forecast | Geographic Relevance | Impact Timeline |
|---|---|---|---|
| AI-driven cost and cycle-time compression in materials R&D | 3.70% | North America, EU, global | Medium term (2-4 years) |
| Rising adoption of digital twins for formulation Optimization | 3.00% | North America, EU, expanding to APAC | Long term (≥ 4 years) |
| VC funding surge in materials-science start-ups post-2023 | 2.50% | North America core, spill-over to EU and APAC | Short term (≤ 2 years) |
| Integration with laboratory robotics and automated synthesis | 2.00% | Global, early adoption in developed markets | Medium term (2-4 years) |
| National mission programmes for critical materials security | 2.70% | North America, EU, China, India | Long term (≥ 4 years) |
| Generative foundation models unlocking property prediction | 2.20% | Global, AI-advanced regions | Medium term (2-4 years) |
| Source: Mordor Intelligence | |||
AI-driven cost and cycle-time compression in materials R&D
Autonomous experimentation platforms are shrinking synthesis-to-characterization loops from months to days through closed-loop robotics, active-learning algorithms, and direct links to data repositories. These systems free scientists from 80% of repetitive characterization tasks, allowing focus on hypothesis building. Firms deploying such platforms report tenfold reductions in time-to-market for new formulations and unlock compositional spaces that would be cost-prohibitive under conventional trial-and-error. Competitive advantages outweigh upfront capital outlays, encouraging broader enterprise adoption.
Rising adoption of digital twins for formulation Optimization
Multi-scale digital twins simulate composition–process–property relationships, enabling parameter tuning before physical trials. Frameworks such as the materials-information twin tetrahedra knit materials and information science disciplines, lowering discovery costs. Regulated industries value the approach for reducing test iterations, with early adopters noting 30-50% cuts in formulation spend. Widespread impact hinges on investment in HPC and cross-disciplinary talent.
VC funding surge in materials-science start-ups post-2023
Investor appetite for AI-enabled platforms equates the opportunity to genomics, channeling capital toward generative models, autonomous synthesis, and specialized databases. Funding de-risks ambitious programs and helps start-ups attract top scientists through equity incentives, yet heightens competition for scarce materials-aware data talent.
Integration with laboratory robotics and automated synthesis
Self-driving laboratories blend reinforcement learning with collaborative robots that operate 24/7, feeding real-time data into predictive models. Early installations focus on solution-phase chemistry; emerging systems add solid-state synthesis and advanced characterization, broadening applicability to quantum dots and battery materials.
Restraints Impact Analysis*
| Restraint | (~) % Impact on CAGR Forecast | Geographic Relevance | Impact Timeline |
|---|---|---|---|
| Data-scarcity and siloed proprietary databases | -2.00% | Global, acute in emerging markets | Long term (≥ 4 years) |
| IP-related hesitancy to share high-value experimental data | -1.50% | Global, variable by region | Medium term (2-4 years) |
| Shortage of materials-aware data scientists | -1.70% | Global, severe in APAC and emerging markets | Long term (≥ 4 years) |
| High up-front cost for cloud HPC resources | -1.20% | Global, heavier on SMEs and academia | Short term (≤ 2 years) |
| Source: Mordor Intelligence | |||
Data-scarcity and siloed proprietary databases
Most experimental datasets sit inside corporate vaults, curbing model generalizability and amplifying bias. Computational repositories face reproducibility challenges, and high-dimensional metadata is often missing. Small-data techniques help, but still need validation against scarce experiments.[1]Horton et al., “Promises and perils of computational materials databases,” Nature Computational Science Shared-database efforts stumble over competitive concerns, particularly in quantum materials and sustainable chemistry.
Shortage of materials-aware data scientists
Interdisciplinary skill sets that blend materials fundamentals with machine learning remain rare. Surveys show gaps in curricula, leaving graduates underprepared for data-centric tasks. Companies resort to lengthy in-house training while offering premium salaries, slowing project timetables, and inflating budgets.
*Our forecasts treat driver/restraint impacts as directional, not additive. The impact forecasts reflect baseline growth, mix effects, and variable interactions.
Segment Analysis
By Component: Software Dominance and Service Upside
Software platforms represented the backbone of adoption with 59.26% of the material informatics market share in 2024. Vendors deliver cloud-native hubs that connect data, features, models, and applications at scales of 10 to 1,000,000 entries. Recurring licenses generate steady income, and embedded analytics cultivate sticky user bases. Services grew fast at 25.71% CAGR as enterprises sought bespoke model tuning and workflow integration. Consulting providers emphasize regulatory support, domain-specific algorithms, and robotics interfaces, forming integrated offerings that capture larger client budgets.
Software vendors now pre-configure automated model training and real-time optimization while embedding laboratory-robotics hooks. Services firms answer skills shortages by supplying experienced data scientists and materials specialists. The tandem approach underpins a virtuous cycle. Platforms lower entry barriers, services accelerate value realization, and recurring support fees boost vendor margins.


By Deployment Mode: Cloud Catalyzes Access
Cloud infrastructure held 65.80% of the material informatics market size in 2024, offering pay-as-you-go HPC that democratizes quantum-level calculations. Elastic scaling matches compute load to project needs and eliminates capital purchases. Security-sensitive sectors still favor on-premises, but providers respond with dedicated environments and compliance certifications. Start-ups and universities reap particular benefit, accessing exascale resources for episodic tasks.
Cloud providers add domain-specific toolkits and collaborative notebooks to shorten setup times. As workloads intensify, hybrid strategies arise, keeping sensitive data on-site while bursting simulations to the cloud. The model’s flexibility continues to draw cost-conscious adopters, sustaining a double-digit growth trajectory through 2030.
By Application: Discovery Leads, Generative Design Accelerates
Discovery and design functions retained 32.67% of the material informatics market share in 2024, acting as the entry point for computational screening and property prediction. Formulation Optimization follows, targeting cost, performance, and sustainability trade-offs in mature industries. Generative design recorded the fastest 26.25% CAGR as inverse-design algorithms matured, exemplified by DELID technology, which reached 88% optical-property accuracy without expensive quantum calculations.
Process Optimization and substitute material identification extend value into manufacturing and supply-chain resilience, while failure analysis and predictive maintenance carve early niches. Application diversity encourages specialized platforms that address vertical pain points yet maintain cross-industry relevance.

By End-User Industry: Chemicals Rule, Aerospace Gains Altitude
Chemicals and advanced materials companies owned 29.80% of the material informatics market size in 2024, leveraging AI tools to explore vast compositional spaces and develop sustainable alternatives. BASF allocated EUR 2.1 billion (USD 2.3 billion) to R&D in 2024, with battery and green-chemistry priorities. Aerospace and defense posted a 27.3% CAGR as additive manufacturing and multiscale modeling entered mainstream design flows.
Pharmaceuticals use informatics for drug-delivery materials; energy firms optimize battery chemistries; electronics players chase miniaturized semiconductors; automotive OEMs pursue lightweighting and emissions goals. Cross-industry fertilization accelerates innovation, with breakthroughs in one sector often jump-starting progress in another.
Geography Analysis
North America controlled 35.80% of the material informatics market share in 2024. The U.S. Department of Energy earmarked USD 75 million for a Critical Material Supply Chain Research Facility to bolster domestic resilience. DARPA’s CriticalMAAS program further illustrates state support for AI-driven mineral assessments.[2]Defense Advanced Research Projects Agency, “CriticalMAAS,” DARPA.MILCanada contributes mining data expertise, while Mexico supplies manufacturing capacity, knitting a continental innovation fabric.
Asia-Pacific is forecast to be the fastest-growing region at 26.45% CAGR to 2030. China treats materials innovation as a pillar of self-reliance, underwritten by national HPC and AI investments. Japan’s National Institute for Materials Science recently mapped 3,000 potential new phases, underscoring regional scientific depth. India’s National Supercomputing Mission broadens computational reach and fosters open-source platform development. The cluster effect of manufacturing hubs, raw-material suppliers, and research centers fuels rapid uptake.[3]Government of India, Department of Science and Technology, “Annual Report 2021-22,” DST.GOV.IN
Europe retains a solid position, driven by sustainability mandates and coordinated R&D programs. German automotive and aerospace deploy informatics for lightweight composites; the UK channels finance and research talent; France advances luxury and aviation materials. Stringent environmental regulations spur platform demand that can model life-cycle impacts early in design.

Competitive Landscape
The market features moderate fragmentation with accelerating consolidation tendencies. Horizontal platform providers perfect cross-material capabilities, while vertical specialists concentrate on domains such as battery cathodes or polymer additives. Chemical majors license or acquire AI start-ups to internalize capability and protect supply chains. Differentiation hinges on model accuracy, data stewardship, and ease of use for non-coders.
Proprietary databases remain high-value assets. Vendors couple them with reinforcement learning and graph neural networks to predict structure–property relationships ahead of rivals. Strategic alliances between cloud hyperscalers and laboratory-automation firms embed informatics deeper into R&D pipelines. As more workflows close the loop from simulation to automated synthesis, time-to-value becomes a key competitive metric.
Talent remains a limiting factor. Companies court scarce materials-data scientists with premium packages, or invest in training academies. Partnerships with universities allow early access to graduates and collaborative IP, while open-source contributions build brand authority and attract community innovation. The next phase will likely see mergers that combine datasets, robotics infrastructure, and AI stacks into full-service suites.
Material Informatics Industry Leaders
Citrine Informatics Inc.
Exabyte Inc.
Schrödinger Inc.
ANSYS, Inc.
Kebotix Inc.
- *Disclaimer: Major Players sorted in no particular order

Recent Industry Developments
- July 2025: The National Institute for Materials Science released machine-learning maps predicting 3,000 new phases from 85,320 combinations, streamlining the discovery of magnetic and thermoelectric compounds.
- July 2025: Korean scientists disclosed DELID AI achieving 88% optical-property prediction accuracy without quantum calculations, doubling prior benchmarks.
- March 2025: BASF confirmed EUR 2.1 billion (USD 2.3 billion) 2024 R&D outlay with a focus on battery materials and sustainable products.
- January 2025: U.S. Department of Health and Human Services issued an AI strategy for responsible deployment in medical discovery and care delivery.


Global Material Informatics Market Report Scope
| Software |
| Services |
| Cloud-Based |
| On-Premises |
| Materials Discovery and Design |
| Formulation Optimisation |
| Process Optimisation and Scale-Up |
| Substitute Material Identification |
| Failure Analysis and Predictive Maintenance |
| Chemicals and Advanced Materials |
| Pharmaceuticals and Life Sciences |
| Energy and Power (Batteries, Fuel Cells) |
| Electronics and Semiconductors |
| Automotive and Transportation |
| Aerospace and Defense |
| North America | United States |
| Canada | |
| Mexico | |
| South America | Brazil |
| Argentina | |
| Rest of South America | |
| Europe | Germany |
| United Kingdom | |
| France | |
| Italy | |
| Spain | |
| Russia | |
| Rest of Europe | |
| Asia-Pacific | China |
| Japan | |
| South Korea | |
| India | |
| Australia and New Zealand | |
| Rest of Asia-Pacific | |
| Middle East | Saudi Arabia |
| UAE | |
| Turkey | |
| Rest of Middle East | |
| Africa | South Africa |
| Nigeria | |
| Rest of Africa |
| By Component | Software | |
| Services | ||
| By Deployment Mode | Cloud-Based | |
| On-Premises | ||
| By Application | Materials Discovery and Design | |
| Formulation Optimisation | ||
| Process Optimisation and Scale-Up | ||
| Substitute Material Identification | ||
| Failure Analysis and Predictive Maintenance | ||
| By End-User Industry | Chemicals and Advanced Materials | |
| Pharmaceuticals and Life Sciences | ||
| Energy and Power (Batteries, Fuel Cells) | ||
| Electronics and Semiconductors | ||
| Automotive and Transportation | ||
| Aerospace and Defense | ||
| By Geography | North America | United States |
| Canada | ||
| Mexico | ||
| South America | Brazil | |
| Argentina | ||
| Rest of South America | ||
| Europe | Germany | |
| United Kingdom | ||
| France | ||
| Italy | ||
| Spain | ||
| Russia | ||
| Rest of Europe | ||
| Asia-Pacific | China | |
| Japan | ||
| South Korea | ||
| India | ||
| Australia and New Zealand | ||
| Rest of Asia-Pacific | ||
| Middle East | Saudi Arabia | |
| UAE | ||
| Turkey | ||
| Rest of Middle East | ||
| Africa | South Africa | |
| Nigeria | ||
| Rest of Africa | ||


Key Questions Answered in the Report
What is the current material informatics market size and forecast CAGR?
The material informatics market size is USD 160.76 million in 2025 and is projected to reach USD 389.65 million by 2030, reflecting a 24.77% CAGR.
Which component segment leads the material informatics market?
Software platforms lead with 59.26% share in 2024, while services show the fastest 25.71% CAGR through 2030.
Why is cloud deployment growing in material informatics?
Cloud models deliver elastic HPC capacity on a pay-per-use basis, cutting capital costs and enabling small firms to run quantum-level simulations.
Which region is the fastest growing for material informatics solutions?
Asia-Pacific is the fastest, advancing at a 26.45% CAGR to 2030 due to large-scale government R&D investments and manufacturing demand.
Page last updated on:


