
Piezoelectric Devices Market Size and Share
Market Overview
| Study Period | 2020 - 2031 |
|---|---|
| Market Size (2026) | USD 34.95 Billion |
| Market Size (2031) | USD 47.29 Billion |
| Growth Rate (2026 - 2031) | 6.23 % |
| Fastest Growing Market | Middle East and Africa |
| Largest Market | Asia Pacific |
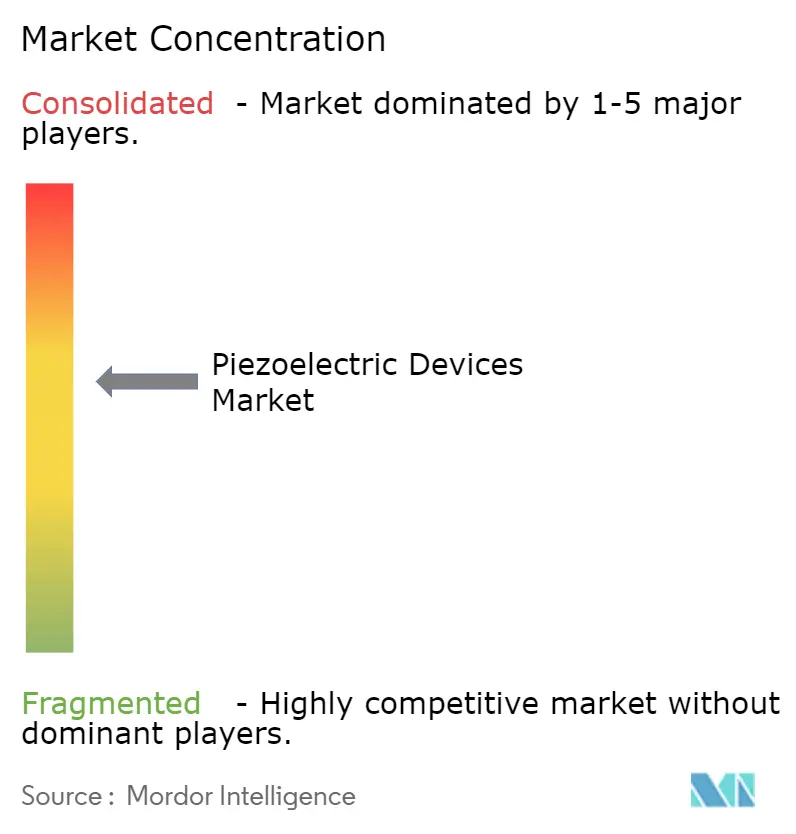
| Market Concentration | Medium |
Major Players *Disclaimer: Major Players sorted in no particular order Image © Mordor Intelligence. Reuse requires attribution under CC BY 4.0. | |
Piezoelectric Devices Market Analysis by Mordor Intelligence
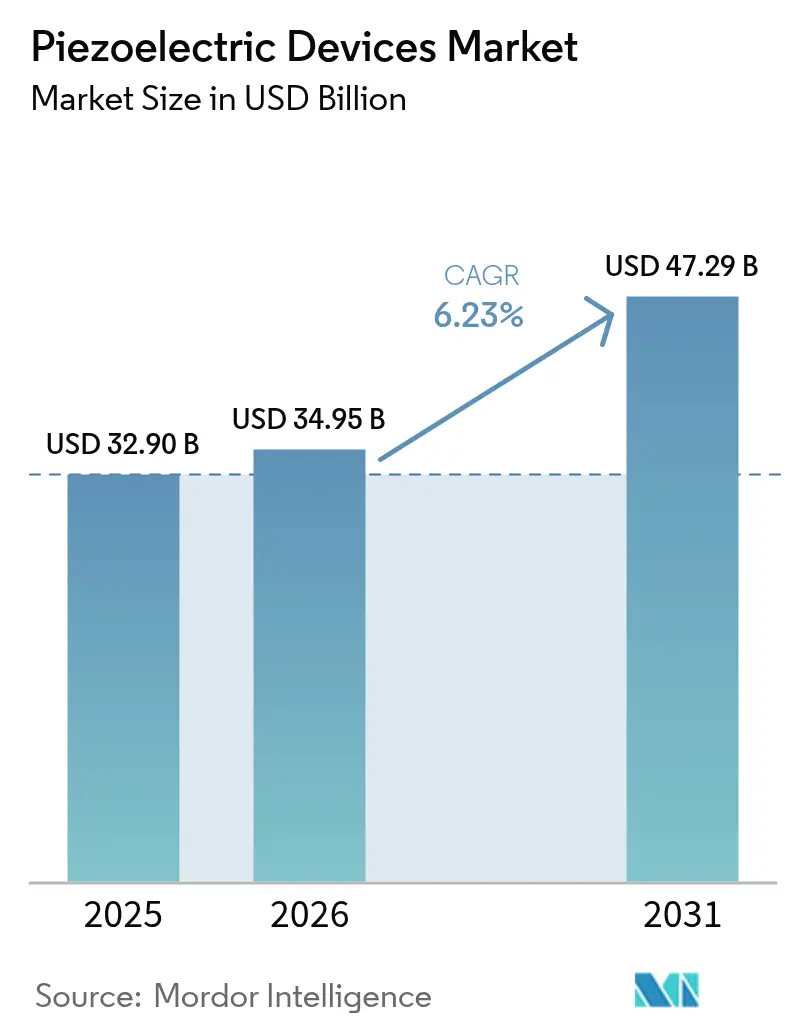
The piezoelectric devices market size was valued at USD 32.9 billion in 2025 and estimated to grow from USD 34.95 billion in 2026 to reach USD 47.29 billion by 2031, at a CAGR of 6.23% during the forecast period (2026-2031). Expansion stems from the miniaturization of 5G RF filters, rising automotive electrification, and Industry 4.0 retrofits that rely on robust, energy-efficient piezo components. The adoption of aluminum scandium nitride for bulk acoustic wave filters enables smartphone frequencies above 6 GHz, while the European Union’s lead-free agenda accelerates the shift to potassium sodium niobate and bismuth sodium titanate despite their higher manufacturing costs.[1]Materion, “BAW Application of AlSc Material in 5G RF Filters,” materion.com Source: PI Ceramic GmbH, “Piezoceramic Materials,” piceramic.com Asia-Pacific leads demand through large-scale consumer electronics output, and Middle East and Africa shows the fastest growth on oil-and-gas energy harvesting projects.[2]MDPI, “Enhanced Heat-Powered Batteryless IIoT Architecture with NB-IoT for Predictive Maintenance in the Oil and Gas Industry,” mdpi.com Competitive intensity is moderate because vertically integrated suppliers such as TDK, Murata, and Kyocera secure upstream materials and downstream capacity, yet supply risks around niobium and lithium introduce volatility for defense and aerospace users.
Key Report Takeaways
- By product type, sensors held 31.74% of piezoelectric devices market share in 2025, while energy harvesters are projected to advance at a 8.72% CAGR through 2031.
- By material, ceramics commanded 66.92% revenue share in 2025; polymers are expected to grow at an 8.29% CAGR to 2031.
- By operating mode, the d33 compression segment accounted for 41.97% share of the piezoelectric devices market size in 2025, whereas thickness-mode solutions are set to expand at an 7.86% CAGR through 2031.
- By end-user industry, consumer electronics led with 27.42% revenue share in 2025, while automotive and transportation is forecast to post a 7.55% CAGR through 2031.
- By geography, Asia-Pacific dominated with 38.46% share in 2025; Middle East and Africa is the fastest-growing region at an 8.14% CAGR to 2031.
Note: Market size and forecast figures in this report are generated using Mordor Intelligence’s proprietary estimation framework, updated with the latest available data and insights as of 2026.
Global Piezoelectric Devices Market Trends and Insights
Drivers Impact Analysis*
| Driver | (~) % Impact on CAGR Forecast | Geographic Relevance | Impact Timeline |
|---|---|---|---|
| Miniaturization of Piezo-MEMS RF Filters for 5G Smartphones | +1.8% | Asia-Pacific core, spill-over to North America | Medium term (2-4 years) |
| Electrified Fuel-Injection and ADAS Piezo Actuators in European Premium Cars | +1.2% | Europe primary, North America secondary | Medium term (2-4 years) |
| Industry 4.0 Retrofit Demand for Piezo Sensors in United States Discrete Manufacturing | +0.9% | North America core, expanding to Europe | Short term (≤ 2 years) |
| Smart Ultrasonic Meter Roll-outs in South-Korea and China Utilities | +0.7% | Asia-Pacific core, limited global expansion | Long term (≥ 4 years) |
| Micro-Vibration Energy Harvesting for Remote Oil and Gas Pipelines | +0.5% | Middle East primary, global oil infrastructure | Long term (≥ 4 years) |
| Federal Funding for Hypersonic-Grade Piezo Ceramics in United States Defense | +0.4% | United States national, allied defense cooperation | Long term (≥ 4 years) |
| Source: Mordor Intelligence | |||
Miniaturization of Piezo-MEMS RF Filters for 5G Smartphones (Asia)
Bulk acoustic wave filters built on aluminum scandium nitride now achieve frequencies above 6 GHz with coupling coefficients 40% higher than standard aluminum nitride, while maintaining thermal stability to 400 °C. These advances shrink die footprints to 0.83 × 0.75 mm² and keep insertion losses below 1.5 dB, preserving smartphone battery life. Three-dimensional nanomechanical resonators further consolidate multiband functions onto single chips, creating scalable solutions for ultrawide-band connectivity. Asian wafer-level sealed silicon cavity platforms have achieved quality factors above 439, reducing production steps and cost. As 6G and millimeter-wave initiatives gather pace, demand rises for lithium niobate-based ultra-small filter chips, reinforcing Asia-Pacific’s technology leadership.
Electrified Fuel-Injection and ADAS Piezo Actuators in European Premium Cars
Copper-electroded EPCOS multilayer actuators withstand more than 1 billion cycles at 170 °C, offering 20% performance gains over silver-palladium units while trimming material expenses.[3]TDK Corporation, “New EPCOS Copper Piezo Actuators Set Benchmark,” tdk-electronics.tdk.com DENSO’s i-ART system integrates microprocessors with piezo injectors to tailor fuel delivery in real time, enhancing engine efficiency under stricter emission norms.[4DENSO, “DENSO, Injecting Life into Diesel Technology,” denso-am.eu] Piezo sensors in semi-active suspension modules support magnetorheological dampers that raise ride comfort and stability for electrified platforms. Frame-type actuators transmit forces over 300 times higher than inertial models, giving advanced driver-assistance systems quicker mechanical response. Haptic feedback modules using PowerHap stacks now move 2 kg automotive displays with precise tactile cues that bolster human–machine interaction.
Industry 4.0 Retrofit Demand for Piezo Sensors in United States Discrete Manufacturing
Battery-free piezoelectric energy harvesters power wireless sensor nodes that monitor aging machinery, cutting maintenance labor where battery swaps are impractical. IoT-ready mechatronic assemblies coordinate with AI and big-data analytics to raise output quality and sustainability in US factories. Physik Instrumente invested USD 20 million to triple capacity at its Eschbach plant, citing surging need for precision stages in semiconductor and photonics lines. Gel-electret devices retain 24% more charge than liquid electrets, broadening wearable health-care sensor usage. Structural health monitoring systems employ self-powered piezo arrays to watch bridges and pipelines continuously without field service visits.
Smart Ultrasonic Meter Roll-outs in South-Korea and China Utilities
pMUTs that deploy potassium sodium niobate films generate acoustic pressures of 105.5 dB/V, exceeding aluminum nitride devices and boosting flow-meter accuracy South Korea’s smart-city programs pair these meters with AI-driven dashboards for water and gas oversight. Temperature-tuned phononic crystals relying on shape-memory alloys widen sensor bandwidth without degrading output voltage in harsh climates. Patch-type capacitive micromachined ultrasonic transducers enable wireless power transfer through thick walls, pushing piezo adoption into medical implants as well as utilities. China’s infrastructure upgrade strategy values such robust, remote-monitoring instruments to optimize resource distribution across dense urban grids.
Restraints Impact Analysis*
| Restraint | (~) % Impact on CAGR Forecast | Geographic Relevance | Impact Timeline |
|---|---|---|---|
| EU Lead-Free Directive Increasing Cost of PZT Substitutes | -1.4% | Europe primary, global compliance spillover | Medium term (2-4 years) |
| Price Volatility from Single-Source Niobium and Lithium Supply | -0.8% | Global, concentrated in defense and aerospace | Long term (≥ 4 years) |
| Capital-Intensive Multi-Axis Stage Production Limiting SME Entry (JP/DE) | -0.6% | Japan and Germany core, global manufacturing impact | Medium term (2-4 years) |
| Temperature Limits of Polymer Piezo Films in Aero-engines | -0.4% | Global aerospace, concentrated in US/EU/Asia | Long term (≥ 4 years) |
| Source: Mordor Intelligence | |||
EU Lead-Free Directive Increasing Cost of PZT Substitutes
The Restriction of Hazardous Substances mandate propels the migration from PZT to lead-free ceramics that carry 15-20% higher production costs and complicate global supply strategies. KNN-based textured ceramics recently reached 550 pC/N piezo coefficients with less than 1.2% variability between 25 °C and 150 °C, making them competitive for performance-critical uses. Recycling methods that reclaim oxides via upside-down composite processing slash energy demand to 1% of virgin production and keep sensing quality intact. Manufacturers must maintain twin supply chains to serve PZT-dependent regions while scaling pristine lines for EU buyers, raising overheads. Cost differentials slow substitution in price-sensitive consumer electronics even as regulatory deadlines loom within two years.
Price Volatility from Single-Source Niobium and Lithium Supply
Brazil supplies 85% of global niobium, and Chinese refiners increasingly influence terms, generating uncertainty for hypersonic defense projects that rely on niobium-enhanced piezoceramics. Lithium markets swing with electric-vehicle battery demand, inflating costs for lithium-based piezo materials in high-reliability electronics. Scandium processing is also geographically concentrated, exposing 5G filter manufacturers to currency and policy shocks. Neo Performance Materials sold lower-margin Chinese assets to hedge rare-earth volatility, signaling broader industry caution. Capital-intensive mineral processing limits swift diversification, so end users pursue recycling and alternative chemistries that still fall short of peak performance needs.
*Our forecasts treat driver/restraint impacts as directional, not additive. The impact forecasts reflect baseline growth, mix effects, and variable interactions.
Segment Analysis
By Product Type: Sensors Lead While Energy Harvesters Accelerate
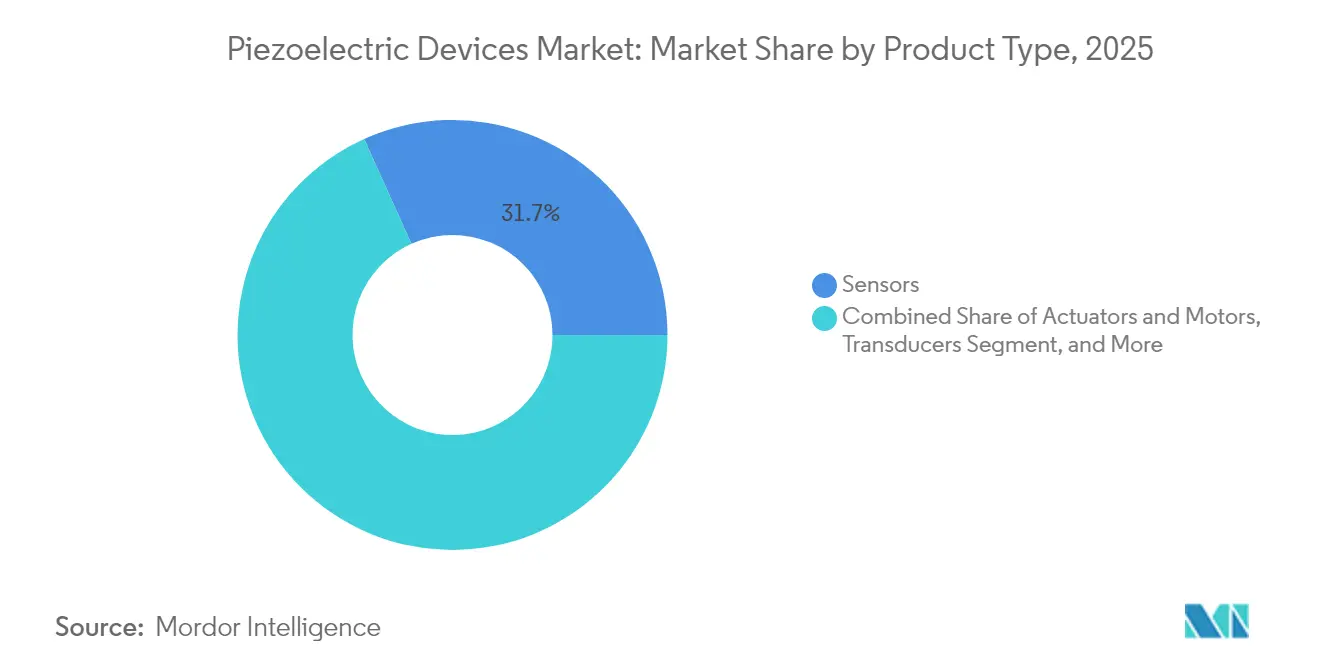
Sensors captured 31.74% of piezoelectric devices market share in 2025, reflecting their cross-industry ubiquity in smartphones, vehicles, and industrial monitoring. Energy harvesters form the fastest-growing cohort at a 8.72% CAGR, aligned with self-powered IoT rollouts that favor maintenance-free nodes. Actuators and motors hold the second-largest slice by revenue, benefiting from EV adoption and precision manufacturing. Resonators see renewed traction as 5G deployment raises network synchronization requirements. The segment’s acceleration mirrors break-throughs in piezoelectric nanogenerators that pair silicone rubber composites with power densities of 1.56 pW/cm² under daily flexing. Hybrid devices now combine sensing, actuation, and harvesting within a single stack, offering compact solutions for autonomous robots. Generators embedded in floor tiles yield 249.6 mW under foot traffic at roughly USD 10.2 per tile, illustrating low-entry energy harvesting for smart buildings.
Demand convergence places upward pressure on high-temperature lead-free materials and low-cost polymer blends. Piezoelectric transformers boasting 88% conversion efficiency at 50 kHz enable RF-energy harvesting for distant sensor nodes As manufacturers integrate edge AI, noise-filtered measurements and two-way feedback loops become essential, preserving the centrality of sensing devices within the piezoelectric devices market.



By Material: Ceramics Dominate Despite Polymer Innovation
Ceramics accounted for 66.92% of 2025 revenue, maintained by PZT’s mature supply chain and high electromechanical coupling. Polymers, especially PVDF, are growing fastest at an 8.29% CAGR thanks to flexible wearables and biomedical implants. Single-crystal options deliver premium performance for aerospace and defense, while composite architectures merge disparate advantages. Wet-spun PVDF fibers now register 0.88 V outputs under 50 N compression with R² = 0.996 linearity, extending utility into soft robotics.
MgSiN₂ thin films with a 5.9 eV bandgap show converse coefficients of 2.3 pm/V, broadening piezo integration in nanoelectromechanical systems. Lead-free Ba₀.₈₅Ca₀.₁₅Ti₀.₉Zr₀.₁O₃ ceramics top 650 pC/N while keeping Curie temperatures of 96.5 °C, addressing EU compliance without severe trade-offs. Y-doped ZnO exhibits an 8.5-fold output jump through carrier-concentration control, pushing oxide semiconductors toward filter and sensor roles. These parallel advances suggest the piezoelectric devices market will remain ceramic-centric yet increasingly diversified.
By Operating Mode: Compression Mode Leads Thickness Applications
The d33 compression configuration represented 41.97% of global revenue in 2025, valued for direct force-response suitability in sensors and longitudinal actuators. Thickness-mode transducers should post the quickest rise at 7.86% CAGR with medical imaging upgrades and aerospace nondestructive testing. Shear-mode actuators unlock torsional motion for precision optics, whereas bending-mode harvesters populate flexible electronics and footwear energy capture.
HiPIMS deposition enables dense thin films on insulating wafers below 300 °C, essential for semiconductor integration. Multilayer thickness stacks lower drive voltages, expanding portable ultrasound to home diagnostics. Frame-type actuators channel power flows 300 times that of inertial rivals, reinforcing their role in adaptive optics and micro-robotics. Recent magnetostatic wave filters operate with zero static power, pairing with piezoelectric modules to create tunable RF front-ends for 6G systems.
By End-User Industry: Consumer Electronics Lead Automotive Growth
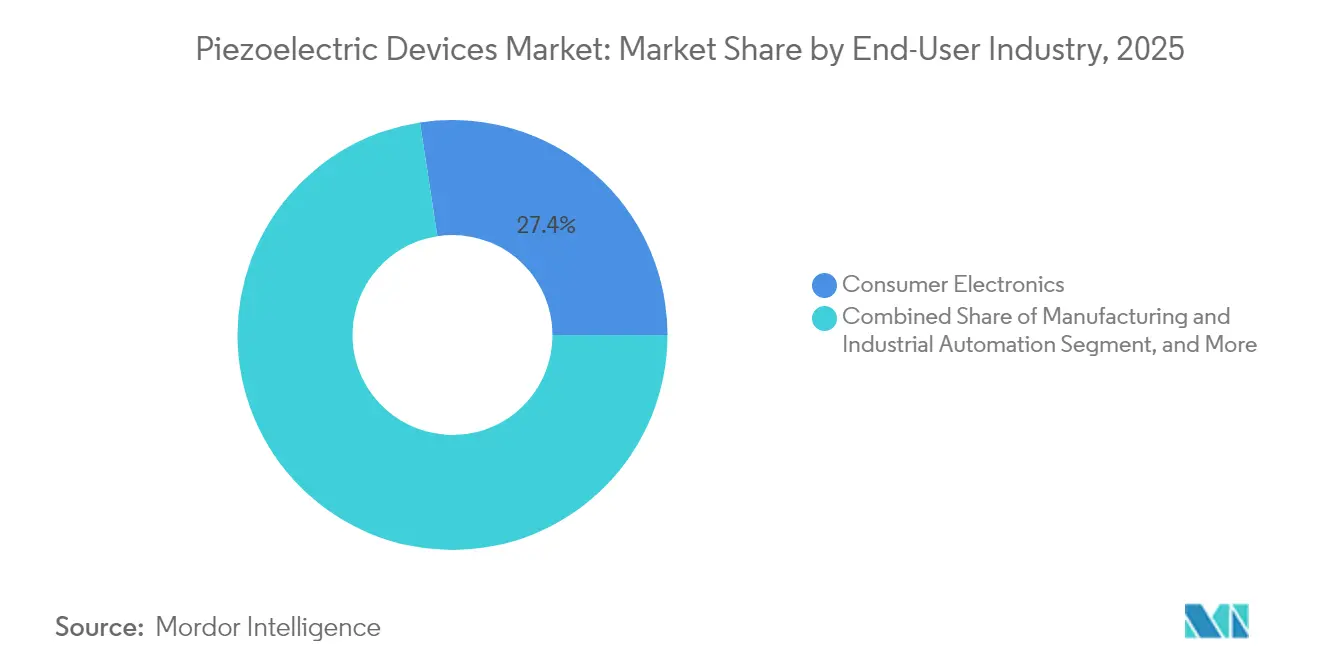
Consumer electronics generated 27.42% of 2025 revenue as smartphones, wearables, and gaming accessories demanded compact RF filters and haptic drivers. Automotive and transportation is the fastest-rising vertical at a 7.55% CAGR, driven by electrified powertrains and autonomous features that consume high-stroke actuators and robust sensors. Healthcare embraces miniaturized pumps and ultrasound to deliver targeted therapies; aerospace prioritizes high-temperature, high-Q parts for avionics and propulsion monitoring.
TDK’s automotive sensor turnover expanded more than 12% year on year, proof that EV adoption translates into sustained component pull. Piezo micropumps dispense drugs at 4.0 mL/min with 0.28 µL dose resolution, revealing healthcare’s premium segment potential. Industry 4.0 equipment depends on predictive-maintenance sensors embedded in drives and gearboxes, while telecom players scale filter volumes in tandem with new spectrum allocations. This multi-vertical appetite secures long-term expansion for the piezoelectric devices market.
By Operating Mode: Temperature Resilience Drives Aerospace Adoption
Polymer films such as PVDF suffer coefficient drops above 100 °C, reaching only 4 pC/N after four hours near 140 °C, which limits their use on high-speed aircraft. One-sided heating between 90 °C and 110 °C temporarily raises coefficients nearly 40%, revealing integration windows during CMOS backend processes. Space-environment trials under vacuum UV and gamma rays show PVDF maintains baseline functionality but not peak performance.
Porous PTFE electrets retain 600 pC/N even at elevated temperatures, rivaling PZT while resisting thermal drift. Novel polyimide-based laminates reach magnetoelectric outputs of 0.35 V/cm·Oe at 200 °C, matching aerospace goals for turbine-blade monitoring. These gains confirm that materials formulated for high-temperature resilience will carve a solid niche within the broader piezoelectric devices market.
Geography Analysis
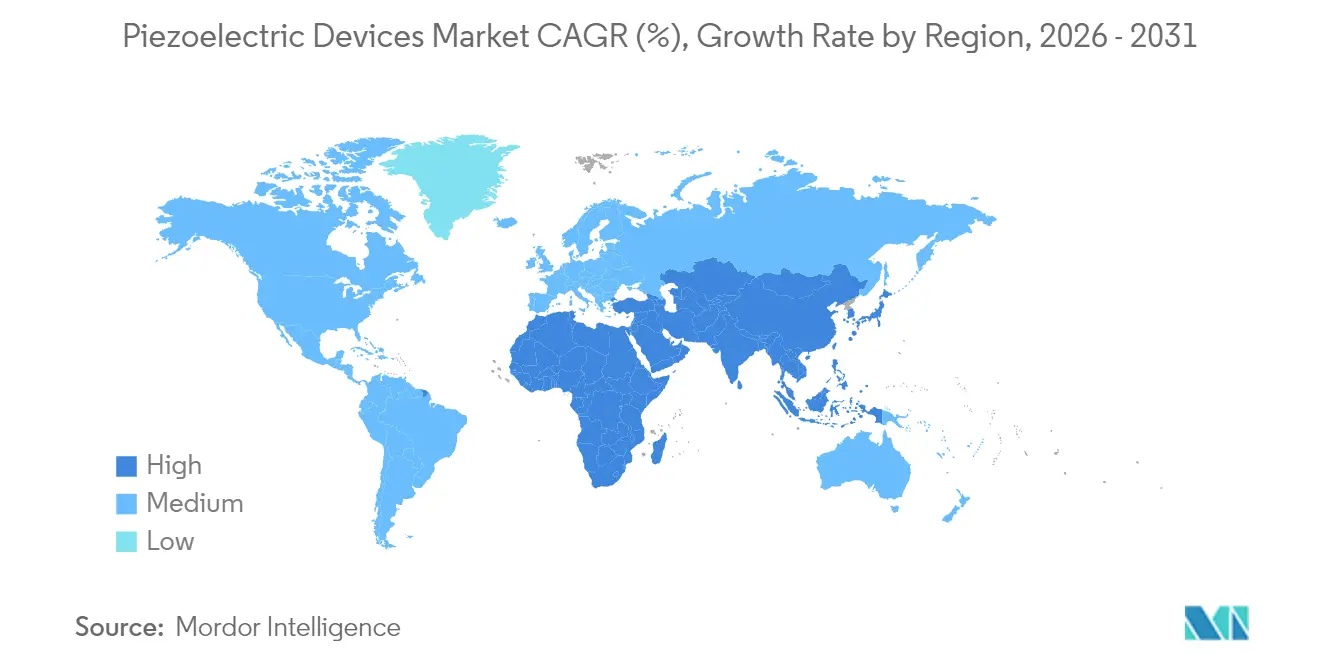
Asia-Pacific held 38.46% of global revenue in 2025, driven by scale advantages in handset assembly, automotive electrification, and fast 5G rollouts. China and South Korea advance smart ultrasonic meters and miniaturized RF filters, while Japan’s Murata, TDK, and Kyocera channel deep ceramics expertise into higher-margin multilayer components. India and Southeast Asia attract sensor assembly for cost-sensitive goods, whereas Australia’s mining firms deploy energy harvesting for asset monitoring. Rising labor costs spur automation investments, reinforcing premium piezo demand.
North America ranks second in value, underpinned by defense and aerospace programs that require hypersonic-grade ceramics. The Department of Defense earmarked SBIR 24.1 funds for additively manufactured textured piezo components, sparking domestic R&D. Canadian resource sites specify rugged harvesters for remote wells, and US chip fabs expand precision-stage adoption. Physik Instrumente opened a 120,000 sq ft Massachusetts plant to meet 30-50% annual US demand growth. Mexico’s vehicle plants integrate piezo injectors and ADAS haptic modules, given supply chain proximity.
Europe leverages stringent environmental rules and luxury-car production to drive lead-free ceramics and next-gen actuators. German OEMs embed piezo suspensions and injectors; Nordic utilities incorporate grid sensors; France’s aerospace sector demands high-temperature single crystals. The Middle East and Africa region posts the highest CAGR at 8.14% to 2031 as Gulf pipelines, smart cities, and solar parks deploy pipeline vibration harvesters and infrastructure flow meters. Supply diversification efforts in Africa could evolve into upstream material advantages over the forecast horizon.

Regulatory Landscape
Compliance is shaped by materials restrictions and device-level standards that affect both ceramics (notably PZT) and thin-film piezoMEMS used in RF, sensing, and energy-harvesting modules. In the European Union, the RoHS Directive 2011/65/EU restricts hazardous substances in electrical and electronic equipment, and current Annex III exemptions (including exemption 7(c)-I for lead in PZT-based piezoelectric ceramics) remain a key dependency for suppliers serving EU-bound consumer electronics, automotive, and industrial products. REACH (EC) No 1907/2006 also adds substance notification and SVHC obligations that influence material selection, documentation, and supplier qualification for lead-containing chemistries.
At the performance and interchangeability level, IEC standards maintained under IEC TC 49 (piezoelectric, dielectric, and electrostatic devices) set outlines, testing, and category definitions used across global supply chains. These include IEC 63041-1:2021 (piezoelectric sensors), IEC 61240:2016 (SMD outlines), and IEC 62830-1:2017 (energy harvesting). For products integrated into RF front ends and other electronics, electromagnetic compatibility requirements shape design and validation, and in the United States FCC Title 47 Part 15 sets conducted and radiated emission limits for intentional and unintentional radiators, affecting module shielding, packaging, and qualification workflows for OEM programs.
Value Chain Analysis
The value chain starts with upstream raw materials and specialty chemistries, including lead-based and lead-free ceramics, as well as piezoelectric polymers such as PVDF. It then moves through powder processing, tape casting or thin-film deposition, and wafer or substrate preparation for piezoMEMS. A key midstream layer is specialized substrates and thin-film stacks for RF and MEMS manufacturing, where wafer suppliers and process partners enable high-volume, high-yield production. A visible example is Soitec's March 2026 multi-year agreement to supply Piezoelectric-On-Insulator (POI) wafers for Skyworks Solutions' Sky5 platform, which links substrate qualification to downstream module performance for smartphone RF front ends.
Downstream, device makers and module integrators package piezo elements into finished sensors, actuators, transducers, resonators, generators, and energy-harvesting units that ship as discrete components or embedded modules inside smartphones, automotive systems, industrial motion platforms, and medical devices. Collaboration-driven ecosystems matter increasingly for lead-free and miniaturized piezoMEMS, including STMicroelectronics expanding its Lab-in-Fab collaboration in Singapore with A*STAR and ULVAC (May 2025) to advance lead-free piezoMEMS (including PMUTs and miniaturized speakers). Distribution typically runs through direct OEM engagements for automotive, defense, and industrial platforms, while consumer electronics and telecom modules rely on tightly managed qualification cycles and long-term capacity planning, with bottlenecks concentrated in thin-film deposition complexity and supply dependencies for certain critical inputs.
Competitive Landscape
The piezoelectric devices market remains moderately concentrated. TDK, Murata, Kyocera, and Physik Instrumente rely on vertical integration, enabling control from raw powders to packaged modules. TDK generated USD 14.6 billion revenue in fiscal2024, with PowerHap actuator and automotive sensor lines outpacing group averages and targeting a 15% return on invested capital by 2027. Kyocera allocated USD 469 million for a Nagasaki ceramics plant that will ship fine components worth 25 billion yen annually by 2030, underscoring management’s confidence in semiconductor-driven demand. Murata reported a 6.3% revenue rise to 1.743 trillion yen in fiscal 2025, powered by multilayer capacitors for mobility platforms.
Strategic acquisitions broaden portfolios: CTS absorbed Noliac, Ferroperm, and SyQwest to scale medical, industrial, and underwater acoustics exposure. Smaller specialists differentiate through material breakthroughs, such as Datwyler’s electroactive polymer actuators that cut power draw and eliminate audible noise. Process innovations like synchronized floating-potential HiPIMS create ultra-dense thin films that unlock chip-scale filters and resonators. Patent filings concentrate on tunable phononic crystals and hybrid compositions that address specific customer pain points over mass-volume plays, indicating a shift toward value-driven competition.
White-space opportunities emerge in energy harvesters and lead-free materials. Polymer-based nanogenerators, high-temperature ceramic blends, and oxide recyclers give new entrants scope to circumvent scale advantages held by incumbents. End-market diversification and regional sourcing strategies reduce geopolitical material risks, while deeper collaboration among defense agencies, automotive tier-ones, and telecom operators influences future supplier rankings within the piezoelectric devices market.
Piezoelectric Devices Industry Leaders
Aerotech Inc.
Physik Instrumente (PI) GmbH & Co. KG.
APC International Ltd.
piezo.com
Morgan Advanced Materials
- *Disclaimer: Major Players sorted in no particular order

Market Opportunities and Future Outlook
Material transitions and wafer-scale integration create whitespace in high-frequency RF and sensor platforms where performance, footprint, and compliance intersect. One opportunity area is CMOS-compatible, wafer-scale piezoelectric thin films that support next-generation RF front ends and compact acoustic devices, after June 2026 research demonstrated bilayer ferroelectric AlScN (Al0.64Sc0.36N) integrated on 200 mm silicon wafers, with reported d33,f > 26.8 pm/V and e31,f > 4.6 C/m2. In parallel, June 2026 work on resonators reported quality-factor advances for 3 to 5 GHz bands using single-crystal lithium niobate on silicon carbide (self-aligned nanorod BAW resonators reporting Q up to 1943), pointing to higher-Q, lower-loss RF filtering and timing components for smartphone and telecom spectrum needs.
A second opportunity is commercialization of lead-free piezoMEMS and lead-free ceramics across consumer, industrial, and automotive programs as RoHS and REACH compliance pressure reshapes qualification requirements and dual-supply strategies. Industry activity already provides on-ramps, including STMicroelectronics expanding the Lab-in-Fab collaboration in Singapore with A*STAR and ULVAC (May 2025) to advance lead-free piezoMEMS (PMUTs and miniaturized speakers). Arkema also highlighted industrial collaboration with Alqio (ARMOR GROUP) using ISO 8 cleanroom facilities in La Chevroliere, France (April 2026) around printed electronics with Piezotech piezoelectric polymers. Together, these moves support adoption of lead-free polymers and ceramics in compact sensors, haptics, and ultrasonic devices, while creating new supplier qualification and manufacturing-service opportunities for firms that can translate lab-scale materials into reliable, high-volume device fabrication.
Recent Industry Developments
- January 2026: Physik Instrumente (PI) launched the 6D NanoCube positioning system targeting photonics and silicon photonics alignment. The system supports PI's nanopositioning portfolio where piezo-flexure stages are used in high-throughput optics and semiconductor manufacturing workflows.
- November 2025: Aerotech launched Automation1-HXA4 and Automation1-iHXA4 hexapod drives to broaden access to high-performance hexapod control. The expanded motion-control capability supports precision tools that commonly rely on piezoelectric stages and actuators in semiconductor, photonics, and advanced manufacturing.
- September 2024: Physik Instrumente completed a EUR 20 million expansion at its Eschbach site to triple piezo capacity for semiconductor and laser markets. The capacity increase supports shorter lead times and higher-volume supply for precision positioning applications that depend on piezoelectric devices.


Research Methodology Framework and Report Scope
Market Definition and Coverage
This market covers revenue generated from piezoelectric devices that convert mechanical energy to electrical energy, or electrical energy to mechanical movement, using the piezoelectric effect. We count finished devices and modules sold into end uses such as sensing, actuation, and transduction across industries.
Scope exclusions: Raw piezoelectric materials and intermediate forms such as powders, green tapes, and unfired wafers are excluded when they are sold only as inputs.
Segmentation Overview
- By Product Type
- Actuators and Motors
- Sensors
- Transducers
- Generators
- Energy Harvesters
- Resonators
- By Material
- Ceramics
- Single-Crystal
- Polymers (e.g., PVDF)
- Composites/Others
- By Operating Mode
- Compression/d33 Mode
- Shear/d15 Mode
- Bending/d31 Mode
- Thickness-Mode Ultrasonic
- By End-user Industry
- IT and Telecommunication
- Consumer Electronics
- Manufacturing and Industrial Automation
- Automotive and Transportation
- Healthcare and Medical Devices
- Aerospace and Defense
- Energy and Utilities
- By Geography
- North America
- United States
- Canada
- Mexico
- Europe
- Germany
- United Kingdom
- France
- Nordics
- Rest of Europe
- South America
- Brazil
- Rest of South America
- Asia-Pacific
- China
- Japan
- India
- South-East Asia
- Rest of Asia-Pacific
- Middle East and Africa
- Middle East
- Gulf Cooperation Council Countries
- Turkey
- Rest of Middle East
- Africa
- South Africa
- Rest of Africa
- Middle East
- North America
Data Sources, Market Sizing, and Validation
Desk Research
Desk research is used to map the demand signals and supply context that sit behind piezoelectric device shipments and pricing. Common starting points include public trade and production statistics, such as UN Comtrade for cross border flows, national statistical offices for industrial output trends, and customs or tariff schedules that help validate product classifications.
To keep assumptions realistic, we also review technical and application context from sources such as IEEE and other peer reviewed journals, patent databases to see where device designs are being commercialized, and standards or guidance from bodies such as ISO or IEC where relevant. Annual reports, 10-K style filings, investor decks, and trusted industry news are then used to cross check end market exposure and directional pricing, with selective use of paid subscriptions for company financials, news intelligence, and patent coverage. These desk sources are illustrative only, and we rely on other public references for additional data collection, validation, and clarification.
Primary Interviews and Surveys
Primary work is used to test the definition, confirm which device revenues belong inside the market, and stress test pricing and mix shifts by application. We speak with a mix of device manufacturers, component and module suppliers, integrators, and downstream users, and we keep the respondent mix balanced across APAC, EMEA, and the Americas so regional production and demand patterns are not overstated.
Distribution of primary research fieldwork respondents
| Company type | Respondent position | Region |
|---|---|---|
| Top tier: 33% | CXOs: 12% | APAC: 39% |
| Mid tier: 52% | Functional/Unit leaders: 34% | EMEA: 35% |
| Smaller Players: 15% | Managers: 54% | Americas: 26% |
Market-Sizing & Forecasting
Sizing starts with a top-down build where production and trade signals are used to reconstruct the served demand pool for piezoelectric devices, then adjusted using application level adoption patterns. Once the structure is in place, we corroborate totals with selective bottom-up checks, such as sampled average selling price ranges multiplied by shipment volumes for key device categories, and channel checks to catch double counting between modules and finished devices.
Inputs that influence the model include electronics production indicators, automotive and industrial automation output trends, medical imaging procedure volumes that drive ultrasound probe demand, RF filter and resonator pull from communications equipment cycles, and observed ASP progression by device form factor and material mix. For forecasting, we use scenario analysis so the base case reflects what industry participants expect for capacity additions, adoption timing, and pricing changes, then we add sensitivity cases for faster or slower electronics and vehicle cycles. Where bottom-up coverage is thin in smaller applications, gaps are handled with conservative penetration ranges that are validated in interviews and checked against adjacent demand indicators.
Data Validation & Update Cycle
Validation is done by checking the model against independent signals, such as regional manufacturing output, trade directionality, and application level shipment trends, and then explaining any variances before finalization. Outliers are reviewed in multiple steps, including internal analyst checks on unit economics, year over year movements, and currency consistency, followed by a final review before sign-off.
The dataset is refreshed on an annual schedule, and interim updates are triggered when material events occur, such as major capacity expansions, regulatory changes affecting medical devices, or sharp input cost moves that alter device pricing. Before delivery, we run a final pass to ensure recent public data and expert feedback are reflected, so clients receive an updated view rather than an older snapshot.
Mordor Intelligence's Piezoelectric Devices Market Size Compared Against Other Published Estimates
Published market sizes for piezoelectric devices can look far apart even when they appear to cover the same scope. These gaps usually come from different product boundaries, different base years, and pricing and currency assumptions updated at different points in time.
In this market, the biggest gap drivers tend to be whether embedded modules are counted at the device level or rolled into the value of the larger system, and whether raw piezo materials are included alongside finished devices. Differences also come from how quickly ASPs are assumed to rise or fall in high volume electronics uses, and whether the forecast reflects a base case versus a more aggressive adoption path in automotive and industrial automation.
Benchmark comparison
| Source | Market Size | Gaps in Research Methodology |
|---|---|---|
| Mordor Intelligence | USD 32.89 B (2025) | |
| Industry Research Group A | USD 35.50 B (2024) | Uses a different base year and tends to describe scope with broader device form factors and materials, without clearly separating finished devices from adjacent system value in all applications. |
| Industry Research Group B | USD 32.10 B (2024) | Publishes a lower base-year value that appears more conservative on near-term adoption and pricing, and it does not consistently clarify treatment of embedded modules versus full end systems across applications. |
The table shows that the spread is largely explained by base-year choice and what gets counted as a device versus part of a larger system. In Mordor Intelligence's model, the value is limited to finished piezoelectric devices and modules while excluding raw piezo materials sold only as inputs. When these boundaries are applied and then checked against practical demand signals and interview feedback, the result is a market size that is easier to trace back to clear drivers and update year to year without hidden scope creep.


Key Questions Answered in the Report
What is the current size of the piezoelectric devices market?
The piezoelectric devices market size stood at USD 34.95 billion in 2026.
How fast will the piezoelectric devices market grow through 2031?
The market is projected to expand at a 6.23% CAGR, reaching USD 47.29 billion by 2031.
Which product segment is growing the quickest?
Energy harvesters represent the fastest-growing product segment with a 8.72% CAGR.
Which region leads global revenue?
Asia-Pacific holds the largest regional share at 38.46%, supported by consumer-electronics and telecom manufacturing strength.
Why are lead-free ceramics important for future growth?
European environmental regulations are accelerating the shift from PZT to lead-free alternatives, prompting global suppliers to invest in potassium sodium niobate and bismuth sodium titanate lines despite higher costs.
What are the main supply-chain risks?
Concentrated niobium and lithium supplies expose manufacturers to price swings and geopolitical disruptions, especially for defense-grade piezoceramics.
Page last updated on:


 Your data is secure and never sold or shared.


