Dental 3D Printing Market Size and Share
Market Overview
| Study Period | 2020 - 2031 |
|---|---|
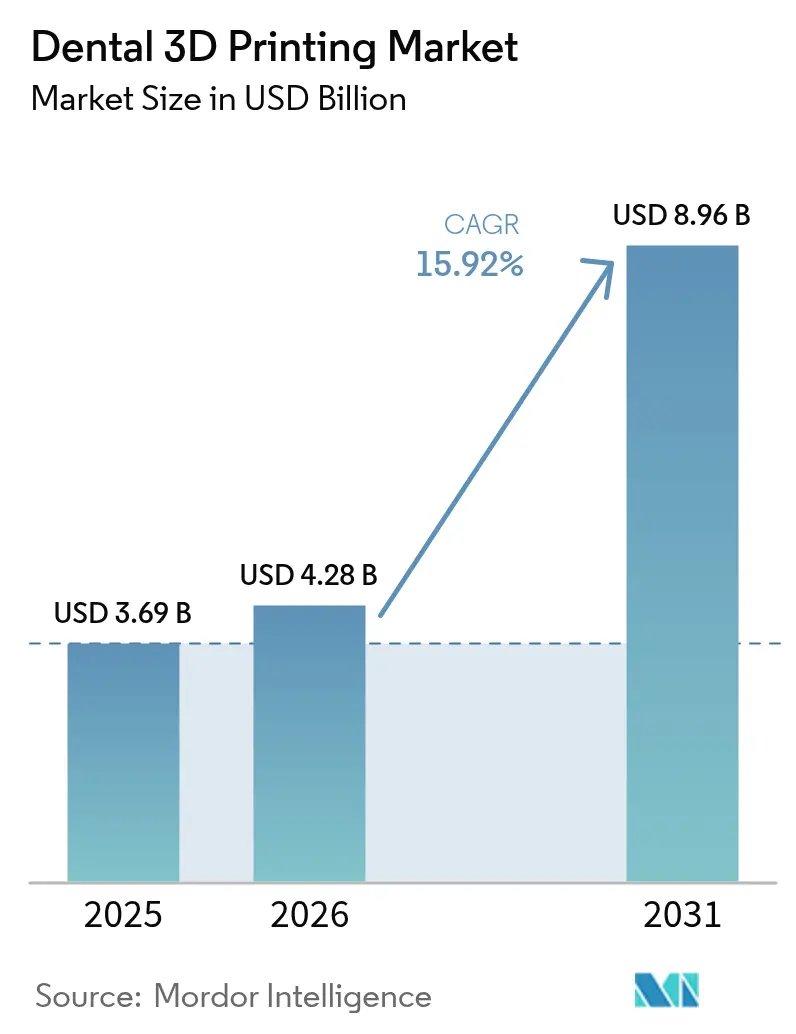
| Market Size (2026) | USD 4.28 Billion |
| Market Size (2031) | USD 8.96 Billion |
| Growth Rate (2026 - 2031) | 15.92% CAGR |
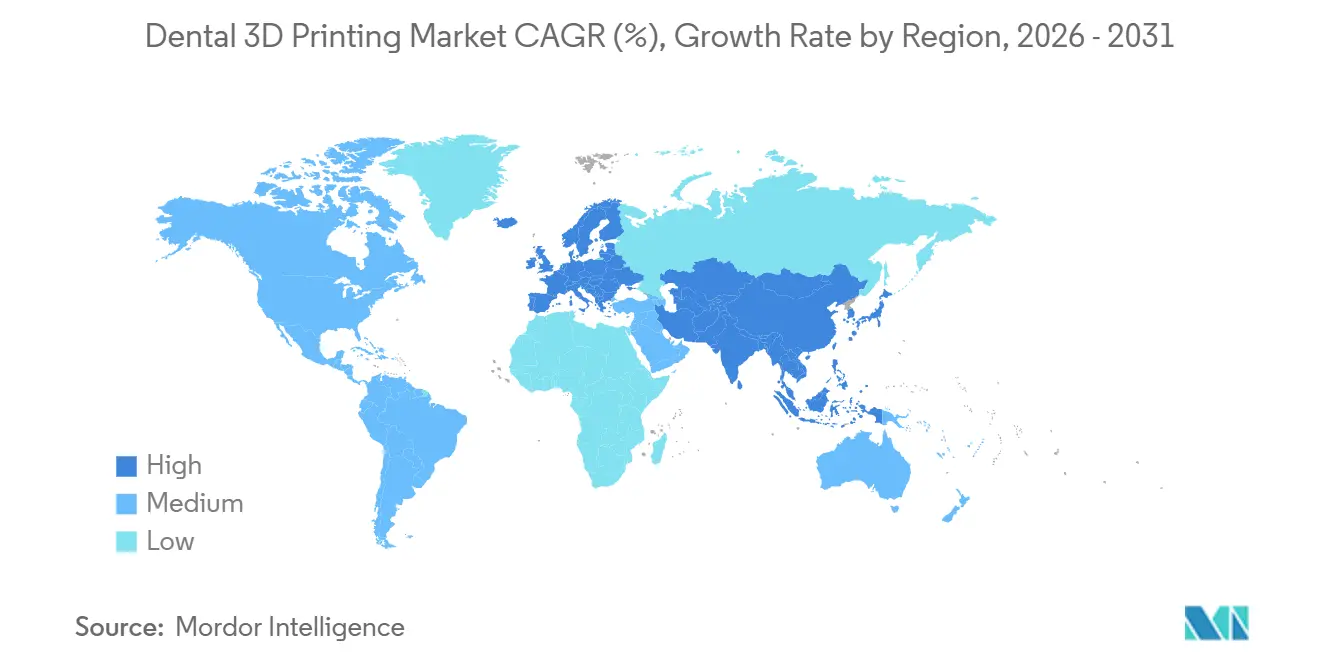
| Fastest Growing Market | Asia-Pacific |
| Largest Market | North America |
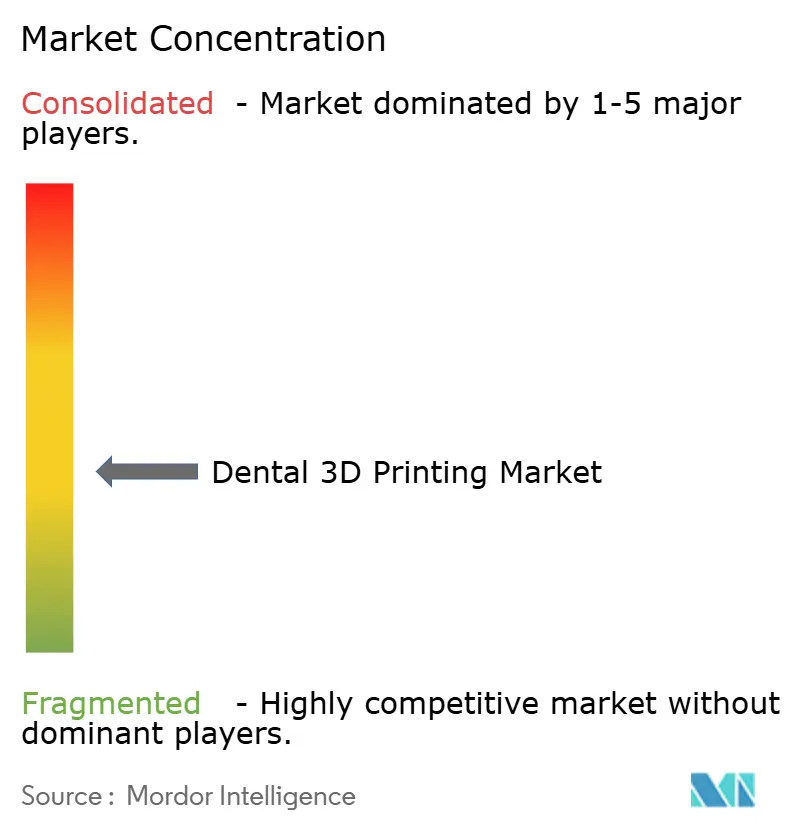
| Market Concentration | Medium |
Major Players *Disclaimer: Major Players sorted in no particular order Image © Mordor Intelligence. Reuse requires attribution under CC BY 4.0. | |
Dental 3D Printing Market Analysis by Mordor Intelligence
The Dental 3D Printing Market size is expected to grow from USD 3.69 billion in 2025 to USD 4.28 billion in 2026 and is forecast to reach USD 8.96 billion by 2031 at 15.92% CAGR over 2026-2031.
Faster chairside production, falling resin costs, and a widening menu of FDA-cleared Class II materials are converging to lift adoption across laboratories and clinics. Same-day workflows that merge intra-oral scanners with Digital Light Processing (DLP) printers shorten the delivery of single-unit crowns from 2 weeks to roughly 90 minutes, creating a patient-experience premium that practices can monetize. Service bureaus are scaling rapidly because outsourcing lowers capital risk for smaller offices and unlocks access to metal frameworks that desktop systems cannot fabricate. Regionally, North America still accounts for the largest revenue, yet Asia-Pacific is setting the growth pace as China’s oral health action plan and Japan’s aging population expand restorative demand.
Key Report Takeaways
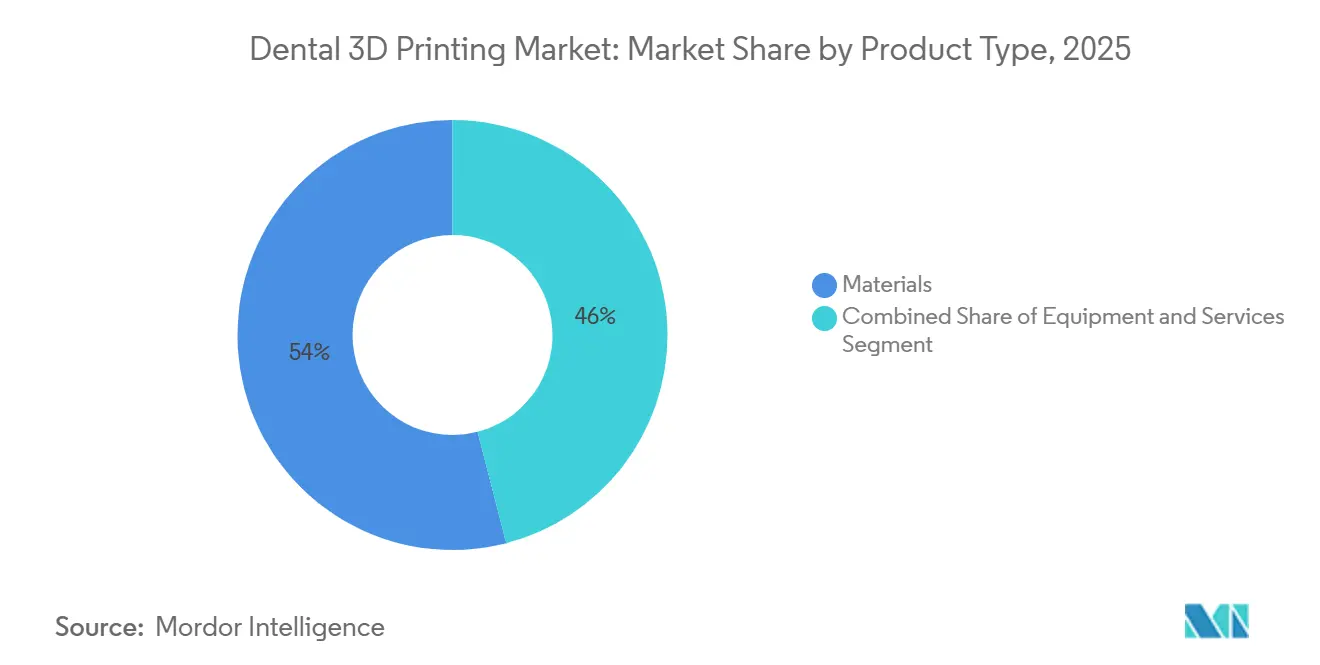
- By product type, materials led with 54.02% of 2025 revenue, while services are advancing at a 16.61% CAGR through 2031.
- By printing technology, stereolithography held 34.27% of the 2025 volume, and Digital Light Processing is forecast to grow at a 17.65% CAGR through 2031.
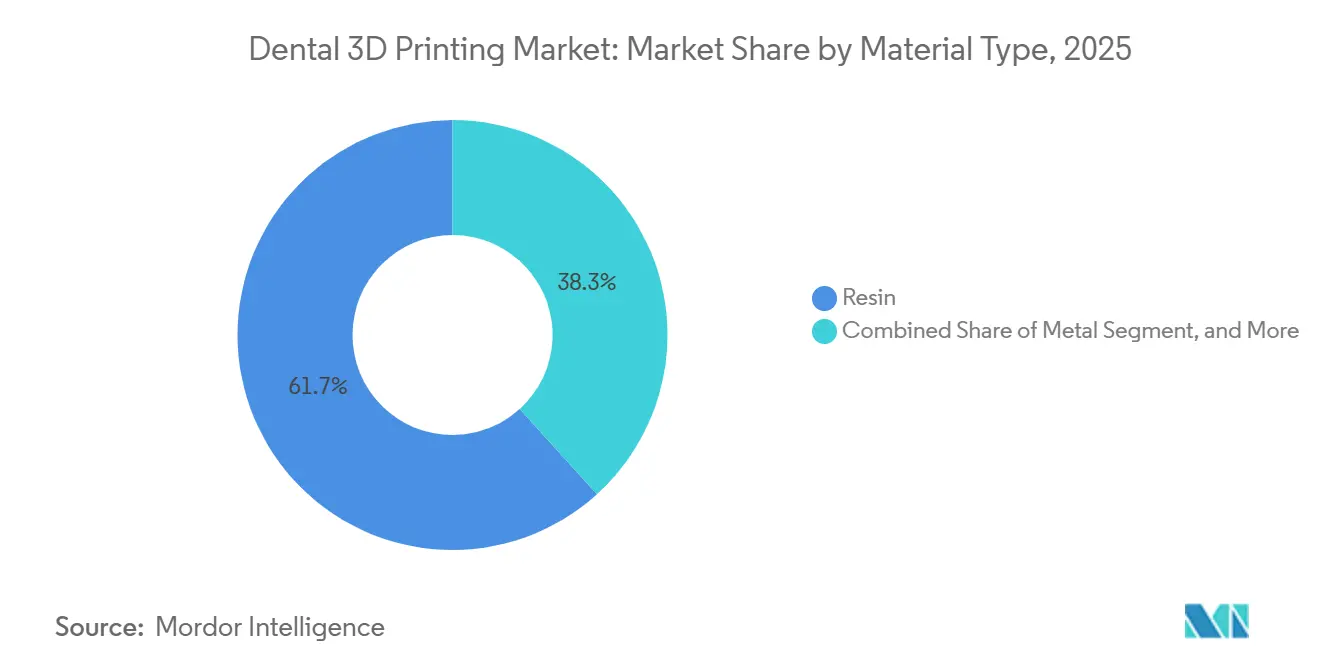
- By material, resins captured 61.72% of 2025 revenue, and metal powders are climbing at a 19.23% CAGR during 2026-2031.
- By application, prosthodontics accounted for 41.08% of 2025 revenue, whereas orthodontics is projected to expand at an 18.79% CAGR through 2031.
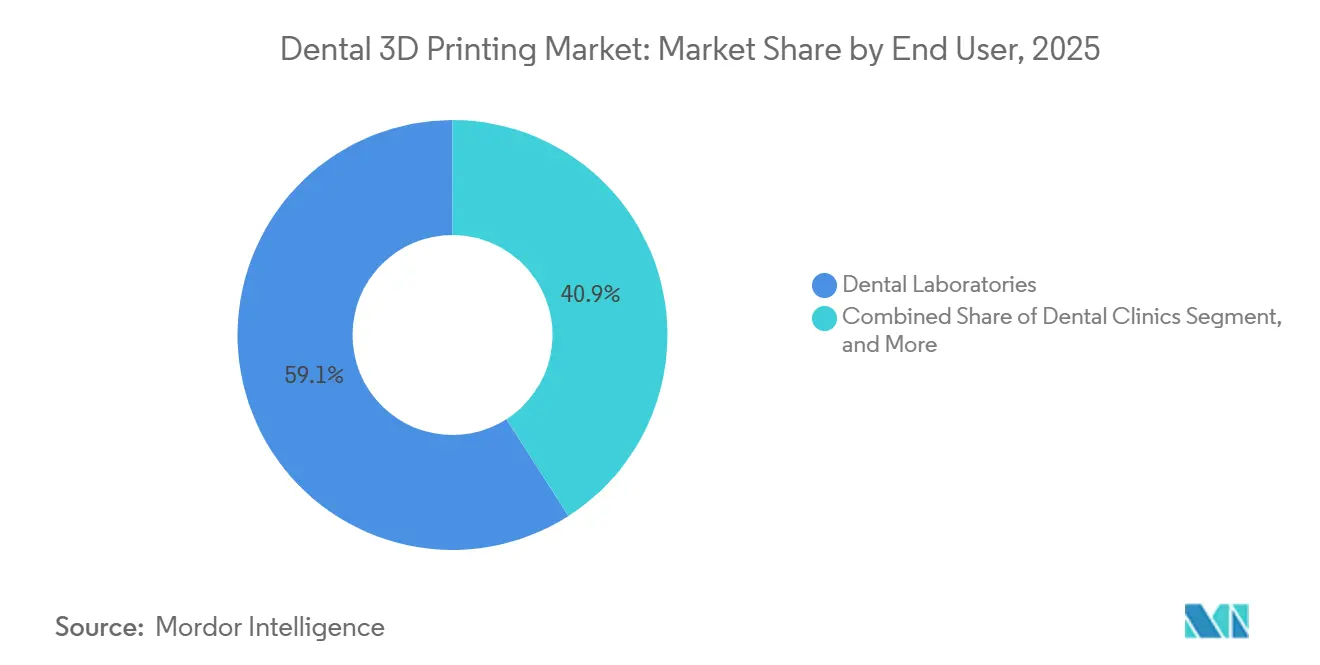
- By end user, dental laboratories accounted for 59.08% of 2025 revenue, but clinics are expected to post a 20.03% CAGR through 2031.
- By geography, North America held 37.18% of 2025 revenue; Asia-Pacific is on track for an 18.51% CAGR over 2026-2031.
Note: Market size and forecast figures in this report are generated using Mordor Intelligence’s proprietary estimation framework, updated with the latest available data and insights as of 2026.
Global Dental 3D Printing Market Trends and Insights
Drivers Impact Analysis*
| Driver | (~) % Impact on CAGR Forecast | Geographic Relevance | Impact Timeline |
|---|---|---|---|
| Rising Demand for Cosmetic Dentistry & Aesthetic Restorations | +3.2% | North America, Western Europe, urban Asia-Pacific hubs | Medium term (2-4 years) |
| Increasing Adoption of Clear Aligners & Customized Prosthetics | +2.8% | North America and Asia-Pacific; emerging Middle East & Latin America | Short term (≤ 2 years) |
| Cost Reduction & Accuracy Improvements in Dental 3D Printers | +2.5% | Global, early gains in North America and Europe | Medium term (2-4 years) |
| Chairside Intra-Oral-Scanner Integration Enabling Same-Day Restorations | +2.1% | North America, Europe, accelerating in Japan, South Korea, Australia | Short term (≤ 2 years) |
| Eco-Friendly Bio-Resorbable Resins Demand | +1.4% | Europe and North America | Long term (≥ 4 years) |
| Increasing Incidence of Dental Caries & Edentulism | +2.6% | Global, highest growth in South-East Asia and Western Pacific | Long term (≥ 4 years) |
| Source: Mordor Intelligence | |||
Rising Demand for Cosmetic Dentistry & Aesthetic Restorations
Cosmetic procedures have moved from luxury to expectation, especially among millennials and Gen Z cohorts who link career success to smile aesthetics. DLP resins now ship with 16-shade Vita libraries and tunable translucency, letting labs replicate dentin halos in a single print run while slashing finishing labor.[1]Various Authors, “Accuracy of 3D Printed Dental Models,” MDPI Prosthesis, mdpi.com A four-unit anterior bridge costs USD 8-12 in resin and 90 minutes of machine time, versus USD 40-60 for zirconia blanks and 4 hours of milling. Social media exposure, exemplified by 2.1 million #veneers posts in 2025, continues to drive chairside demand. ISO 20795-1 now explicitly covers additive denture polymers, smoothing regulatory paths for new cosmetic materials. Practices that advertise same-day veneers report 15-20% higher case acceptance rates than peers who still rely on lab-based porcelain.
Increasing Adoption of Clear Aligners & Customized Prosthetics
Clear-aligner treatment started at over 15 million in 2025, each requiring 20-40 printed staging models. Mass customization is also spreading to partial dentures, where finite-element modeling tailors clasp forces and reduces enamel wear. Price elasticity drives uptake in emerging markets: Indian clinics sell a flexible-printed denture for USD 80-120, undercutting acrylic by 35%. The FDA’s 2024 point-of-care guidance allows orthodontists to print retainers on-site, compressing delivery from 10 days to same-day.[2]U.S. Food and Drug Administration, “Technical Considerations for Additive Manufactured Medical Devices,” fda.gov Implant crowns with patient-specific emergence profiles show 18-22% lower tissue inflammation, underscoring the additive’s clinical edge.
Cost Reduction & Accuracy Improvements in Dental 3D Printers
Desktop DLP units costing under USD 4,000 now achieve 35-micron XY resolution and 50-micron layers. LED light engines sourced from consumer electronics drive the cost slide. A 2025 study found an apical deviation of 0.87 mm with printed guides versus 1.12 mm with milled PMMA, reducing nerve-injury risk by 22%. Resin prices halve to USD 90-120 per liter between 2023 and 2026, while automated wash stations reclaim 85-90% of isopropanol. Selective-laser-melted cobalt-chromium now yields ±25-micron tolerance, eliminating chairside soldering and reducing per-case labor by 45 minutes.
Chairside Intra-Oral-Scanner Integration Enabling Same-Day Restorations
Primescan Connect and TRIOS 5 export STL files directly to printers via encrypted cloud links, reducing crown cycles to under 2 hours. AI detects undercuts and adds supports, trimming technician input to a brief final check. German insurers began reimbursing same-day crowns in 2025, provided flexural strength exceeds 100 MPa. A 24-month trial reported 96.2% survival for printed composite crowns, matching milled ceramic but at one-third the material cost. Eliminating physical impressions frees 18-25 minutes of staff time per case, adding two extra appointments per day for a solo practitioner.
Restraints Impact Analysis*
| Restraint | (~) % Impact on CAGR Forecast | Geographic Relevance | Impact Timeline |
|---|---|---|---|
| High Capital Investment & Maintenance | −1.8% | India, Southeast Asia, Latin America, Africa | Short term (≤ 2 years) |
| Regulatory Variability for Material Certification | −1.2% | EU, China, emerging markets | Medium term (2-4 years) |
| IP Concerns Around Intra-Oral Scan Data/Files | −0.8% | North America and Europe | Medium term (2-4 years) |
| Shortage of Trained Digital Dental Technicians | −1.1% | North America, Western Europe, urban Asia-Pacific | Short term (≤ 2 years) |
| Source: Mordor Intelligence | |||
High Capital Investment & Maintenance
A full chairside setup costs USD 35,000-50,000 and includes a scanner, printer, post-cure, wash station, and CAD licenses. Consumables add USD 1,800-2,500 annually, and resin-tank and LCD replacements compound expenses. Leasing options remain scarce in price-sensitive markets where credit costs are high; foreign-exchange swings lift USD-denominated leases by up to 25% in local currency. Return on investment extends beyond 2 years for offices handling fewer than 40 cases per month. Disposal of resin waste, classified as hazardous in the EU, costs EUR 150-200 per quarter, further eroding margins.
Regulatory Variability for Material Certification
Clearance takes 6-9 months under the FDA’s predicate pathway but 18-24 months in the EU, where MDR requires full clinical-evaluation reports. China’s NMPA upgraded long-term dental resins to Class III in 2024, aligning them with implant devices and delaying market entry by a year. Japan’s PMDA insists on cytotoxicity assays on five-year-old specimens, whereas Brazil’s ANVISA accepts real-time stability data, forcing suppliers into redundant test cycles. Smaller formulators lacking regulatory staff cede market share to OEMs that amortize compliance costs across larger portfolios.
*Our forecasts treat driver/restraint impacts as directional, not additive. The impact forecasts reflect baseline growth, mix effects, and variable interactions.
Segment Analysis
By Product Type: Services Outpace Equipment on Outsourcing Wave
Services are emerging as the fastest-growing slice of the Dental 3D Printing market, advancing at a 16.61% CAGR as practices favor per-case fees over capital purchases. Materials still generated 54.02% of 2025 revenue because every printed crown or aligner model consumes resin, solvent, and build trays. Equipment demand remains healthy among large labs, yet the outsourcing model allows solo offices to access selective laser melting of titanium without spending USD 200,000 on hardware. This pivot aligns with broader healthcare trends toward asset-light operations. Bureau operators leverage scale benefits, buying resin at bulk discounts and running multi-printer farms overnight to keep utilization above 80%. The shift also lifts software subscriptions for cloud-based design portals that link dentists directly to off-site printers, reducing administrative friction. Regulatory nuance shapes uptake; Japan’s facility-registration rules push clinics toward external service centers, while the FDA’s point-of-care exemption in the United States nudges some offices back to do-it-yourself workflows, creating a patchwork adoption map.


By Printing Technology: DLP Gains on Resolution and Speed
Stereolithography accounted for 34.27% of global volume in 2025, thanks to an early lead and a broad resin catalog. Digital Light Processing, however, will record a 17.65% CAGR as clinics prize its 5-second layer cure and sub-50-micron resolution, which minimizes post-finish polishing. DLP’s build rates of 30-40 mm per hour make it indispensable for overnight aligner-model batches where labs output up to 1,000 arches. PolyJet remains a premium niche, prized for multi-material dentures but limited by USD 400-per-liter jets and high support-material waste. Fused Deposition Modeling lingers in orthodontic models, yet its Dental 3D Printing market share is shrinking as DLP unit prices converge toward USD 3,000-4,000. ISO protocols favor resins’ mechanical properties, further pressuring FDM.
By Material Type: Metal Printing Accelerates on Implant Demand
Resins accounted for 61.72% of 2025 revenue and will continue to dominate unit volumes, as every provisional crown, nightguard, or aligner model starts with photopolymer. Yet metal powders are slated for a 19.23% CAGR as titanium implant frameworks and cobalt-chromium RPD bases shift from casting to additive. Selective laser-melted titanium eliminates solder corrections, shaving 30-45 minutes off chairtime and boosting clinical accuracy. Ceramic additives remain niche due to shrinkage issues and six-figure equipment costs, but nanoparticle-reinforced hybrid resins now challenge zirconia in flexural strength. Meanwhile, bio-based resins derived from soybean or castor oil command modest premiums in Scandinavia, in line with carbon-footprint labels effective since 2025.
By Application: Orthodontics Surges on Clear-Aligner Tailwinds
Prosthodontics led with 41.08% of 2025 revenue, encompassing crowns, bridges, and dentures. Orthodontics, however, will log an 18.79% CAGR, fueled by clear-aligner growth and 3D-printed indirect-bonding trays that cut bracket-placement time to ten minutes. Surgical guides, though smaller in dollars, underpin high-value implant cases, where a USD 200 guide can prevent a USD 50,000 malpractice claim. Patient-specific implant abutments reduce bone loss and command premiums over stock components. Each application carries distinct regulatory hurdles: orthodontists in the U.S. print retainers under practice-of-dentistry rules, whereas prosthodontic devices often require lab production and 510(k) pathways, shaping market structure.
By End User: Clinics Gain on Chairside Economics
Dental laboratories accounted for 59.08% of 2025 revenue, thanks to centralized batch printing, which keeps per-unit costs low. Clinics, however, are on a 20.03% CAGR as desktop printers under USD 5,000 enable same-day crowns that patients value. Larger dental-service organizations now build regional printing hubs serving 20-plus offices, capturing lab margins while retaining turnaround speed. Academic centers, though small in revenue, anchor innovation by shortening CAD learning curves through AI-assisted curricula.
Geography Analysis
North America contributed 37.18% of global 2025 revenue, supported by 68% intra-oral-scanner penetration and CDT billing codes that reimburse printed and milled restorations at parity. Fourteen new dental resins secured FDA clearance in 2025 alone, slashing approval cycles to eight months and widening material choice. Canada’s 2024 public-insurance expansion adds restorative demand for cost-sensitive removable prosthetics. Near-shoring sees U.S. labs opening facilities in Mexico to tap USD 12-18/hour CAD labor while maintaining 24-hour turnaround. Competitive intensity is high, squeezing resin gross margins to 40%.
Europe shows robust growth despite MDR friction, as standardized rules now span 27 markets. The NHS in England trialed three centralized printing hubs that cut denture queues from 14 to 5 days. Southern Europe is expected to catch up by 2025, with subsidies covering half of the equipment costs for practices in underserved areas. ISO working groups expect final denture-polymer standards by 2027, likely to further streamline continental rollouts.
Asia-Pacific is the fastest-growing region, forecast to grow at an 18.51% CAGR. China’s oral-health action plan targets 80% caries-treatment coverage by 2030, and domestic OEMs undercut Western rivals by 30-40% on price. Japan’s edentulous seniors drive implant overdenture demand, where metal printing halves framework costs. Indian corporate chains centralize labs to serve 50-100 clinics each, leveraging Ayushman Bharat’s denture benefits. Regulatory diversity persists; ASEAN states still require ten distinct approvals, elongating launches by a year.
The Middle East & Africa and South America offer emerging upside. GCC nations fund state-of-the-art digital labs to lure dental tourists. Brazil protects local industry through 18% import tariffs, but gains cost relief from domestic resin production. South African private clinics invest in printers for high-margin cosmetic procedures, but rural public facilities lag behind. Workforce shortages—fewer than 500 CAD-trained technicians across sub-Saharan Africa—limit capacity even when hardware is present.

Competitive Landscape
Market concentration is moderate. Align’s vertically integrated clear-aligner platform drives per-model costs 20% below third-party labs. Formlabs’ open-material policy attracted 30 third-party resins, differentiating it from closed systems. Stratasys doubled down on multi-material jetting after acquiring Desktop Metal, filing 14 dental patents in 2025 targeting single-pass denture fabrication.
SprintRay captured 12-15% of North American orthodontic-model printing by pricing desktop units below USD 5,000. 3D Systems leveraged its 18 FDA-cleared resins to maintain first-mover advantage in regulated markets. Regional disruptors such as UnionTech and Shining 3D dominate China by aligning with local reimbursement and NMPA protocols. M&A momentum will likely persist; private-equity funds are rolling up distributors and boutique material formulators to build scale before anticipated IPO exits. Technology roadmaps converge on closed-loop software that automates the processing of scan data, reducing technician touchpoints to under a minute and promising 10-15% labor savings by 2029.
Dental 3D Printing Industry Leaders
Desktop Metal
Formlabs Inc.
Renishaw plc
Stratasys Ltd.
3D Systems Corporation
- *Disclaimer: Major Players sorted in no particular order

Recent Industry Developments
- May 2025: Align Technology received NMPA approval in China for its Invisalign Palatal Expander System, opening the door for direct-printed devices in the world’s largest orthodontic pool.
- September 2024: 3D Systems secured FDA clearance for a multi-material monolithic jetted denture solution that streamlines full-arch manufacturing.
- July 2024: Stratasys introduced the DentaJet XL printer, cutting model-production costs by up to 67% for high-volume laboratories.
- April 2024: Formlabs launched Form 4 and Form 4B printers delivering up to 5x faster cycle times for dental models.


Global Dental 3D Printing Market Report Scope
As per the scope of this report, three-dimensional (3D) printing is an advanced manufacturing technology that uses computer-aided design (CAD) digital models to automatically create personalized 3D objects. Three-dimensional printing has a wide range of applications in dentistry, including prosthodontics, oral and maxillofacial surgery, and oral implantology, as well as orthodontics, endodontics, and periodontology. The report covers all aspects of 3D printing, from the materials used to the printers and scanners to create the final product. Furthermore, the scope includes services provided by market players to create customized products tailored to customer needs.
The Dental 3D Printing Market Report is Segmented by Product Type (Equipment, Materials, Services), Printing Technology (Stereolithography, Selective Laser Sintering, PolyJet/Material Jetting, Digital Light Processing, Fused Deposition Modelling), Material Type (Resin, Metal, Plastic/Polymer Filament, Ceramic), Application (Dental Implants, Prosthodontics, Orthodontics, Surgical Guides & Models), End User (Dental Laboratories, Dental Clinics, Academic & Research Institutes), and Geography (North America, Europe, Asia-Pacific, Middle East & Africa, South America). The market report also covers the estimated market sizes and trends for 17 different countries across major regions, globally. The report offers the value (in USD million) for the above segments.
| Equipment |
| Materials |
| Services |
| Stereolithography |
| Selective Laser Sintering |
| PolyJet / Material Jetting |
| Digital Light Processing |
| Fused Deposition Modelling |
| Resin |
| Metal |
| Plastic / Polymer Filament |
| Ceramic |
| Dental Implants |
| Prosthodontics |
| Orthodontics |
| Surgical Guides & Models |
| Dental Laboratories |
| Dental Clinics |
| Academic & Research Institutes |
| North America | United States |
| Canada | |
| Mexico | |
| Europe | Germany |
| United Kingdom | |
| France | |
| Italy | |
| Spain | |
| Rest of Europe | |
| Asia-Pacific | China |
| Japan | |
| India | |
| Australia | |
| South Korea | |
| Rest of Asia-Pacific | |
| Middle East & Africa | GCC |
| South Africa | |
| Rest of Middle East & Africa | |
| South America | Brazil |
| Argentina | |
| Rest of South America |
| By Product Type | Equipment | |
| Materials | ||
| Services | ||
| By Printing Technology | Stereolithography | |
| Selective Laser Sintering | ||
| PolyJet / Material Jetting | ||
| Digital Light Processing | ||
| Fused Deposition Modelling | ||
| By Material Type | Resin | |
| Metal | ||
| Plastic / Polymer Filament | ||
| Ceramic | ||
| By Application | Dental Implants | |
| Prosthodontics | ||
| Orthodontics | ||
| Surgical Guides & Models | ||
| By End User | Dental Laboratories | |
| Dental Clinics | ||
| Academic & Research Institutes | ||
| By Geography | North America | United States |
| Canada | ||
| Mexico | ||
| Europe | Germany | |
| United Kingdom | ||
| France | ||
| Italy | ||
| Spain | ||
| Rest of Europe | ||
| Asia-Pacific | China | |
| Japan | ||
| India | ||
| Australia | ||
| South Korea | ||
| Rest of Asia-Pacific | ||
| Middle East & Africa | GCC | |
| South Africa | ||
| Rest of Middle East & Africa | ||
| South America | Brazil | |
| Argentina | ||
| Rest of South America | ||


Key Questions Answered in the Report
How large will Dental 3D-printing revenues be by 2031?
The Dental 3D Printing market size is expected to reach USD 8.96 billion by 2031, reflecting a 15.92% CAGR from 2026 to 2031.
Which segment is growing fastest?
Orthodontics is the fastest-growing application, projected to expand at a 18.79% CAGR through 2031, driven by sustained clear-aligner demand.
Why are services outperforming equipment sales?
Many practices prefer outsourcing design and printing to avoid USD 35,000-50,000 in upfront costs, pushing service revenues to a 16.61% CAGR.
What drives Asia-Pacific growth?
China’s oral-health action plan and Japan’s aging population are boosting restorative demand, propelling the region to an 18.51% CAGR.
Which technology is overtaking SLA?
Digital Light Processing is rising fastest because its 5-second layer cure doubles throughput versus SLA, capturing new installations in labs and clinics.
Page last updated on:


