Market Overview
| Study Period | 2020 - 2031 |
|---|---|
| Forecast Data Period | 2026 - 2031 |
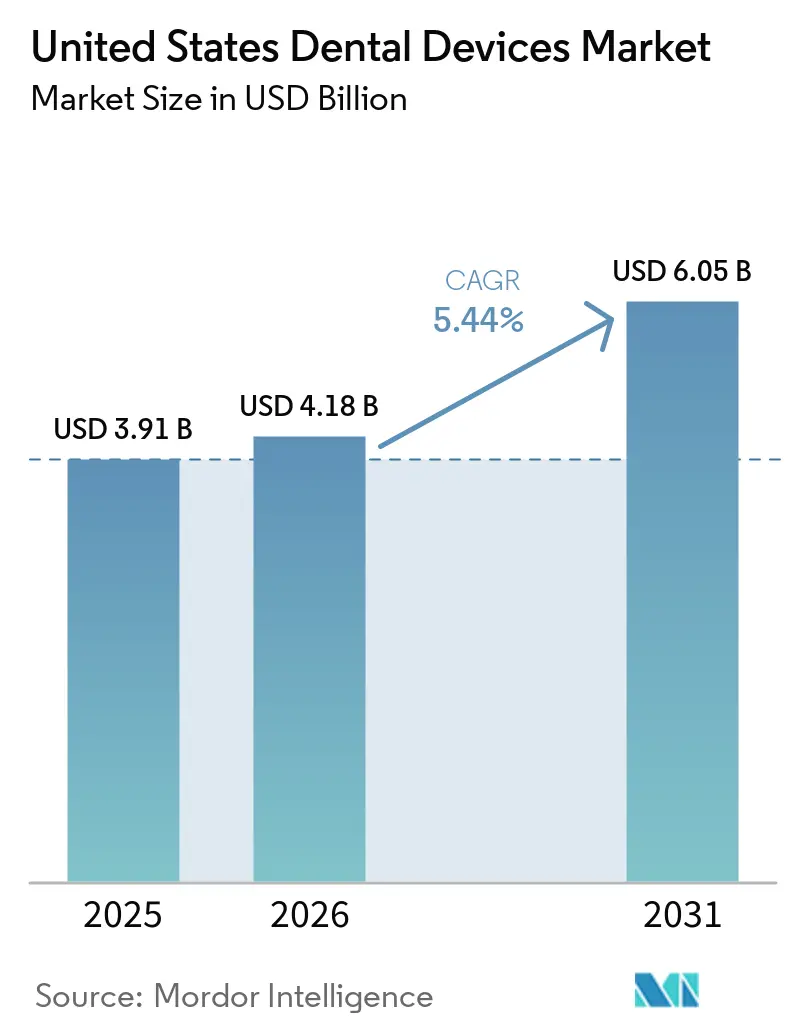
| Base Year Market Size (2025) | USD 3.91 Billion |
| Market Size (2026) | USD 4.18 Billion |
| Market Size (2031) | USD 6.05 Billion |
| Growth Rate (2026 - 2031) | 5.44% CAGR |
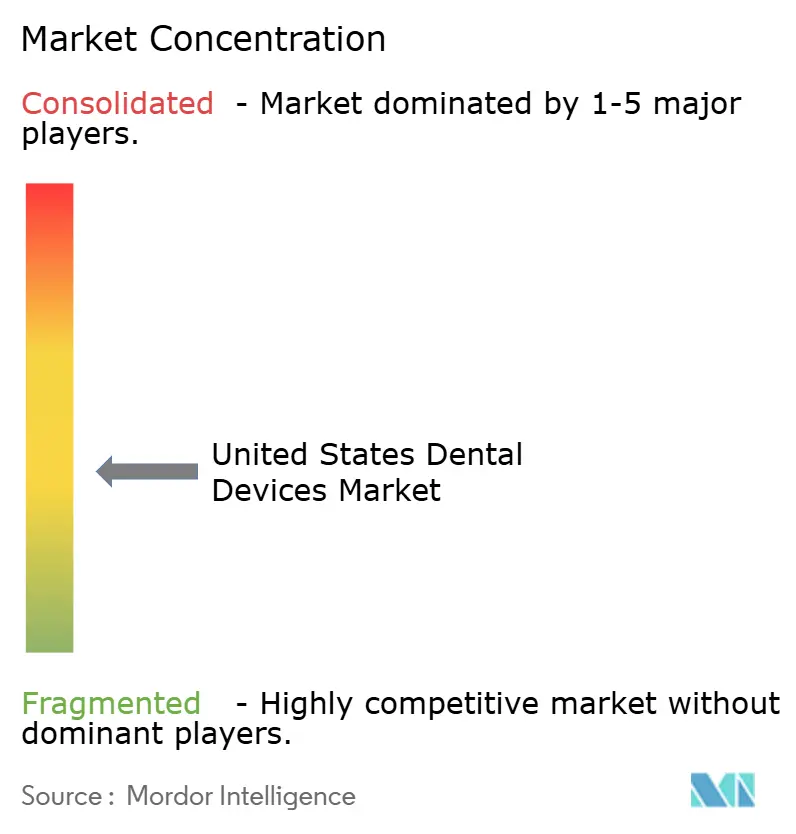
| Market Concentration | Medium |
Major Players *Disclaimer: Major Players sorted in no particular order Image © Mordor Intelligence. Reuse requires attribution under CC BY 4.0. | |
United States Dental Devices Market Analysis by Mordor Intelligence
The United States Dental Devices Market size is expected to grow from USD 3.91 billion in 2025 to USD 4.18 billion in 2026 and is forecast to reach USD 6.05 billion by 2031 at 5.44% CAGR over 2026-2031.
Demand is advancing as an aging population accelerates restorative and prosthodontic case volumes, while rapid digitization, driven by intraoral scanning, chairside CAD/CAM, and cloud-based treatment planning, reshapes practice economics. Therapeutic equipment continues to anchor revenue, yet implant-compatible biomaterials and AI-enabled diagnostics are redirecting growth toward consumables and software-centric devices. Vendor strategy now revolves around ecosystem lock-in; companies that integrate hardware, software, and services into a seamless workflow are outpacing rivals offering stand-alone products. Compliance pressures, particularly new FDA cybersecurity rules, are elevating fixed costs and encouraging scale-driven consolidation.
Key Report Takeaways
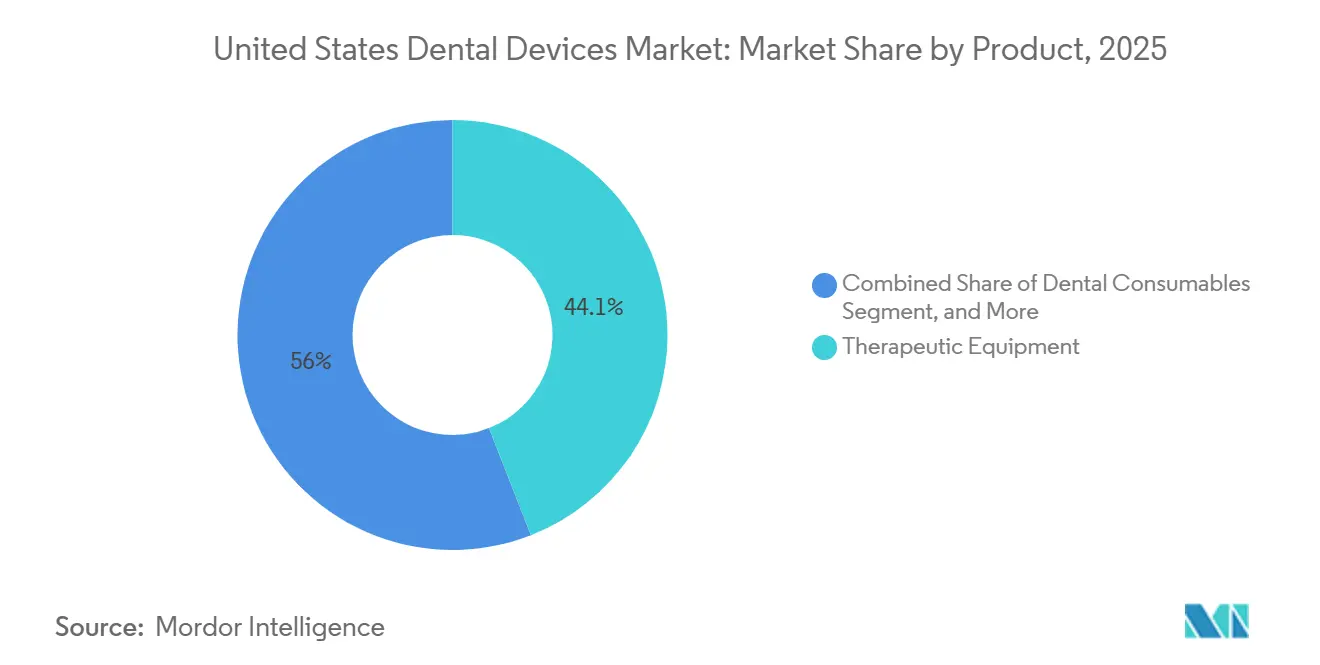
- By product category, therapeutic equipment led with 44.05% of United dental devices market share in 2025, while dental consumables are forecast to expand at a 5.91% CAGR through 2031.
- By treatment, orthodontics accounted for 33.12% of 2025 revenue and prosthodontics is advancing at a 7.51% CAGR to 2031.
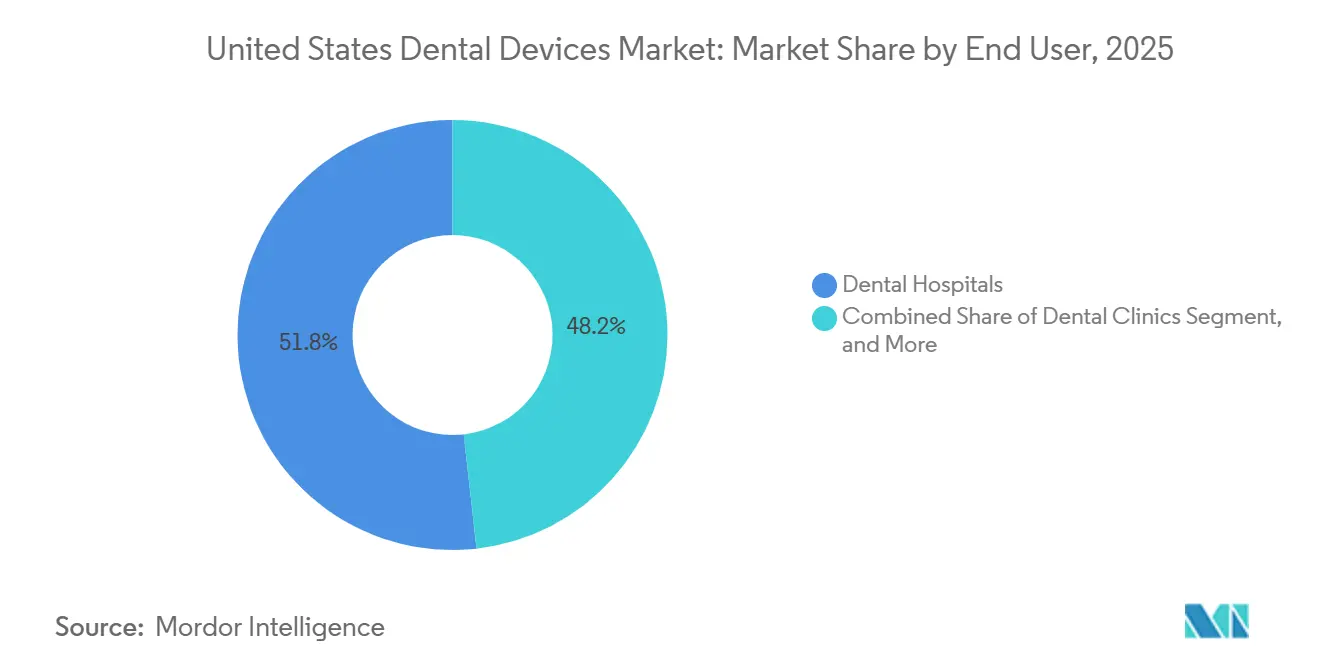
- By end user, dental hospitals captured 51.78% of 2025 spending, whereas dental clinics are projected to post an 8.79% CAGR over 2026-2031.
Note: Market size and forecast figures in this report are generated using Mordor Intelligence’s proprietary estimation framework, updated with the latest available data and insights as of 2026.
United States Dental Devices Market Trends and Insights
Driver Impact Analysis*
| Driver | (~) % Impact on CAGR Forecast | Geographic Relevance | Impact Timeline |
|---|---|---|---|
| Aging Population & Edentulism Prevalence | +1.2% | Global, with acute impact in North America, Western Europe, and Japan | Long term (≥ 4 years) |
| Advancements in Digital Dentistry (CAD/CAM, 3-D Imaging) | +1.8% | North America & EU lead; APAC adoption accelerating in urban centers | Medium term (2-4 years) |
| Rising Demand for Cosmetic Dentistry | +0.7% | North America, Middle East, and select APAC markets (South Korea, Thailand) | Short term (≤ 2 years) |
| Expansion of Dental Insurance Coverage | +0.5% | United States (Medicaid expansion states), select EU markets | Medium term (2-4 years) |
| Growth of Teledentistry-Integrated Devices | +0.6% | North America, Northern Europe; pilot programs in India and Brazil | Short term (≤ 2 years) |
| AI-Based Diagnostic Hardware Adoption in Medicaid Programs | +0.9% | United States (state-level Medicaid programs), early pilots in Canada | Medium term (2-4 years) |
| Source: Mordor Intelligence | |||
Aging Population and Rising Edentulism
A growing senior cohort is driving sustained demand for implants, overdentures, and full-arch restorations. WHO data show that 17.8% of adults aged 65 and above experienced complete edentulism in 2024, with the share projected to reach 19.3% by 2030.[1]World Health Organization, “Global Oral Health Status Report 2024,” who.int Leading manufacturers have responded with materials such as Roxolid titanium-zirconium, which cut healing time by half, and payers are expanding benefits: fourteen U.S. states added implant coverage for Medicaid beneficiaries in 2025. The policy shift is redirecting restorative therapy toward fixed prosthodontics, thereby stimulating upgrades to scanners, milling units, and implant planning software.
Advancements in Digital Dentistry
Chairside CAD/CAM and high-precision intraoral scanners now compress a two-week crown cycle into a single 90-minute visit. Dentsply Sirona’s Primescan Connect, launched in 2024, offers 5-micron accuracy and open-format exports, facilitating third-party design workflows.[2]Dentsply Sirona, “Primescan Connect Launch,” dentsplysirona.com FDA clearance of AI margin-line algorithms further trims preparation time by 40%. Adoption remains uneven: corporate clinics report 68% scanner penetration, compared with 31% among solo practices, widening a technology gap that fuels industry consolidation.
Growing Demand for Cosmetic Dentistry
Clear aligners, tooth-colored restorations, and chairside whitening are re-framing oral care as an aesthetic purchase. Adult aligner case starts grew 14% in 2025, with the 30-50 age group representing 61% of Invisalign shipments. Social media exposure and video-centric work cultures are driving demand for smile makeovers, steering revenue toward premium materials and workflow-integrated scanners.
Expansion of Dental Insurance Coverage
Broader payer support is enlarging the treated population. Medicaid expansion in several U.S. states financed implant-supported overdentures for 2.1 million beneficiaries in 2025. In Europe, statutory insurers in Germany and France reimburse up to 70% of implant costs for older adults, reinforcing baseline demand.
Restraints Impact Analysis*
| Restraint | (~) % Impact on CAGR Forecast | Geographic Relevance | Impact Timeline |
|---|---|---|---|
| High Cost of Advanced Dental Equipment | -0.8% | Global, with acute impact in price-sensitive APAC and Latin America markets | Short term (≤ 2 years) |
| Shortage of Skilled Dental Professionals | -0.6% | North America, Western Europe, and rural areas in APAC | Long term (≥ 4 years) |
| Stringent FDA Cybersecurity Rules Raising Compliance Costs | -0.9% | United States; spillover to EU under Medical Device Regulation (MDR) | Medium term (2-4 years) |
| Supply-Chain Vulnerabilities for Specialty Components | -0.5% | Global, with acute impact on manufacturers reliant on single-source suppliers | Short term (≤ 2 years) |
| Source: Mordor Intelligence | |||
High Cost of Advanced Dental Equipment
A full CAD/CAM workflow can cost USD 120,000-180,000, with annual maintenance adding another USD 12,000-18,000. Practices completing fewer than 15 same-day cases a month face payback horizons beyond seven years. Leasing now finances 58% of installations, yet 8.2% interest pushes total ownership costs 25% higher over five years. Emerging-market clinics often defer purchases despite subsidies, creating a technology gap between urban and rural operators.
Stringent FDA Cybersecurity Rules
FDA guidance issued in 2024 requires a Software Bill of Materials and comprehensive threat modeling for networked devices, raising compliance expenses by 15-20% per product line. Mid-tier manufacturers now outsource validation, delaying launches by up to twelve weeks and eroding first-mover advantage. Similar mandates under the EU Medical Device Regulation are increasing dual-market costs and accelerating strategic divestitures, as seen in Envista’s 2025 sale of its KaVo imaging unit.[3]Dentsply Sirona, “Primescan Connect Launch,” dentsplysirona.com
*Our forecasts treat driver/restraint impacts as directional, not additive. The impact forecasts reflect baseline growth, mix effects, and variable interactions.
Segment Analysis
By Product: Digitization Shifts Revenue Toward Consumables
Therapeutic equipment accounted for 44.05% of the United dental devices market share in 2025, on the back of a large installed base of CAD/CAM mills, handpieces, and electrosurgical units. Dental consumables are projected to outpace hardware, expanding at a 5.91% CAGR through 2031 as implant-ready biomaterials and digital impression resins capture new chairside workflows. The BLX implant system, launched by Straumann in 2025, underscores the pivot toward surface-engineered fixtures that shorten osseointegration to 4 weeks. Aggressive pricing by new radiography entrants from China is commoditizing imaging hardware, steering incumbents toward AI-powered software updates and service contracts.
Rising equipment commoditization is pushing vendors to bundle scanners, mills, biomaterials, and service plans under multi-year agreements. This approach locks in recurring revenue and aligns with the purchasing preferences of dental service organizations. Diagnostics equipment, such as dental lasers, maintains single-digit penetration because high prices and limited reimbursement curb adoption, though recent FDA clearance for hard-tissue indications may expand the addressable market.


By Treatment: Prosthodontics Rises on Senior Demand
Orthodontics accounted for 33.12% of 2025 procedure revenue, driven by clear-aligner uptake among adults, yet prosthodontic interventions are forecast to post the fastest growth at 7.51% through 2031. The United dental devices market size for prosthodontics is benefiting from Medicaid and EU reimbursement reforms that favor fixed restorations over removable dentures. Implant innovation, exemplified by hydrophilic surfaces and guided surgery, is shortening treatment time and attracting patients previously deterred by long healing periods.
Endodontic and periodontic segments grow at steadier rates. Innovations such as reciprocating rotary files and regenerative membranes enhance efficiency, but caries decline in fluoridated regions temper absolute case numbers. Emerging bundled medical–dental reimbursement pilots that reward periodontal disease management may raise procedure volumes over the long term.
By End User: Clinics Lead Growth on DSO Scale
Dental hospitals accounted for 51.78% of spending in 2025, driven by complex maxillofacial surgeries and oncology reconstruction. Nonetheless, dental clinics are expected to expand at an 8.79% CAGR, the fastest among end users, as DSOs negotiate enterprise equipment contracts that trim capital costs by nearly 20%. The United dental devices market size for clinics benefits from standardized workflows that elevate scanner and mill utilization rates.
Academic institutes play a strategic role in technology diffusion. Partnerships such as the 2025 agreement between the University of Pennsylvania and 3Shape embed scanners in curricula, ensuring future clinicians graduate fluent in digital workflows. Mobile and public-health programs round out demand through portable imaging and teledentistry kits funded by USD 340 million in HRSA grants.
Geography Analysis
The United States dental device market displays stark regional contrasts. California, Texas, and Washington collectively host over 37% of practices, attracting supplier service hubs and supporting rapid technology turnover. DSOs use these metropolitan centers to pilot software updates and AI modules before national rollout, amplifying early-adopter advantages.
Rural counties remain underserved: 57 million residents live in areas with a shortage of oral health professionals. Lower patient volumes and restrictive reimbursement profiles slow hardware replacement cycles, widening the digital gap in the United States dental device market. North Carolina’s USD 55 million grant program for community-college dental-assisting labs signals a policy approach to narrowing disparities by funding entry-level equipment.
State-level reimbursement changes shape local spending. Ohio’s 93% Medicaid fee increase for dental codes boosts cash flow for practices serving public-insurance patients, making digital radiography upgrades more affordable. Nine other states have enacted laws that set fee floors or mandate faster claim payment, further encouraging equipment financing. Nationally uniform Medicare coverage for medically necessary dentistry begins in 2025 but will disproportionately benefit states with older populations, fueling imaging demand in places like Maine and Arizona.
Teledentistry adoption is strongest in sparsely populated western regions, expanding the reach of AI-assisted diagnostics, and creating incremental demand for portable imaging sensors that integrate with cloud consultation platforms.
Competitive Landscape
The United States dental device market exhibits moderate concentration. Tier-one multinationals such as Dentsply Sirona, Midmark, and Envista collectively control significant revenue, but specialized AI software firms and additive-manufacturing startups challenge incumbents with niche capabilities. Economics are shifting from hardware margin toward recurring service revenue: Dentsply Sirona invests roughly 4% of annual sales in R&D to strengthen DS Core cloud subscriptions, while Midmark’s 2025 mobile delivery system emphasizes ergonomic design and low-noise compressors.
Venture capital is flowing into AI-enabled radiographic analytics, with platforms like Second Opinion gaining academic recognition for their caries-detection accuracy. DSOs, backed by private-equity capital, leverage size to secure multi-year bundled contracts, pressuring manufacturers to balance volume commitments against margin erosion. Regulatory attention to PE ownership, highlighted in a 2024 HHS report on consolidation, adds compliance complexity.
Innovation white space centers on AI-biomaterial convergence. Partnerships between research institutions and suppliers aim to develop regenerative hydrogels and stem-cell scaffolds that integrate seamlessly with digital planning platforms. As these concepts mature, they promise high-margin adjunct product lines that complement core imaging and milling equipment, reinforcing competitive churn across the United States dental device market.
United States Dental Devices Industry Leaders
Dentsply Sirona
3M
ZimVie
Envista
Institut Straumann AG
- *Disclaimer: Major Players sorted in no particular order

Recent Industry Developments
- April 2026: Dentsply Sirona, recognized as the world's largest diversified manufacturer of professional dental products and technologies, announced an expansion of its long-standing partnership with Burkhart Dental Supply, a prominent full-service dental distributor.
- May 2025: Medical University of South Carolina received the 2024 Education Innovation Award for a pilot study evaluating the AI platform Second Opinion, which assists in diagnosing dental caries using X-rays.
- January 2025: Midmark Corp. launched its redesigned Mobile Dental Delivery System with high- and low-speed handpieces, a scaler, and a three-way syringe in a lighter chassis powered by an oil-free compressor.


Research Methodology Framework and Report Scope
Market Definitions and Key Coverage
Our study defines the United States dental devices market as the revenue generated from professional-grade equipment and consumables that dentists use to examine, diagnose, treat, restore, or remove teeth and surrounding oral tissues; values are expressed in U.S. dollars at manufacturer selling price before distributor margins. According to Mordor Intelligence, the scope spans imaging units, chairs, lasers, CAD/CAM systems, handpieces, impression materials, implants, and orthodontic appliances for clinical settings across all 50 states.
Scope Exclusions: Consumer oral-care products such as toothpaste, manual toothbrushes, home whitening kits, and any fee-based dental services are excluded.
Segmentation Overview
- By Product
- Diagnostics Equipment
- Dental Laser
- Soft Tissue Lasers
- Hard Tissue Lasers
- Radiology Equipment
- Extra-oral Radiology Equipment
- Intra-oral Radiology Equipment
- Dental Chair & Equipment
- Dental Laser
- Therapeutic Equipment
- Dental Hand Pieces
- Electrosurgical Systems
- CAD/CAM Systems
- Milling Equipment
- Casting Machine
- Other Therapeutic Equipment
- Dental Consumables
- Dental Biomaterial
- Dental Implants
- Crowns & Bridges
- Other Dental Consumables
- Other Dental Equipments
- Diagnostics Equipment
- By Treatment
- Orthodontic
- Endodontic
- Periodontic
- Prosthodontic
- By End User
- Dental Hospitals
- Dental Clinics
- Academic & Research Institutes
- Other End Users
Detailed Research Methodology and Data Validation
Primary Research
Mordor analysts interviewed periodontists, procurement leads at Dental Service Organizations, state Medicaid officers, and distributors across the Northeast, Midwest, and Sunbelt. The conversations clarified upgrade cycles, average selling prices, and insurance-driven demand shifts, which we have used to challenge and refine desk findings.
Desk Research
Our analysts first mapped the regulatory and demand landscape through public sources such as the Food and Drug Administration 510(k) database, Centers for Medicare & Medicaid Services Medicare Advantage enrollment files, American Dental Association Health Policy Institute surveys, U.S. Census Bureau population projections, and International Trade Commission HS-code import data. Trade association newsletters, peer-reviewed journals like the Journal of Dental Research, and company 10-Ks provided cost benchmarks and adoption clues for digital imaging and implant systems.
Subscription resources, including D&B Hoovers for practice economics and Dow Jones Factiva for device recall alerts, filled historical gaps. These insights were layered with shipment-level volumes from Volza to check the plausibility of import spikes for intraoral scanners. The sources cited above illustrate the range consulted; many additional references informed granular validations.
Market-Sizing & Forecasting
A top-down reconstruction began with 2024 national expenditure on dental capital goods reported by the Bureau of Economic Analysis, which is then split by device class using import data, domestic production surveys, and practice penetration rates. Select bottom-up cross-checks, such as sampled chair shipments multiplied by representative pricing, served to validate totals and adjust any outliers.
Key market fingerprints that feed the model include the number of licensed dentists, annual patient visit frequency, orthodontic case starts, private dental insurance coverage, and average implant retail price trends. Multivariate regression links these indicators to historical spending before five-year forecasts are extended with scenario analysis around reimbursement reforms and technological adoption curves. Any residual gaps are bridged through conservative interpolation guided by expert consensus.
Data Validation & Update Cycle
Outputs go through a two-step analyst review, anomaly flags trigger re-contact with experts, and variance above three percent against ADA spending indices prompts recalibration. Mordor refreshes the dataset annually and issues interim updates after material regulatory or technology events.
Why Our USA Dental Equipment Baseline Commands Reliability
Published figures often diverge because firms choose different scopes, pricing ladders, and refresh rhythms. We recognize these drivers upfront, and our disciplined inclusion of clinic-only hardware plus professional consumables, paired with yearly updates, keeps Mordor's baseline tightly aligned with real purchasing patterns.
Key gap drivers across other studies include the addition of consumer products, omission of single-use consumables, or reliance on global allocation factors instead of U.S. shipment evidence.
Benchmark comparison
| Market Size | Anonymized source | Primary gap driver |
|---|---|---|
| USD 5.87 B (2025) | Mordor Intelligence | - |
| USD 13.57 B (2024) | Regional Consultancy A | Includes consumer oral-care goods and service revenue |
| USD 3.18 B (2025) | Trade Journal B | Focuses solely on operatory hardware, omits disposable consumables |
These contrasts show that Mordor's balanced, variable-traced approach yields a dependable midpoint clients can replay and audit with limited effort.


Key Questions Answered in the Report
How large is the United dental devices market today?
The market generated USD 4.18 billion in 2026 and is on track to reach USD 6.05 billion by 2031.
What is the expected CAGR for United dental devices through 2031?
The market is projected to grow at a 5.44% CAGR from 2026 to 2031.
Which product category is growing fastest?
Dental consumables are forecast to expand at 5.91% annually, outpacing hardware segments due to implant and biomaterial demand.
Why are dental clinics gaining share over hospitals?
Dental service organizations use group purchasing and standardized workflows to deploy scanners, mills, and imaging systems more efficiently, boosting clinic growth at an 8.79% CAGR.
What regulatory changes are shaping device development?
New FDA cybersecurity mandates and guidance on adaptive AI algorithms are raising compliance costs but also accelerating innovation in connected and learning devices.
Page last updated on:


