Dental 3D Scanners Market Size and Share
Market Overview
| Study Period | 2020 - 2031 |
|---|---|
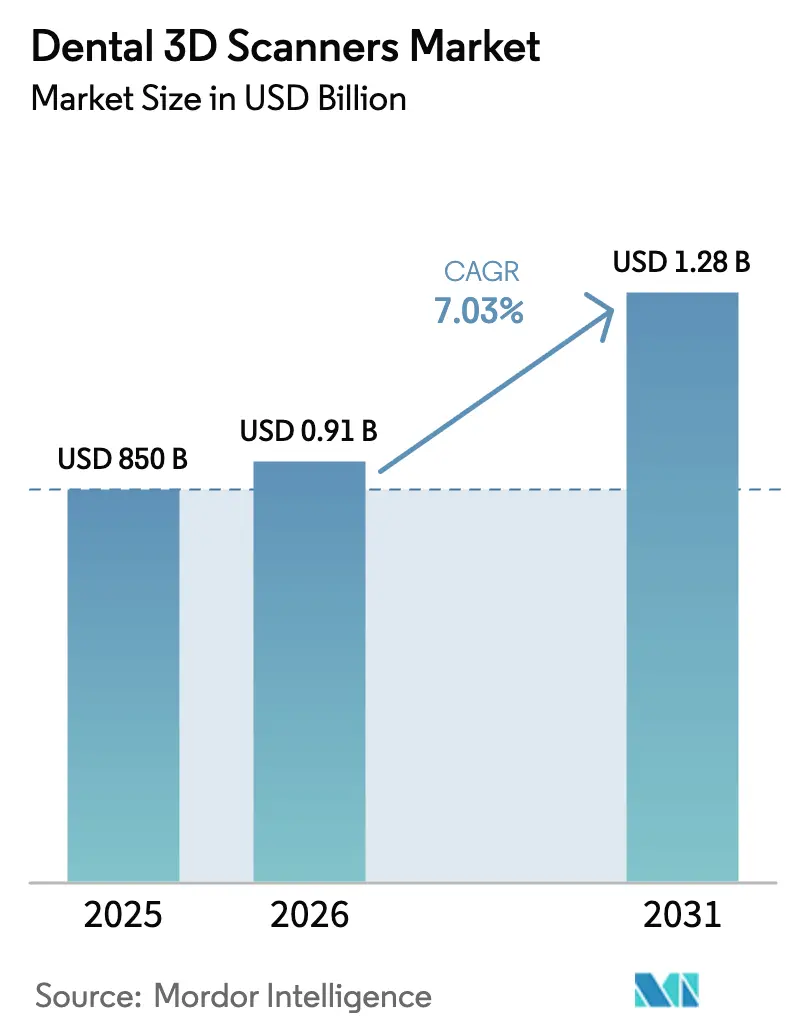
| Market Size (2026) | USD 0.91 Billion |
| Market Size (2031) | USD 1.28 Billion |
| Growth Rate (2026 - 2031) | 7.03% CAGR |
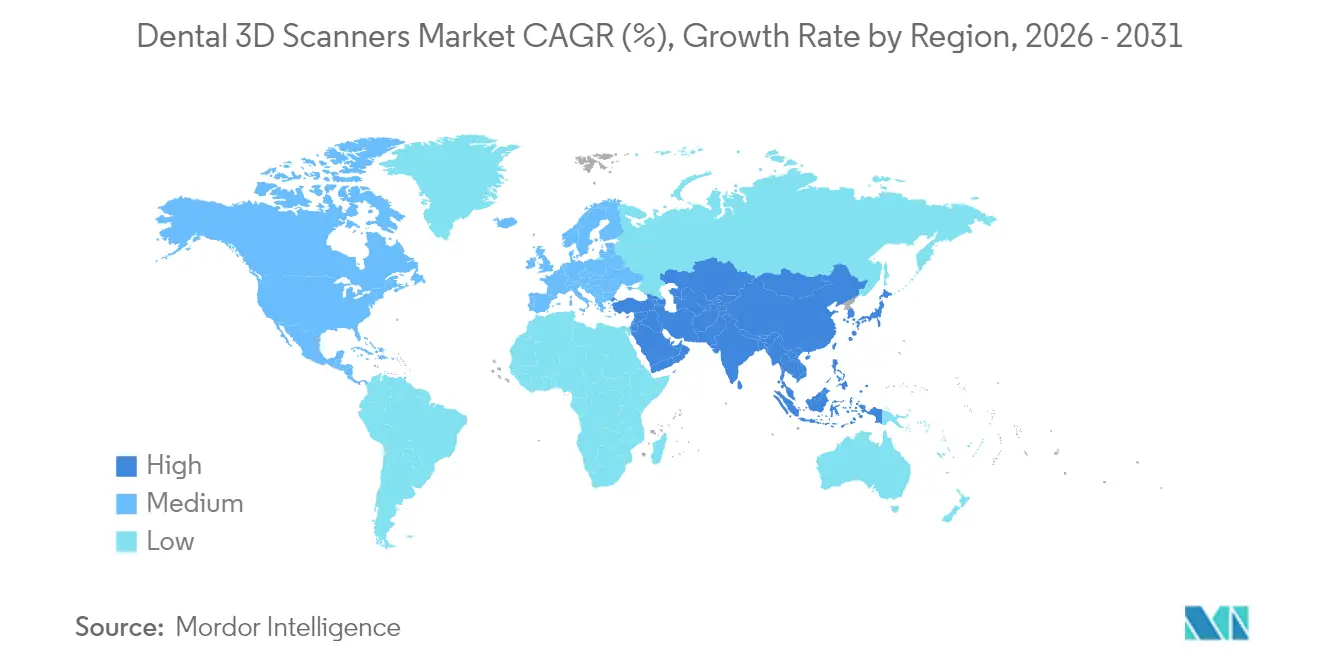
| Fastest Growing Market | Asia Pacific |
| Largest Market | Americas |
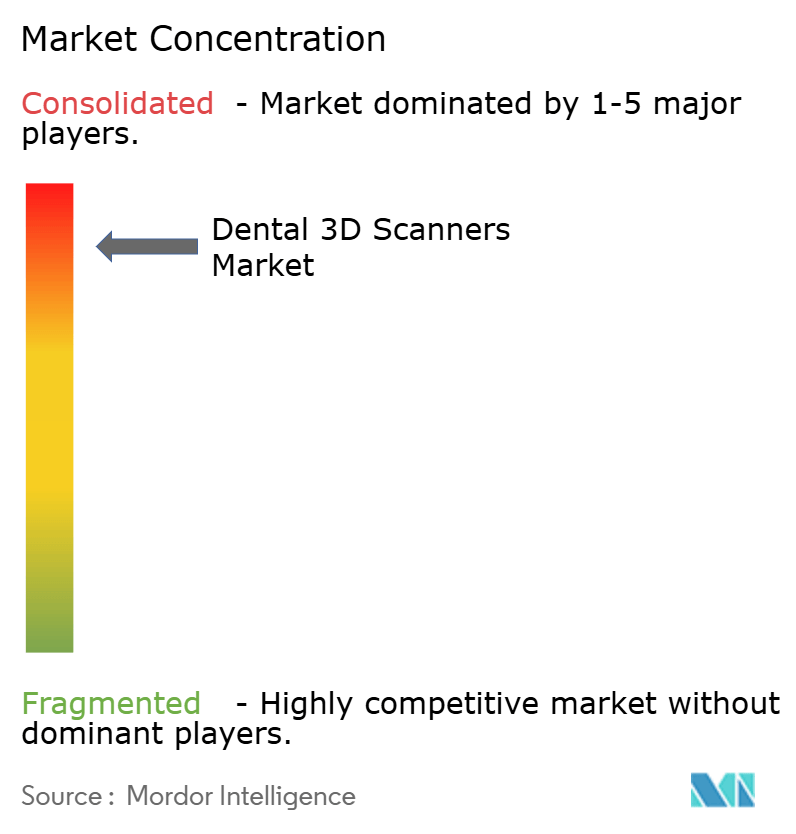
| Market Concentration | High |
Major Players *Disclaimer: Major Players sorted in no particular order Image © Mordor Intelligence. Reuse requires attribution under CC BY 4.0. | |
Dental 3D Scanners Market Analysis by Mordor Intelligence
The Dental 3D scanners market size was valued at USD 850 million in 2025 and estimated to grow from USD 909.8 million in 2026 to reach USD 1.28 billion by 2031, at a CAGR of 7.03% during the forecast period (2026-2031). Strong alignment between artificial intelligence and optical imaging underpins the present growth phase of the Dental 3D scanners market, enabling reliable same-day dentistry that sharpens competitive advantage for early adopters. Wireless intra-oral units now complete a full-arch scan every 1.3 seconds while maintaining micron-level trueness, shortening chair-side appointments and elevating treatment accuracy. Subscription-based licensing further widens the Dental 3D scanners market by transferring large upfront software fees into manageable monthly costs that appeal to small practices. In Asia-Pacific, inbound dental-tourism flows motivate clinics to refresh imaging suites and secure international accreditation, feeding regional sales momentum. Counterweights to expansion include system prices above USD 50,000 for premium models, fragmented reimbursement for digital impressions and heightened scrutiny over cloud data security; however these hurdles are unlikely to outweigh the technology’s return-on-investment advantages over the forecast horizon.
Key Report Takeaways
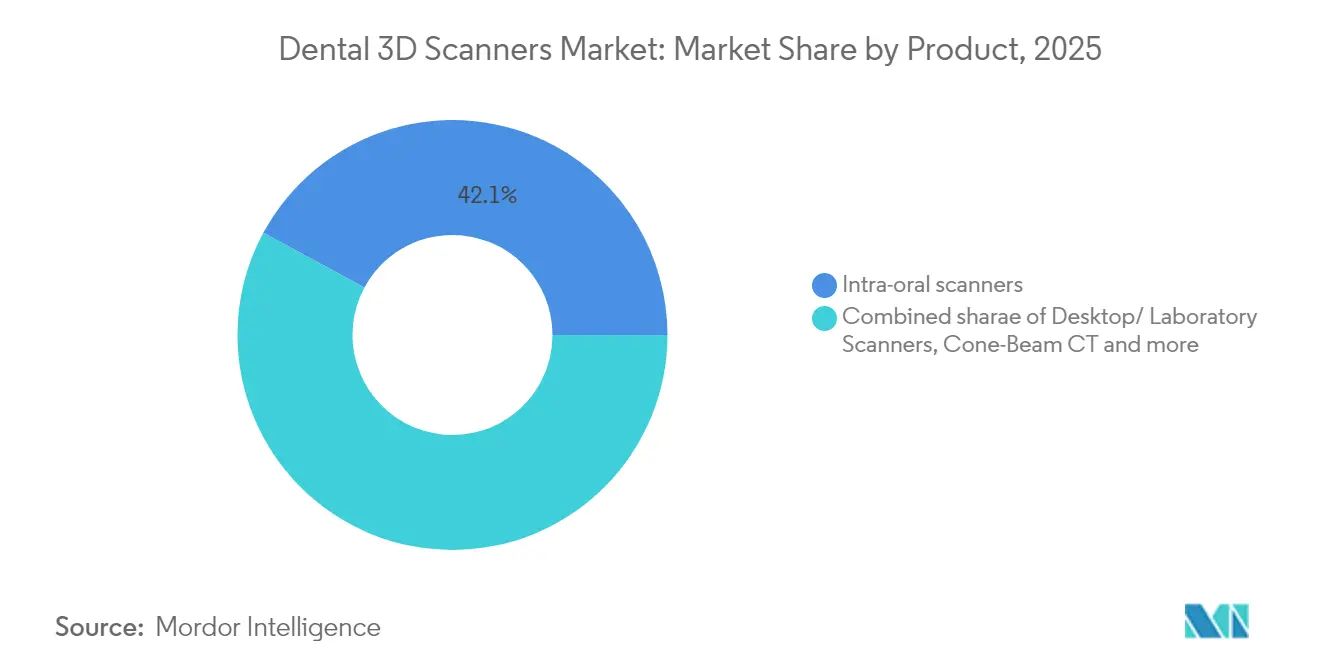
- By product type, intra-oral scanners captured 42.12% of the Dental 3D scanners market share in 2025, while hand-held or portable models are tracking an 8.42% CAGR through 2031.
- By technology, structured-light units generated 35.62% of 2025 revenue and are forecast to advance at 8.61% CAGR to 2031.
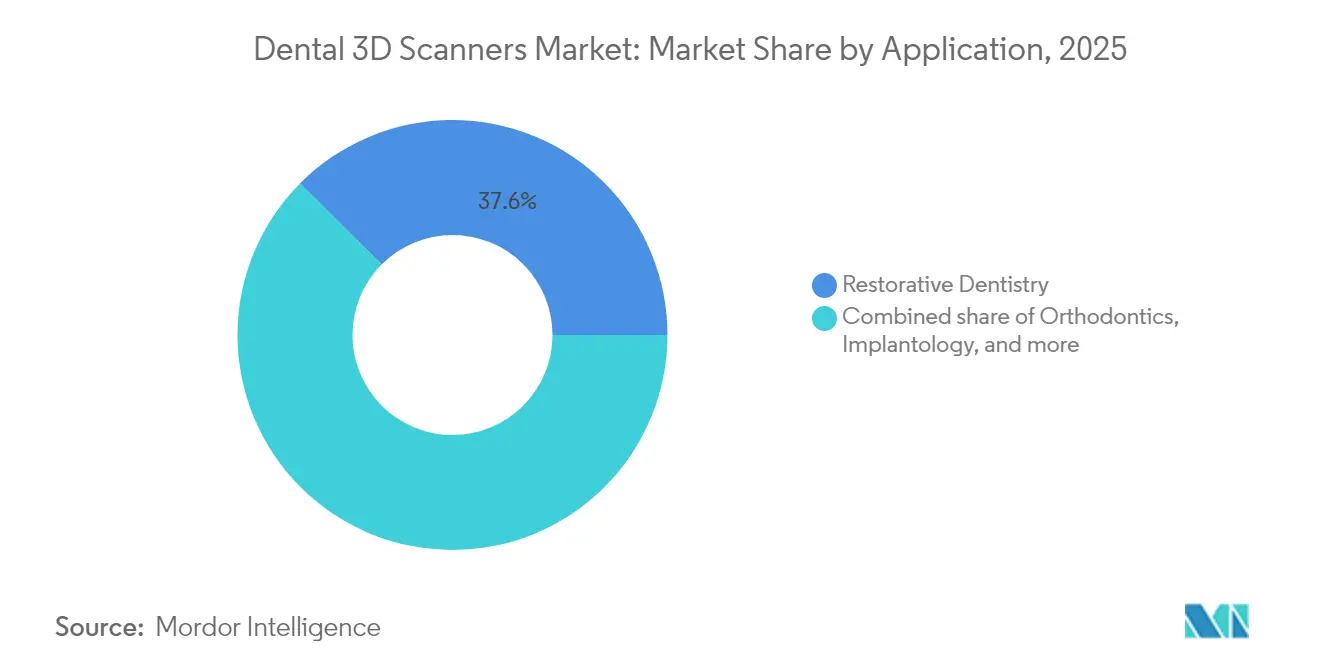
- By application, restorative dentistry accounted for 37.55% of the Dental 3D scanners market size in 2025; orthodontics is projected to accelerate at 8.78% CAGR to 2031.
- By end user, dental clinics led with 54.05% revenue in 2025 and remain the fastest growing segment at 8.93% CAGR through 2031.
- By geography, North America commanded 36.40% revenue in 2025, whereas Asia-Pacific is positioned for the quickest 9.12% CAGR over the outlook period.
Note: Market size and forecast figures in this report are generated using Mordor Intelligence’s proprietary estimation framework, updated with the latest available data and insights as of 2026.
Global Dental 3D Scanners Market Trends and Insights
Driver Impact Analysis*
| Driver | (~) % Impact on CAGR Forecast | Geographic Relevance | Impact Timeline |
|---|---|---|---|
| Mainstream digitization of chair-side workflows | +2.1% | Global with early uptake in North America & EU | Medium term (2-4 years) |
| Growing burden of restorative & orthodontic procedures | +1.8% | Global, especially aging developed markets | Long term (≥ 4 years) |
| Faster AI-enhanced scan accuracy & wireless ergonomics | +1.5% | North America & EU core, spill-over to APAC | Short term (≤ 2 years) |
| Integration with in-office 3D printing for same-day dentistry | +1.2% | North America & EU, expanding to urban APAC | Medium term (2-4 years) |
| Dental-tourism corridors driving APAC upgrades | +0.9% | APAC core, secondary MEA hubs | Medium term (2-4 years) |
| Subscription-based software lowering entry barriers | +0.7% | Global, fastest in emerging markets | Short term (≤ 2 years) |
| Source: Mordor Intelligence | |||
Mainstream Digitization of Chair-Side Workflows
Dental practices increasingly view scanners as non-negotiable. Digital impressions remove material waste and courier delays, aligning with ANSI/ADA Standard No. 1110-1 for AI-supported clinical decisions[1]Source: American Dental Association, “ANSI/ADA Standard No. 1110-1,” ada.org . Clinics using full-arch digital flows report 40% cuts in revisit frequency and 94% patient approval of AI-generated restorations. Network effects among laboratories and referral partners are cementing the Dental 3D scanners market as the de-facto foundation of interoperable care pathways
Growing Burden of Restorative & Orthodontic Procedures
An aging demographic raises restorative volumes, while adult demand for aesthetic alignment lifts orthodontic caseloads. Dental AI revenue is set to hit USD 2.7 billion by 2030, mirroring the heightened image-analysis needs of the Dental 3D scanners industry. Clear-aligner workflows converted to chair-side printing now produce trays within hours, compressing treatment cycles and reinforcing technology adoption.
Faster AI-Enhanced Scan Accuracy & Wireless Ergonomics
Real-time algorithms correct stitching errors as frames stream every 1.3 seconds, achieving 93.40% caries-detection accuracy and 95.65% specificity bmcoralhealth.. Wireless hand-pieces boost mobility, yet clinical trials note higher muscle activation because of weight gains. Practices that balance ergonomic training with AI benefits extract the most value from the Dental 3D scanners market
Integration with In-Office 3D Printing Enabling Same-Day Dentistry
Immediate translation of scans into crowns, bridges and splints redefines patient expectation. Veneer templates created via multi-jet printing demonstrate operator-independent margin fit. High-performance polymers now validated for long-term intraoral use broaden indications. ADA code D0396 offers a billing route, though most insurers still bundle fees, nudging clinics to recoup scanner investments through efficiency gains[2]Source: UnitedHealthcare, “Dental Policy Guideline 2025,” uhc.com
High Capital Cost & Learning Curve
Premium intra-oral scanners list between USD 20,000 and USD 50,000; advanced CBCT systems surpass USD 150,000, stretching payback periods for low-volume clinics. A 2025 US tariff added 10% to imported imaging hardware, tightening budgets further. Staff retraining temporarily suppresses throughput, yet practices report steady rebound after six months.
Limited Reimbursement for Digital Impressions
CDT code D0801 acknowledges 3D surface scans, yet most insurers roll the fee into final restorative billing, limiting discrete revenue streams. UnitedHealthcare still excludes routine 3D-printed appliances, compelling clinicians to justify scanners through patient experience improvements rather than direct procedural income.
*Our forecasts treat driver/restraint impacts as directional, not additive. The impact forecasts reflect baseline growth, mix effects, and variable interactions.
Segment Analysis
By Product Type: Intra-Oral Scanners Anchor Workflow Transformation
Intra-oral units headlined revenue at 42.12% in 2025 and remain the core gateway for digital impressions, anchoring the Dental 3D scanners market. Hand-held devices, set to rise at 8.42% CAGR, deliver flexible chair-side capture for ergonomic gains that support high-throughput clinics. Desktop laboratory scanners sustain niche relevance for complex prosthetics requiring sub-20 µm fidelity, while CBCT hybrids integrate depth mapping essential for surgical planning. Wireless modules reduce cable clutter but widen device weight, prompting manufacturers to refine battery density for clinician comfort. Emerging photogrammetry features now stitch multiple scan modalities into unified STL outputs, advancing accuracy for full-arch edentulous cases.
Second-generation intra-oral platforms blend AI diagnostics with automated margin detection, creating a seamless bridge between acquisition and CAD design within the Dental 3D scanners market. Competitive gaps persist in haptic feedback and gesture control, both under active R&D to streamline scan initiation without handset buttons. Manufacturers who leverage over-the-air firmware updates retain an installed-base moat, locking clinics into their software ecosystems and sustaining recurring subscription margins for the broader Dental 3D scanners industry.


By Technology: Structured-Light Commands Precision Leadership
Structured-light captured 35.62% of 2025 revenue and is positioned to climb at 8.61% CAGR. Multi-pattern projection ensures rapid frame acquisition, delivering end-to-end full-arch trueness near 38 µm, well within prosthetic tolerance. Laser triangulation remains the laboratory workhorse for ultra-fine work when speed is secondary. Confocal imaging excels in subsurface lesion detection, pairing optical depth cues with fluorescence metrics that enhance early caries screening. Active wavefront sampling, promising sub-1 µm axial precision, remains confined to research but signals next-wave competition for the Dental 3D scanners market.
The convergence of multiple light principles into single sensors is a visible trend. Hybrid devices dynamically switch projection methods based on surface reflectivity, ensuring scan consistency across enamel, gingiva and metallic restorations. Closed-loop AI calibrates exposure settings to reduce the user’s technical burden, yielding smoother integration for new entrants to the Dental 3D scanners market.
By End User: Dental Clinics Drive Market Expansion
Dental clinics produced 54.05% of 2025 turnover and will pace the field with a 8.93% CAGR thanks to rising adoption across solo, group and corporate practice models. Dental service organisations integrate scanners at scale, leveraging cloud analytics to benchmark chair performance, thereby standardising protocols across hundreds of sites videa.ai. Laboratories retain crucial roles in complex prosthetics, yet erosion of simple crown volumes to chair-side milling nudges them toward high-value, multi-material cases.
Hospitals apply Dental 3D scanners mainly in maxillofacial surgery and oncology, where CBCT overlays inform critical anatomical boundaries. Academic and research institutes continue validating next-gen imaging, often in collaboration with vendors eager for peer-reviewed evidence that accelerates regulatory approval. Integration of scanners with practice-management software cements data lineage from diagnosis to billing, consolidating the Dental 3D scanners market within broader digital-health platforms
By Application: Restorative Leads While Orthodontics Surges
Restorative dentistry controlled 37.55% of 2025 sales, underlining the technology’s imperative role in crown, bridge and implant workflows that rely on micron-accurate impressions. Orthodontics exhibits the fastest expansion at 8.78% CAGR, fuelled by adult uptake of clear-aligner therapy that requires multiple staged scans for progressive tray sets. Implantology gains from optical and CBCT fusion mapping that guides depth-controlled drilling. Endodontics now employs guided access for calcified canals, driving measurable reductions in iatrogenic errors and re-treatments.
Robotic surgery prototypes combine live scans with autonomous instrumentation, hinting at future operating suites where Dental 3D scanners feed artificial intelligence engines in real time, elevating procedural predictability. As practice patterns evolve, each specialty deepens reliance on digital imaging, reinforcing long-run demand across the broader Dental 3D scanners market.
Geography Analysis
North America maintained 36.40% revenue in 2025, reflecting robust private insurance spend and early AI adoption across large group practices. US tariffs lifted import prices by 10%, yet capital-rich operators continue purchasing upgrades to defend competitive standing. Canada’s corporate networks, such as Dentalcorp, deploy AI screening across hundreds of chairs, raising scan volume and normalising digital care. Data-privacy frameworks, though strict, align with cloud redundancy and cyber-hardening features provided by leading vendors, undergirding confidence in cross-border data storage.
Europe ranks second, anchored by Germany and the United Kingdom, which combine public reimbursement with private capital for high-spec imaging. National programmes subsidise scanner adoption when linked to measurable quality improvements, sustaining a structured growth path for the Dental 3D scanners market. GDPR enforces rigorous data controls, but vendors who certify compliance find smoother procurement channels. Multi-centre research consortia accelerate clinical validation and peer-reviewed dissemination, nurturing clinician trust.
Asia-Pacific is the prime expansion engine, forecast to run at 9.12% CAGR through 2031. Thailand, India and the Philippines court foreign patients with cost-effective packages that include digital scans as proof points of quality. China’s urban middle class demands premium restorative care, intensifying domestic competition on scan throughput and quality. South Korea subsidises senior imaging under National Health Insurance, invigorating demand in older cohorts. Australia simultaneously exports patients to Southeast Asia and imports high-value inbound travellers for complex surgeries, driving bilateral equipment flows that reinforce the Dental 3D scanners market.
Latin America shows gradual uptake; Brazil’s implant boom sparks interest in chair-side scanning, although currency volatility tempers replacement schedules. The Middle East and Africa deliver steady but lower growth, as private chains import digital suites to differentiate premium offerings for expatriate populations and medical tourists.

Competitive Landscape
The Dental 3D scanners market is moderately consolidated. Dentsply Sirona and 3Shape preserve lead positions through broad portfolios and global distribution reach, coupled with regular firmware enhancements that keep hardware in lockstep with software-driven innovation. Medit and Shining 3D compete on aggressive price-performance ratios that resonate in emerging economies. AI performance now defines competitive separations; vendors invest heavily in annotated image databases to train diagnostic networks that reduce false positives.
Subscription business models, exemplified by Exocad Flex Licence, shift revenue from one-time fees to stable recurring streams and lower entry barriers for buyers. ANSI/ADA Standard No. 1110-1 raises compliance stakes, compelling smaller entrants to invest in algorithm transparency or risk exclusion from procurement lists. Untapped opportunity lies in edentulous accuracy, where hybrid optical-photogrammetry systems could reset benchmarks. Robotic integrations present an emerging battlefield as early prototypes demonstrate semi-autonomous drilling guided by real-time scans, signalling a transformative horizon for the Dental 3D scanners industry.
Dental 3D Scanners Industry Leaders
Midmark Corporation
3Shape A/S
Envista Holdings Corporation
Dentsply Sirona Inc.
Institut Straumann AG
- *Disclaimer: Major Players sorted in no particular order

Recent Industry Developments
- April 2025: United States imposed a 10% tariff on dental equipment imports, raising scanner costs and influencing capital budgets
- September 2024: Straumann introduced the SIRIOS intra-oral scanner to expand its digital suite


Global Dental 3D Scanners Market Report Scope
A dental 3D scanner is a digital device used by dental professionals to capture digital replicas of patients' teeth. The dental professional utilizes dental 3D scanners for stitching together numerous tiny images using areas of overlap, fixing them together into a puzzle-piece fit. Furthermore, the demand for dental 3D scanners has increased due to the rising burden of oral diseases, increasing demand for cosmetic dentistry and preventive dentistry, continuous innovation in dental technology, and growing demand for digital dentistry.
The dental 3D scanners market is segmented into product type, scanner type, and geography. By product type, the market is segmented into hand-held 3D dental scanners, desktop/laboratory 3D dental scanners, intraoral 3D dental scanners, and cone beam computerized tomography. By scanner type, the market is segmented into 3D dental light scanners and 3D dental laser scanners. The market is divided geographically into North America, Europe, Asia-Pacific, South America, and the Middle East and Africa. The report also includes market size and forecasts for 17 countries within these regions. Market sizing and forecasts for each segment are provided in terms of value (USD).
| Intra-oral Scanners |
| Desktop / Laboratory Scanners |
| Cone-Beam CT (Dental CBCT) |
| Hand-held / Portable Scanners |
| Structured-Light |
| Laser Triangulation |
| Confocal Imaging |
| Active Wavefront Sampling |
| Dental Clinics |
| Dental Laboratories |
| Hospitals |
| Academic & Research Institutes |
| Restorative Dentistry |
| Orthodontics |
| Implantology |
| Endodontics & Others |
| North America | United States |
| Canada | |
| Europe | Germany |
| United Kingdom | |
| France | |
| Italy | |
| Spain | |
| Rest of Europe | |
| Asia-Pacific | China |
| India | |
| Japan | |
| South Korea | |
| Australia | |
| Rest of Asia-Pacific | |
| South America | Brazil |
| Argentina | |
| Rest of South America | |
| Middle East and Africa | GCC |
| South Africa | |
| Rest of Middle East and Africa |
| By Product Type | Intra-oral Scanners | |
| Desktop / Laboratory Scanners | ||
| Cone-Beam CT (Dental CBCT) | ||
| Hand-held / Portable Scanners | ||
| By Technology | Structured-Light | |
| Laser Triangulation | ||
| Confocal Imaging | ||
| Active Wavefront Sampling | ||
| By End User | Dental Clinics | |
| Dental Laboratories | ||
| Hospitals | ||
| Academic & Research Institutes | ||
| By Application | Restorative Dentistry | |
| Orthodontics | ||
| Implantology | ||
| Endodontics & Others | ||
| By Geography | North America | United States |
| Canada | ||
| Europe | Germany | |
| United Kingdom | ||
| France | ||
| Italy | ||
| Spain | ||
| Rest of Europe | ||
| Asia-Pacific | China | |
| India | ||
| Japan | ||
| South Korea | ||
| Australia | ||
| Rest of Asia-Pacific | ||
| South America | Brazil | |
| Argentina | ||
| Rest of South America | ||
| Middle East and Africa | GCC | |
| South Africa | ||
| Rest of Middle East and Africa | ||


Key Questions Answered in the Report
Q1. What is the current value of the Dental 3D scanners market?
A1. The market stands at USD 909.8 million in 2026 and is forecast to reach USD 1.28 billion by 2031.
Q2. Which device segment leads the Dental 3D scanners market?
A2. Intra-oral scanners held 42.12% revenue in 2025.
Q3. Which region will expand fastest through 2031?
A3. Asia-Pacific is projected to grow at a 9.12% CAGR.
Q4. What hinders wider adoption of Dental 3D scanners?
A4. High capital costs, limited reimbursement for digital impressions and cybersecurity concerns slow uptake.
Page last updated on:


