Dental Labs Market Size and Share
Market Overview
| Study Period | 2020 - 2031 |
|---|---|
| Market Size (2026) | USD 27.76 Billion |
| Market Size (2031) | USD 37.49 Billion |
| Growth Rate (2026 - 2031) | 6.19% CAGR |
| Fastest Growing Market | Asia-Pacific |
| Largest Market | North America |
| Market Concentration | Medium |
Major Players *Disclaimer: Major Players sorted in no particular order Image © Mordor Intelligence. Reuse requires attribution under CC BY 4.0. | |
Dental Labs Market Analysis by Mordor Intelligence
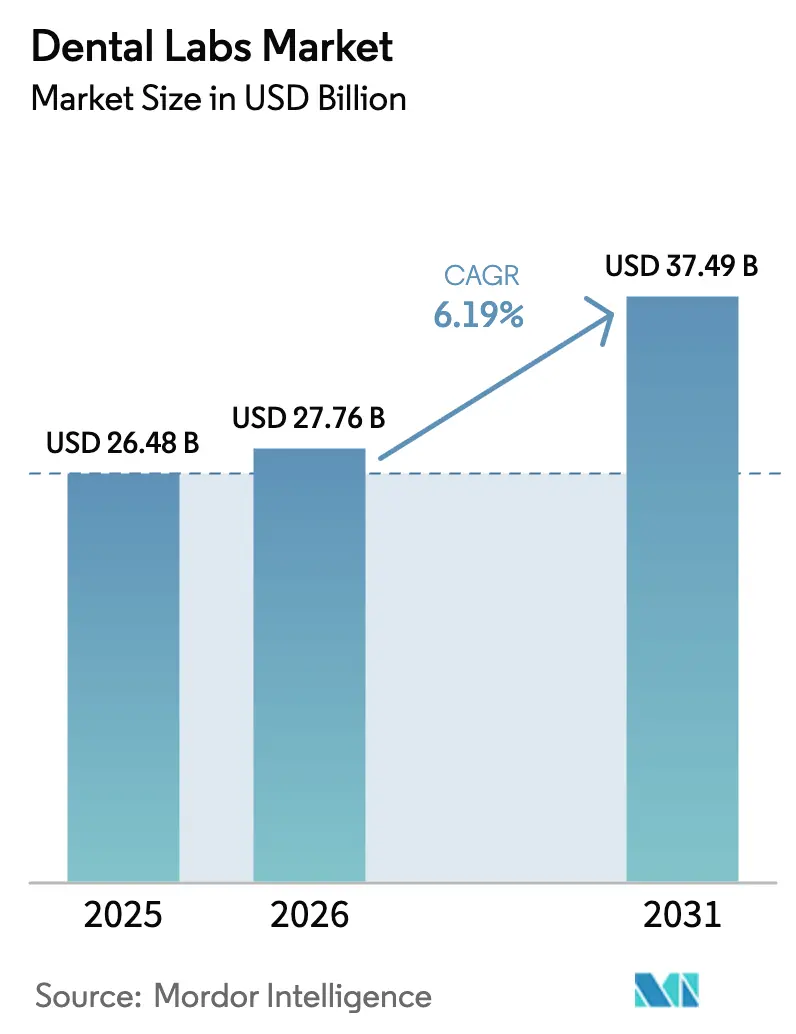
The Dental Labs Market size was valued at USD 26.48 billion in 2025 and is estimated to grow from USD 27.76 billion in 2026 to reach USD 37.49 billion by 2031, at a CAGR of 6.19% during the forecast period (2026-2031).
Growth reflects the accelerating shift from hand-crafted processes to full-scale digital workflows, where AI-driven design automation compresses turnaround times and widens profit margins. Dental Support Organizations are using centralized procurement to squeeze unit costs, encouraging private-equity investment and fueling further consolidation. Implant demand continues to climb as aging populations favor fixed solutions, while a surge in cosmetic procedures among millennials and Gen-Z keeps premium all-ceramic restorations in high demand. Asia-Pacific posts the fastest expansion thanks to government-funded oral-health programs and relaxed foreign-investment rules that attract global device makers.
Key Report Takeaways
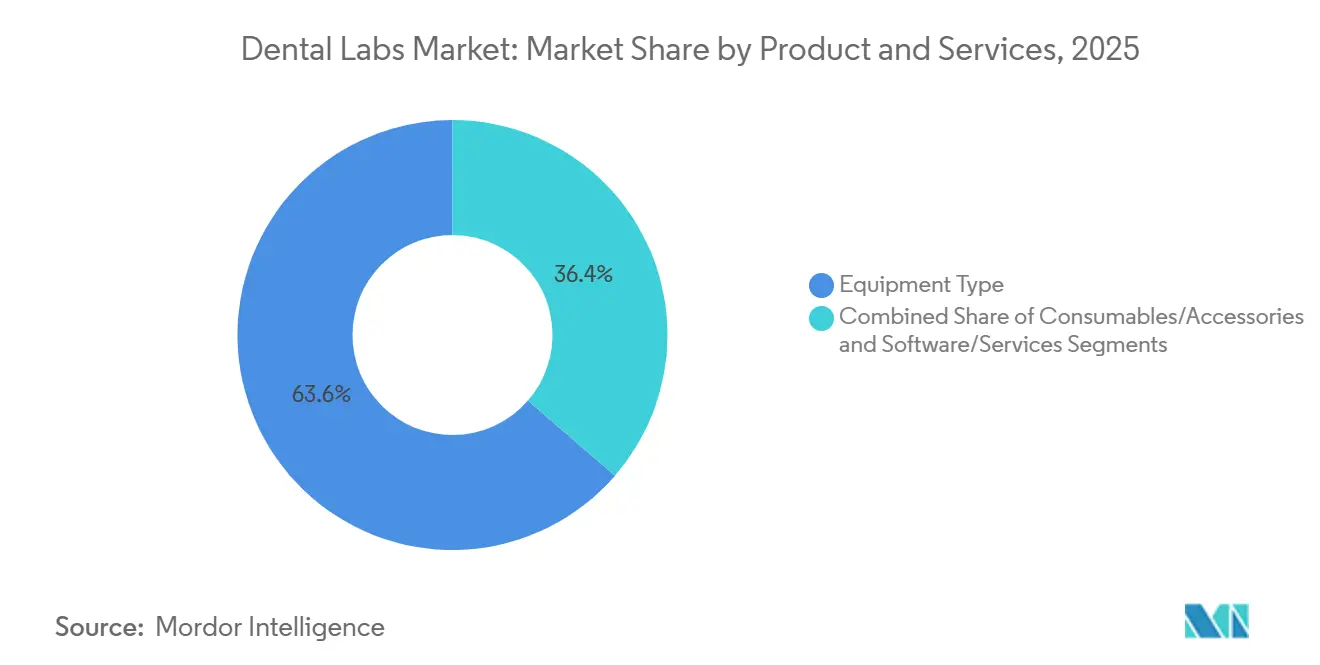
By product and services, Equipment Type led with 63.63% of 2025 revenue, whereas Software & Services is poised to expand at a 10.37% CAGR through 2031.
By dental discipline, restorative procedures accounted for 27.63% of the dental labs market size in 2025, while implants are set to grow at an 8.35% CAGR during the forecast period.
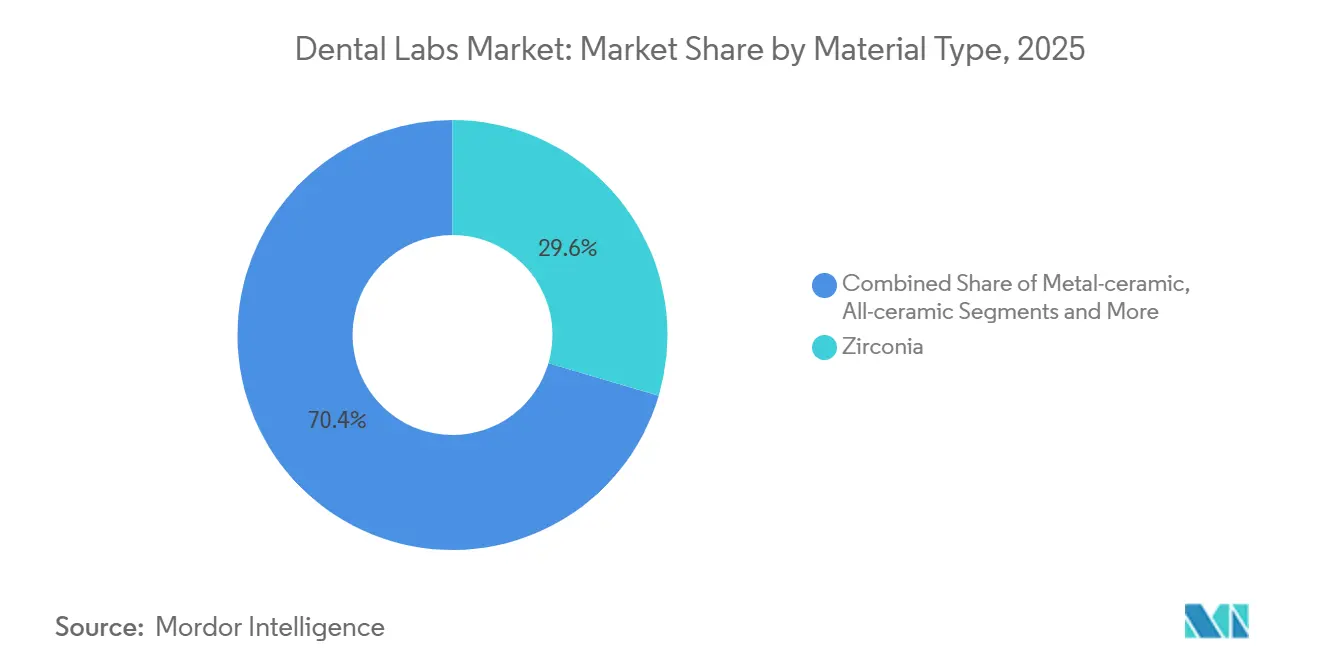
By material type, zirconia captured 29.56% of the dental labs market share in 2025, and all-ceramic materials are advancing at an 8.64% CAGR to 2031.
By workflow, the digital segment commanded 61.97% revenue in 2025 and is accelerating at a 10.66% CAGR through 2031.
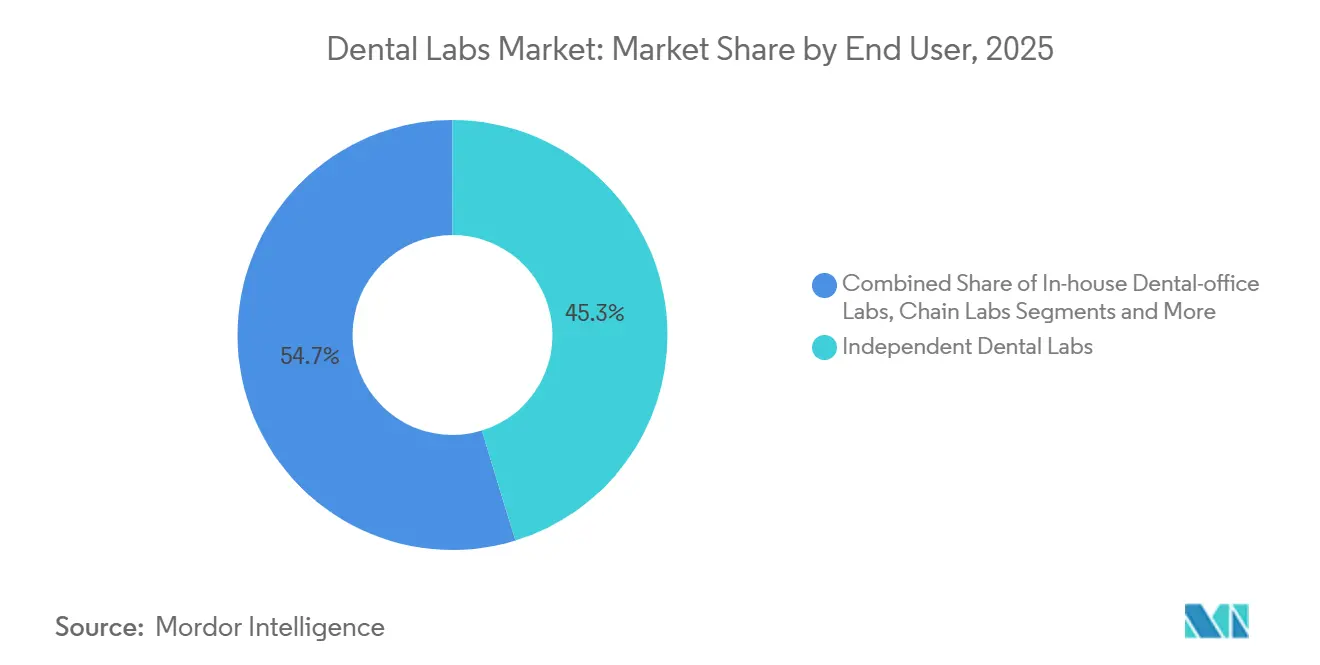
By end user, independent dental labs held 45.27% share in 2025, whereas corporate or chain labs exhibit the highest projected 8.24% CAGR across the outlook.
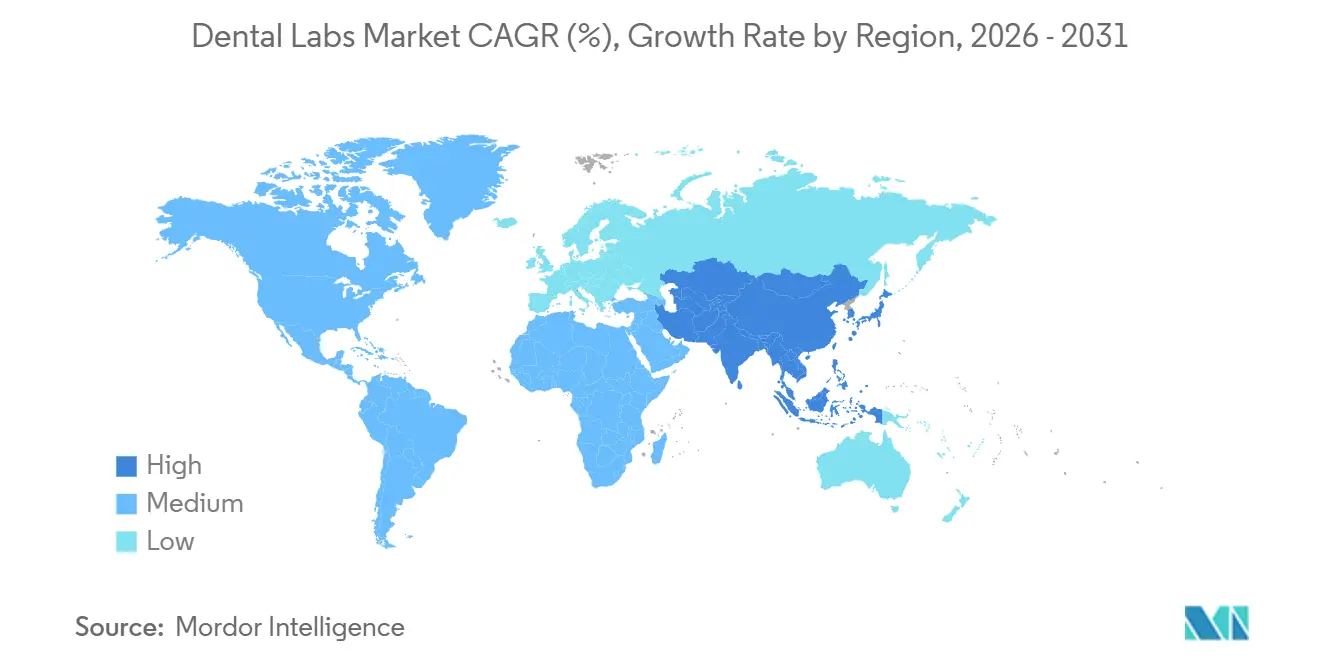
By geography, North America generated 36.32% of global revenue in 2025, while Asia-Pacific is forecast to register the fastest 8.41% CAGR through 2031.
Note: Market size and forecast figures in this report are generated using Mordor Intelligence’s proprietary estimation framework, updated with the latest available data and insights as of January 2026.
Global Dental Labs Market Trends and Insights
Drivers Impact Analysis*
| Driver | (~) % Impact on CAGR Forecast | Geographic Relevance | Impact Timeline |
|---|---|---|---|
| Increase in geriatric population | +1.2% | Japan, Germany, Italy | Long term (≥ 4 years) |
| Rising edentulism prevalence | +0.9% | South Asia, Sub-Saharan Africa | Medium term (2-4 years) |
| Growing demand for cosmetic dentistry | +0.8% | North America, Western Europe, urban Asia-Pacific | Medium term (2-4 years) |
| Advancements in digital fabrication and CAD/CAM | +1.4% | North America, Europe | Short term (≤ 2 years) |
| AI-driven scan-to-print micro-outsourcing | +1.0% | North America, Europe, spreading to Asia-Pacific | Short term (≤ 2 years) |
| DSOs consolidating global lab procurement | +0.9% | North America, Europe, Latin America | Medium term (2-4 years) |
| Source: Mordor Intelligence | |||
Increase in Geriatric Population
United Nations data show the global population aged 65 and older will reach 1.6 billion by 2050, more than doubling 2021 levels. Japan already reports 29% of residents above that age, a pattern mirrored in Italy and Germany. Tooth retention declines sharply after age 70, so full dentures and implant-retained overdentures remain high-volume cases. Pension-funded dental benefits stabilize reimbursement, which secures steady unit value even where overall procedure counts level off. Labs serving this cohort maintain premium pricing because geriatric cases often require occlusal refinements that digital automation cannot fully replace.
Rising Edentulism Prevalence
The World Health Organization estimates 7% of adults worldwide are completely toothless, with rates topping 20% in several low-income regions.[1] World Health Organization, “Oral Health Fact Sheet,” World Health Organization, who.int First-time denture wearers in India and Nigeria create high-volume opportunities when disposable income rises enough to cover sub-USD 200 prosthetics. The United States still records 13% edentulism among seniors despite decades of preventive care. Laboratories thus operate blended production lines that output both low-cost acrylic dentures for price-sensitive patients and premium implant bars for affluent clients, ensuring broad portfolio coverage.
Growing Demand for Cosmetic Dentistry
Social-media visibility and millennial purchasing power lifted cosmetic restorations to 30% of U.S. lab revenue in 2025.[2]Marko Vujicic, “The State of the U.S. Dental Economy Q2 2025 Report,” American Dental Association, ada.org Premium veneers and anterior crowns command out-of-pocket spending, which lets labs add shade-matching devices and spectrophotometers that raise case value. Double-digit veneer growth in the United Kingdom and France during 2024-2025 further underlines the trend. Urban centers in China and South Korea exhibit similar adoption as cosmetic enhancement becomes a career signal. Labs capitalize through tiered esthetic offerings that push margins above commodity crown levels.
Advancements in Digital Fabrication and CAD/CAM
Modern CAD/CAM rigs mill a zirconia crown in under 20 minutes, cutting multiday workflows into hours. Five-axis machines lower technician labor by about 40%, forcing subscale analog labs either to invest or to exit. European adoption exceeded 75% among Straumann-network partners in 2024. Newly finalized ISO accuracy standards tighten quality demands, favoring early adopters that already run calibrated production lines.
Restraints Impact Analysis*
| Restraint | (~) % Impact on CAGR Forecast | Geographic Relevance | Impact Timeline |
|---|---|---|---|
| High cost of complex restorative work | -0.7% | Global, acute in low-income regions | Medium term (2-4 years) |
| Limited reimbursement outside OECD | -0.9% | Asia-Pacific, Middle East, Africa, Latin America | Long term (≥ 4 years) |
| Chairside milling cannibalizing lab volumes | -1.1% | North America, Western Europe | Short term (≤ 2 years) |
| Supply risk of zirconia and rare-earth ceramics | -0.6% | Global, sourcing centered in Asia-Pacific | Medium term (2-4 years) |
| Source: Mordor Intelligence | |||
High Cost of Complex Restorative Work
Full-arch implant rehabilitation can exceed USD 30,000 in the United States, with laboratory fees near one-third of that bill.[3]Clementon Family Dental, “Episode #1: How Much Should I Pay for a Full Arch?,” Clementon Family Dentistry, clementonfamilydentistry.com Median U.S. household income was USD 74,580 in 2023, so many patients delay treatment or choose extractions. Emerging-market affordability is even tighter, which pushes labs to engineer cost-down solutions such as offshore milling and standardized abutment libraries.
Limited Reimbursement Outside OECD
Fewer than one-fifth of adults in India, Indonesia, or Brazil carry dental insurance. Public reimbursement caps, such as China’s USD 280 annual limit, barely cover a single three-unit bridge. Labs penetrating these regions rely on microfinance or ultra-low-cost prosthetics to expand addressable demand.
*Our forecasts treat driver/restraint impacts as directional, not additive. The impact forecasts reflect baseline growth, mix effects, and variable interactions.
Segment Analysis
By Product and Services: Software Monetization Outpaces Hardware
Equipment Type controlled 63.63% of revenue in 2025, reflecting high upfront spending on mills, printers, and scanners. Yet Software & Services will rise at 10.37% through 2031, the fastest pace among all categories. Subscription models such as exocad Chairside CAD add recurring revenue and sustain feature updates. Within hardware, CAD/CAM systems held large share, while 3-D printers expand 9.82% annually as additive manufacturing lowers waste. Consumables like zirconia blanks move in line with procedure volumes but face commoditization pressure. The shift signals that intellectual property in algorithms, not machines alone, will drive value capture across the dental labs market.
The emphasis on cloud design suites encourages labs to build proprietary plug-ins that integrate material libraries and quality dashboards, which deepens customer lock-in. ISO 13485 rules for software certification add compliance complexity that favors established vendors able to fund ongoing validation. Smaller labs often partner with third-party platforms rather than develop tools from scratch to avoid multi-million-dollar R&D outlays.


By Dental Discipline: Implants Surge Amid Aging Cohorts
Restorative work contributed 27.63% revenue in 2025, but implant-based restorations will deliver an 8.35% CAGR to 2031 as seniors demand permanence over removable dentures. Labs committed to implant workflows invest in screw-retained libraries, titanium milling, and verification jigs that command price premiums. Orthodontic demand accelerates with clear aligners, yet most volume remains with a handful of digital majors. Prosthodontic dentures still serve cost-sensitive edentulous patients, though implants nibble share when financing plans gain traction.
Complex full-arch bars generate higher unit revenue and therefore buffer labs from chairside crown erosion. However, technicians need implant-specific skills and validation protocols, which raises training costs. This specialization creates a capability gap that favors large laboratories able to hire or train implant teams.
By Material Type: All-Ceramic Momentum Intensifies
Zirconia held the largest single slice at 29.56% in 2025, yet all-ceramic systems will grow 8.64% because patients and clinicians prefer metal-free restorations. Multi-layered blanks such as IPS e.max ZirCAD Prime recreate enamel translucency while meeting posterior strength requirements. PMMA resins stay relevant in denture bases thanks to low cost, and metal frameworks remain necessary for certain partials. ISO 6872 updates raise the performance bar, which helps premium suppliers differentiate from commodity imports. Laboratories with wide material menus capture broad case mixes and hedge supply volatility.
Printing resins specifically tuned for dentures and surgical guides widen material diversity. GC Initial LiSi Block offers chairside-friendly lithium disilicate that crystallizes quickly, supporting same-day esthetic cases. Such innovations point to continuous material churn that requires constant technician retraining.
By Workflow: Digital Dominance Deepens
Digital workflows brought in 61.97% of revenue in 2025 and post a hefty 10.66% CAGR, well ahead of the overall dental labs market. The dental labs market size attributed to digital production will therefore expand sharply through 2031. Intraoral scanners remove physical impressions and upload STL files to cloud platforms, which route jobs to the closest node for printing or milling. The NADL reported 68% of U.S. labs using at least one form of 3-D printing in 2024. Conventional plaster workflows persist where low costs matter or where technicians still excel at manual porcelain layering, but their share keeps shrinking.
Large lab chains run distributed manufacturing similar to e-commerce fulfillment, where a California design hub can direct physical output to Colorado for next-day delivery. Independent shops that straddle digital and analog often stretch capital and lose efficiency, so many either specialize or consolidate.
By End User: Chains Capture Share from Independents
Independent labs retained 45.27% share in 2025, yet chain labs backed by private equity will post an 8.24% CAGR. National Dentex Labs already operates national purchasing programs that lower zirconia costs 22% below industry average. Chairside in-office production meets urgent single-unit needs but handles few complex cases. Academic institutes contribute mostly to innovation rather than commercial volume.
Glidewell’s 165,000 sq ft campus with 600 mills produces 30,000 units each day, ensuring economies of scale independents cannot match. Surviving independents form buying co-ops or specialize in artisan esthetics to escape price wars.
Geography Analysis
North America delivered 36.32% of 2025 global revenue, driven by high procedure volumes and early CAD/CAM uptake. Yet chairside systems and reimbursement pressure temper growth to low single digits. The dental labs market size in the region remains the highest worldwide but is moving toward margin compression rather than unit expansion.
Asia-Pacific is the fastest-growing territory with an 8.41% CAGR through 2031. China’s oral-health campaign seeks 60% dental visit coverage by 2030, while India’s liberalized medical-device policy drew USD 1.2 billion investment in 2024-2025. Japan’s aging population keeps denture and implant demand resilient despite economic stagnation. South Korea leverages medical tourism, which lifts premium anterior esthetic work.
In Europe, Germany benefits from statutory reimbursement that covers up to 75% of prosthetic costs, sustaining volume. Conversely, United Kingdom NHS shortages curb demand for complex restorative work, sharpening private-sector segmentation. EU MDR’s 2024 enforcement adds compliance costs, accelerating consolidation toward labs able to finance quality-management programs.

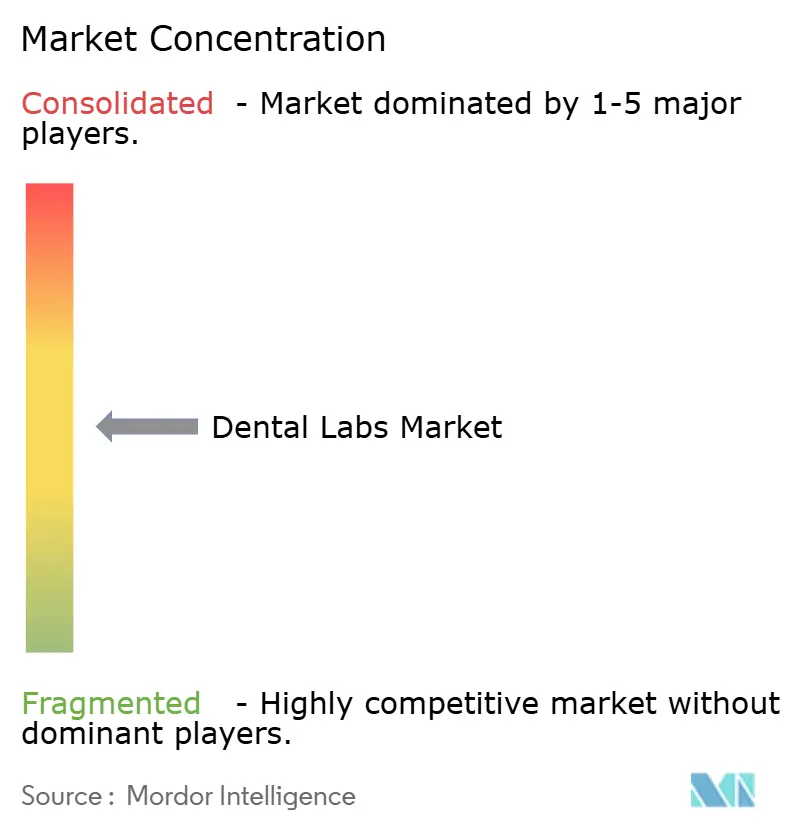
Competitive Landscape
The dental labs market shows moderate fragmentation. Device giants like Dentsply Sirona, Straumann, and Envista integrate scanners, CAD software, mills, and materials into subscription ecosystems that collect fees throughout the treatment chain. Emerging digital platforms such as Dandy bypass traditional lab-dentist links by offering direct design services through teledentistry frameworks opened during the pandemic.
Scale and technology define the advantage. Labs that deploy AI design automation cut labor costs by 30-40%, enabling aggressive bids for commodity crowns. EnvisionTEC’s Vida printer produces 60 denture bases every eight-hour shift at less than USD 15 per unit, beating conventional flask methods. Patent activity in materials and workflows climbed 18% in 2024, with Ivoclar, GC, and 3M leading in ceramic innovation.
Compliance with ISO 13485 and EU MDR splits the field. Certified labs access multinational chains and export markets, while uncertified shops stay domestic and cash-pay, widening the performance gap. Overall, technological adoption, subscription software, and vertical integration keep raising entry barriers, pushing the dental labs market toward higher concentration over time.
Dental Labs Industry Leaders
Dentsply Sirona
Straumann Group
Envista Holdings
Ivoclar Vivadent
Glidewell Dental
- *Disclaimer: Major Players sorted in no particular order

Recent Industry Developments
- October 2025: Investment firm ARCHIMED completed its purchase of ZimVie Inc., giving the private-equity specialist full ownership of the fast-growing dental-implant supplier.
- September 2025: Geistlich Pharma, advised by Baker McKenzie, acquired a minority stake in TRI Dental Implants International AG, deepening both companies’ focus on digital implant solutions.
- September 2025: Laser specialist BIOLASE entered a new chapter after its sale to MegaGen Implant, a deal expected to accelerate product development and customer support.
- March 2025: Mikrona Group closed its acquisition of Dental Axess AG, adding CAD/CAM systems, intraoral scanners, 3-D printers and imaging software that enhance Mikrona’s digital-dentistry portfolio.


Global Dental Labs Market Report Scope
As per the scope of the report, dental laboratories manufacture or customize a wide range of products to help dentists in the delivery of oral health care. Crowns, bridges, and dentures are examples of these products.
The dental labs market is segmented by product and services, dental descipline, material type, workflow, end user and geography. By Product and Services, the market is segmented into Equipment Type, Consumables and Accessories, Software and Services. By Dental Discipline, the market is segmented into Orthodontics, Endodontics, Restorative, Oral Care, Implants, and Prosthodontics. By Material Type, the market is segmented into Metal-ceramic, Zirconia, All-ceramic, Acrylic & Resins, Metals & Alloys, and Others. By Workflow, the market is segmented into Digital and Conventional/Analog. By End User, the market is segmented into Independent Dental Labs, Corporate/Chain Labs, In-house Dental-office Labs, and Academic & Research Institutes. By geography, the market is segmented into North America, Europe, Asia-Pacific, Middle East and Africa, and South America. For each segment, the market size is provided in terms of value (USD).
| Equipment Type | Milling Equipment |
| Dental Scanners | |
| 3-D Printing Systems | |
| CAD/CAM Systems | |
| Casting Machines | |
| Radiology Equipment | |
| Other Equipment Types | |
| Consumables and Accessories | |
| Software and Services |
| Orthodontics |
| Endodontics |
| Restorative |
| Oral Care |
| Implants |
| Prosthodontics |
| Metal-ceramic |
| Zirconia |
| All-ceramic |
| Acrylic & Resins |
| Metals & Alloys |
| Others |
| Digital |
| Conventional / Analog |
| Independent Dental Labs |
| Corporate / Chain Labs |
| In-house Dental-office Labs |
| Academic & Research Institutes |
| North America | United States |
| Canada | |
| Mexico | |
| Europe | Germany |
| France | |
| United Kingdom | |
| Italy | |
| Spain | |
| Rest of Europe | |
| Asia-Pacific | China |
| Japan | |
| India | |
| South Korea | |
| Australia | |
| Rest of Asia-Pacific | |
| Middle East & Africa | GCC |
| South Africa | |
| Rest of Middle East & Africa | |
| South America | Brazil |
| Argentina | |
| Rest of South America |
| By Product and Services | Equipment Type | Milling Equipment |
| Dental Scanners | ||
| 3-D Printing Systems | ||
| CAD/CAM Systems | ||
| Casting Machines | ||
| Radiology Equipment | ||
| Other Equipment Types | ||
| Consumables and Accessories | ||
| Software and Services | ||
| By Dental Discipline | Orthodontics | |
| Endodontics | ||
| Restorative | ||
| Oral Care | ||
| Implants | ||
| Prosthodontics | ||
| By Material Type | Metal-ceramic | |
| Zirconia | ||
| All-ceramic | ||
| Acrylic & Resins | ||
| Metals & Alloys | ||
| Others | ||
| By Workflow | Digital | |
| Conventional / Analog | ||
| By End User | Independent Dental Labs | |
| Corporate / Chain Labs | ||
| In-house Dental-office Labs | ||
| Academic & Research Institutes | ||
| By Geography | North America | United States |
| Canada | ||
| Mexico | ||
| Europe | Germany | |
| France | ||
| United Kingdom | ||
| Italy | ||
| Spain | ||
| Rest of Europe | ||
| Asia-Pacific | China | |
| Japan | ||
| India | ||
| South Korea | ||
| Australia | ||
| Rest of Asia-Pacific | ||
| Middle East & Africa | GCC | |
| South Africa | ||
| Rest of Middle East & Africa | ||
| South America | Brazil | |
| Argentina | ||
| Rest of South America | ||


Key Questions Answered in the Report
How big is the dental labs market in 2026 and how fast is it growing?
The dental labs market size reached USD 27.76 billion in 2026 and is forecast to grow at a 6.19% CAGR to USD 37.49 billion by 2031.
Which product category will outpace overall industry growth?
Software & Services will post a 10.37% CAGR, the fastest among all product groups, as laboratories pivot to subscription design platforms.
Why are implants important for dental laboratories?
Implant restorations carry higher unit fees and will expand at an 8.35% CAGR because aging populations prefer fixed solutions over removable dentures.
What region offers the strongest future growth?
Asia-Pacific will record the steepest 8.41% CAGR thanks to expanded oral-health programs in China and increased foreign investment in India.
How are Dental Support Organizations changing laboratory economics?
DSOs bundle large case volumes, demand 20-30% price concessions, and favor labs that integrate seamlessly with their digital order portals, accelerating consolidation of independent labs.
Page last updated on:


