Market Overview
| Study Period | 2020 - 2031 |
|---|---|
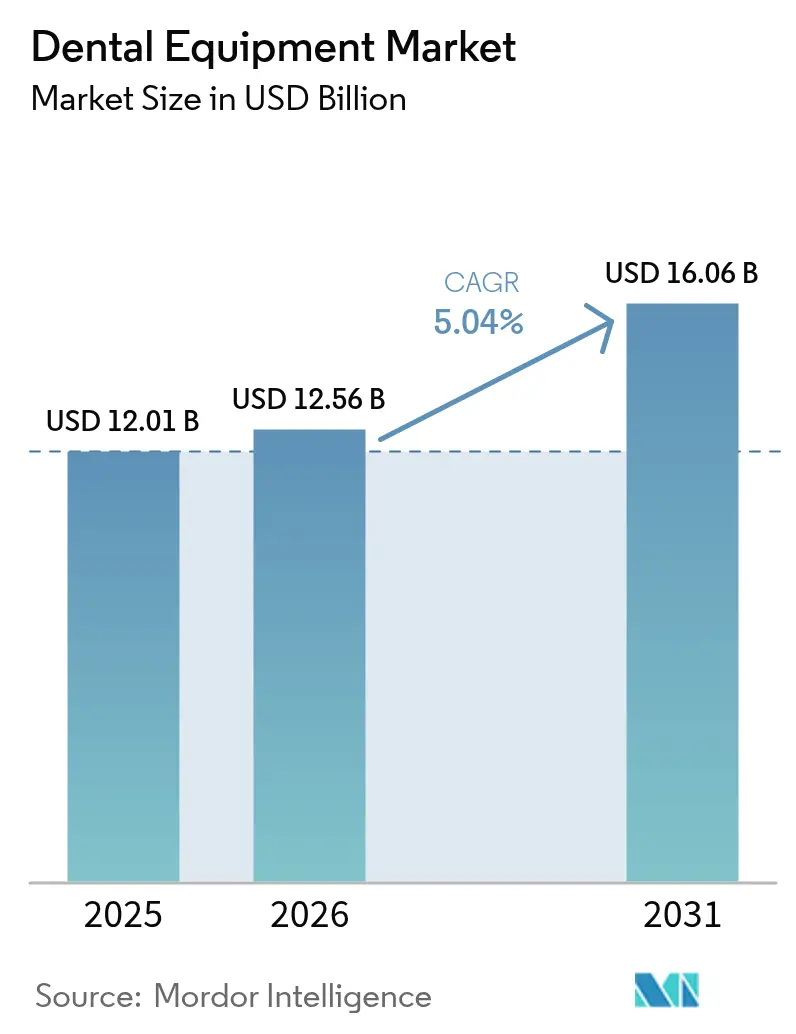
| Market Size (2026) | USD 12.56 Billion |
| Market Size (2031) | USD 16.06 Billion |
| Growth Rate (2026 - 2031) | 5.04% CAGR |
| Fastest Growing Market | Asia Pacific |
| Largest Market | North America |
| Market Concentration | Low |
Major Players*Disclaimer: Major Players sorted in no particular order Image © Mordor Intelligence. Reuse requires attribution under CC BY 4.0. | |
Dental Equipment Market Analysis by Mordor Intelligence
The Dental Equipment Market size is expected to grow from USD 12.01 billion in 2025 to USD 12.56 billion in 2026 and is forecast to reach USD 16.06 billion by 2031 at 5.04% CAGR over 2026-2031.
Digitization is compressing replacement cycles as cone-beam CT, intraoral scanners, and chairside CAD/CAM systems displace film X-ray and vinyl polysiloxane impressions. Practices that embed AI into radiology workflows trim diagnostic time and boost case acceptance, while near-real-time 3-D printing reduces reliance on the laboratory and cuts material waste by up to 40%. Aging populations, especially in Japan, Germany, and Italy, continue to drive the expansion of implant procedures, while rising dental tourism hubs in China and India are fueling demand for premium equipment. Sustainability mandates in the European Union and select U.S. states are pressuring vendors to phase out single-use plastics and pilot bio-based polymers, tilting procurement toward recyclable ancillaries.
Key Report Takeaway
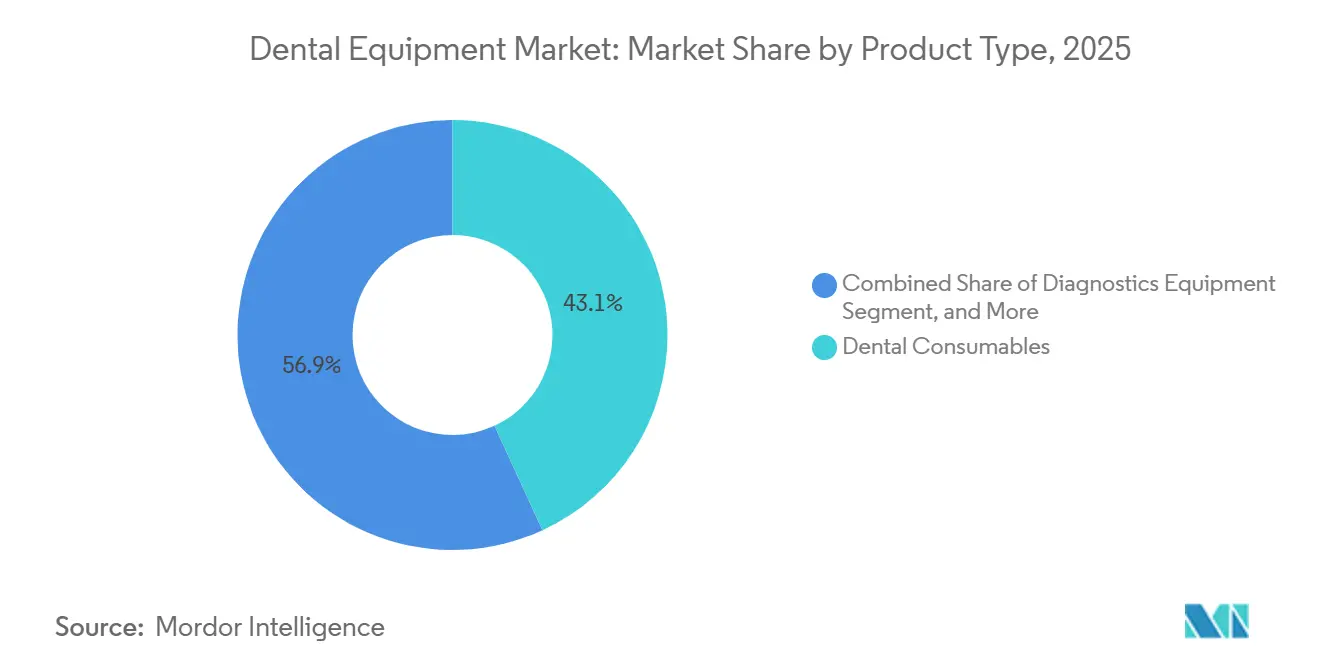
- By product category, dental consumables led with 43.12% revenue share in 2025, while diagnostics equipment is projected to expand at a 6.85% CAGR through 2031.
- By treatment modality, prosthodontic procedures accounted for 38.05% of the dental equipment market size in 2025, whereas Orthodontic equipment is advancing at a 9.33% CAGR through 2031.
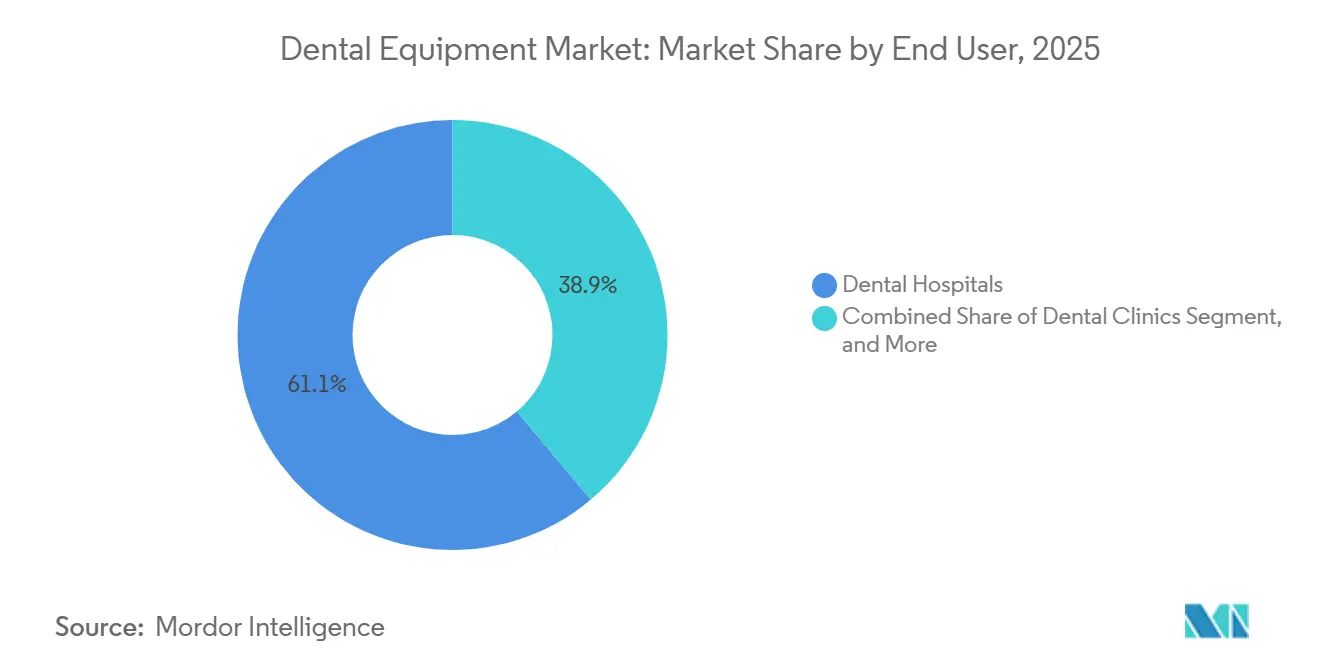
- By end user, dental hospitals held 61.12% of the dental equipment market share in 2025, while dental clinics are forecast to grow at a 10.93% CAGR to 2031.
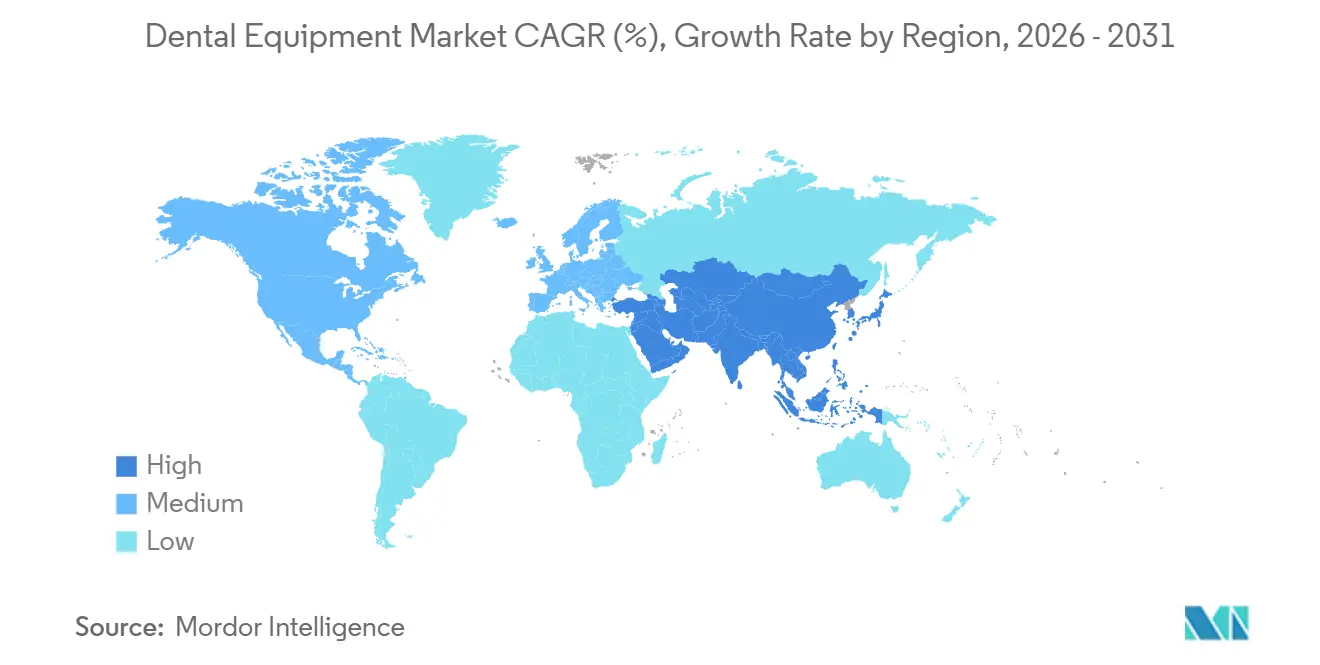
- By geography, North America held 41.78% of the dental equipment market share in 2025; Asia-Pacific is the are forecast to grow at a 8.93% CAGR to 2031.
Note: Market size and forecast figures in this report are generated using Mordor Intelligence’s proprietary estimation framework, updated with the latest available data and insights as of 2026.
Global Dental Equipment Market Trends and Insights
Driver Impact Analysis*
| Driver | (~) % Impact on CAGR Forecast | Geographic Relevance | Impact Timeline |
|---|---|---|---|
| Digitization of Dental Practices | +1.2% | North America, Western Europe | Medium term (2–4 years) |
| Rapid Growth of Clear-Aligner Models | +0.9% | North America, Europe, APAC cities | Short term (≤2 years) |
| Aging Population & Tooth-Loss Prevalence | +1.0% | Global, pronounced in Japan, Germany, Italy | Long term (≥4 years) |
| Emerging-Economy Chair Expansion | +0.7% | China, India, wider MEA | Medium term (2–4 years) |
| AI-Based Radiology Enhancements | +0.6% | North America, EU, select APAC | Short term (≤2 years) |
| In-office 3-D Printing of Prosthetics | +0.5% | North America, Europe, Australia | Medium term (2–4 years) |
| Source: Mordor Intelligence | |||
Digitization of Dental Practices (Intraoral Scanners, CAD/CAM)
Clinical studies covering 42 trials in 2025 found that leading scanners achieve 20 µm trueness for single-unit crowns on par with traditional impressions, while eliminating shipping delays.[1]Diagnostics Journal, “Artificial Intelligence in Dentistry 2025,” mdpi.com Same-visit CAD/CAM restorations now finish in 90 minutes, reducing patient no-shows. Laboratories increasingly prefer STL files, so analog-only practices lose momentum in referrals. Newer scanners embed near-infrared modules that detect subsurface caries, creating preventive-care upsell paths.
Rapid Growth of Clear-Aligner Service Models
Align Technology shipped 2.84 million aligner cases in Q4 2025, 18% via direct-to-consumer channels. Vertically integrated fabrication cuts turnaround from six weeks to ten days and trims per-case cost by 30%. Subscription orthodontic plans bundle aligners, periodic scans, and app-based monitoring, commoditizing mild-malocclusion therapy. State-level teledentistry rules vary, adding compliance risk for solo orthodontists.
Aging Population & Tooth-Loss Prevalence
The 60-plus demographic will double to 2.1 billion by 2050.[2]World Health Organization, “Global Health and Aging Report,” who.int Edentulism drives implants, bridges, and dentures, which together account for more than half of prosthodontic equipment demand. Japan’s 8020 campaign, aiming for 20 natural teeth retained at age 80, paradoxically accelerates implant placement as seniors seek functional restoration.
Emerging Economies’ Chair-Per-Dentist Expansion
China aims to reach 3.2 dentists per 10,000 people by 2030, requiring about 80,000 new dental chairs.[3]National Health Commission of China, “Dental Health Targets 2025,” nhc.gov.cn India welcomed 500,000 dental-tourism patients in 2025, generating USD 1.2 billion in revenue, fueling premium imaging demand. Vendors offering modular, upgradable units win share in this price-sensitive yet aspirational segment.
Restraint Impact Analysis*
| Restraint | (~) % Impact on CAGR Forecast | Geographic Relevance | Impact Timeline |
|---|---|---|---|
| High Upfront Capital Cost for Mid-Size Clinics | –0.8% | Latin America, Southeast Asia | Short term (≤2 years) |
| Shortage of Qualified Dental Technicians | –0.6% | North America, Europe, Australia | Medium term (2–4 years) |
| Data-Security Concerns in Cloud Imaging | –0.4% | EU, North America | Short term (≤2 years) |
| Sustainability Pressure on Single-Use Plastics | –0.3% | EU, select U.S. states | Long term (≥4 years) |
| Source: Mordor Intelligence | |||
High Upfront Capital Cost for Mid-Size Clinics
A digital operatory costs USD 250,000–400,000, which is beyond the annual revenue of many two-chair practices. Elevated interest rates in 2025-2026 inflate leasing-plan outlays, and tariffs add 15-25% to list prices in Brazil and Indonesia. Modular scanners help, yet adoption stays muted in cost-sensitive settings.
Shortage of Qualified Dental Technicians
The United States faces an 8,000-technician shortfall by 2030. German labs report lead times stretching from 10 days in 2020 to 18 days in 2025. Semi-automated milling eases load, but anterior esthetics still depend on hand-layered ceramics, keeping throughput tight.
*Our forecasts treat driver/restraint impacts as directional, not additive. The impact forecasts reflect baseline growth, mix effects, and variable interactions.
Segment Analysis
By Product: Consumables Anchor Revenue, Diagnostics Accelerate
Dental consumables captured 43.12% of the dental equipment market share in 2025 on recurring implant and biomaterial sales. Diagnostics equipment, however, is forecast to climb at a 6.85% CAGR to 2031, outpacing all other products. The dental equipment market size for cone-beam CT is expanding as practices replace 2-D panoramic units, spurred by IAEA guidelines encouraging digital substitution. Electric handpieces gain favor for torque control, while diode and erbium lasers remain niche because acquisition costs exceed USD 15,000, and reimbursement pathways are limited.
Radiology refresh cycles are quickening: digital sensors cut exposure by up to 70% compared to film and integrate seamlessly with AI triage software. Consumables growth is moderating, pressured by generic implant entries from South Korea and Israel priced 30% below legacy brands. Suppliers hedge margin erosion by bundling implants with planning software subscriptions, reinforcing ecosystem stickiness.


By Treatment: Orthodontics Surge on Aligner Momentum
Prosthodontic equipment accounted for 38.05% of the dental equipment market in 2025, reflecting the high cost of implant hardware. Orthodontic equipment is forecast to record a 9.33% CAGR through 2031, the fastest among modalities. Clear-aligner workflows rely on scanners, thermoformers, and AI simulation, reducing demand for traditional arch-forming pliers. Align Technology’s AI-enabled ClinCheck models hit 95% tooth-movement accuracy, minimizing refinements.
Endodontic systems innovate around nickel-titanium flexibility and reciprocation to curb file separation, while periodontic ultrasonic scalers benefit from growing links between gum disease and cardiovascular health. The orthodontic surge compresses per-practice instrument spend but expands software licensing revenue, shifting value from hardware to digital planning.
By End User: Clinics Outpace Hospitals on DSO Expansion
Dental hospitals retained 61.12% of 2025 revenue by absorbing capital-intensive imaging suites and sedation equipment. Dental clinics, however, are projected to rise at a 10.93% CAGR to 2031 as dental service organizations (DSOs) roll up independent practices. DSOs such as Heartland and Aspen operate more than 2,500 U.S. sites collectively, standardizing equipment and securing multi-year servicing contracts. The dental equipment market benefits as volume discounts unlock scanner adoption among mid-tier clinics.
Academic institutes are piloting robotics-assisted implant placement and tissue bioprinting, but contribute modest volumes. Mobile and public-health units demand ruggedized, battery-operated X-ray devices, a small yet socially critical niche that suppliers serve through NGO partnerships.
Geography Analysis
North America held 41.78% of 2025 revenue. U.S. per-capita dental spend averages USD 350, nearly triple the global mean, and involves replacement every 5 to 7 years. FDA clearance of six dental AI tools in 2025 eases compliance anxiety and accelerates AI-radiology rollouts. Canada’s expanded public program funds durable chairs for community clinics, while Mexico’s dental-tourism hubs invest in same-day CAD/CAM to entice 1.2 million U.S. patients.
Asia Pacific is forecast to grow at an 8.93% CAGR through 2031, the quickest regional pace. China added 12,000 private practices in 2025 and plans 80,000 new chairs by 2030. India’s USD 1.2 billion dental-tourism sector sources cone-beam CT and guided-implant kits to differentiate from domestic competitors. Japan’s 29% share of residents over 65 accelerates implant demand, while South Korea exports mid-tier scanners to Southeast Asia at a 40% discount to Western lines.
Europe’s market is shaped by the 2024 Medical Device Regulation, which increases evidence requirements for Class IIa devices. Germany’s 7,000 labs adopt semi-automated sintering to offset technician shortages. The U.K.’s capacity crunch shifts patients to private clinics eager for digital workflows. France upgrades imaging suites to serve North-African tourists. Meanwhile, GCC nations are building medical-tourism hubs with state-of-the-art implant centers, whereas sub-Saharan Africa still averages one dentist per 50,000 residents, creating future opportunities for portable medical equipment. South American growth is concentrated in Brazil and Argentina, where private insurance is boosting demand for aesthetic dentistry reliant on advanced imaging.

Competitive Landscape
The dental equipment market remains moderately fragmented. Straumann’s USD 85 million purchase of a Chinese distributor in January 2025 secures 3,000 clinic relationships and localizes service, countering domestic rivals Osstem and DIO. Dentsply Sirona’s DS Core ecosystem links Primescan scanners to CEREC mills, cutting implant crown chairtime by 40%.
Open-architecture insurgents leverage interoperability. 3Shape’s TRIOS accepts any CAD software, luring cost-conscious labs. AI start-ups Overjet, Pearl, and VideaHealth pursue sensor-level integration, but regulatory burn rates challenge scale. Sustainability gaps persist; no incumbent offers a fully reusable cassette, granting space for BEGO and Coltene’s bio-resin pilots. Clear-aligner rivalry intensifies: Align’s ten-day turnaround forces SmileDirectClub and ClearCorrect to open regional print farms, squeezing margins yet meeting consumer speed expectations.
Dental Equipment Industry Leaders
3M
Dentsply Sirona
GC Corporation
A-Dec Inc.
Aseptico Inc.
- *Disclaimer: Major Players sorted in no particular order

Recent Industry Developments
- May 2025: Planmeca introduced the Viso G1 CBCT unit, ProX GO handheld X-ray, and Onyx wireless scanner, complemented by Romexis 7 software featuring integrated AI tools for automated pathology detection.
- March 2025: Dentsply Sirona unveiled greener packaging and energy-efficient milling units while pledging carbon-neutral operations by 2030
- January 2025: NovaBone partnered with BEGO to distribute bone-graft dental putty cartridges across Europe, strengthening regenerative portfolios


Global Dental Equipment Market Report Scope
As per the scope of the report, dental equipment refers to tools used by dental professionals to provide dental treatment. These include tools to examine, manipulate, treat, restore, and remove teeth and surrounding oral structures. Standard instruments are used to examine, restore, extract teeth, and manipulate tissues.
The dental equipment market is segmented by product, treatment, end user, and geography. The product segment is further divided into operatory and treatment center equipment, dental laboratory equipment, dental lasers, and diagnostic dental equipment. The operatory and treatment center equipment is further divided into dental units, dental handpieces, dental light-curing equipment, electrosurgical systems, and others. The dental laboratory equipment segment is further segmented into CAD/CAM systems, milling equipment, 3D printing equipment, casting machines, ceramic furnaces, and others. The dental lasers segment is further segmented into soft tissue lasers and hard tissue lasers. The diagnostic dental equipment segment is further divided into extraoral imaging systems and intraoral imaging systems. The treatment segment is further divided into orthodontic, endodontic, periodontic, and prosthodontic. The end-user segment is further segmented into hospitals, clinics, and other end-users. The geography segment is further divided into North America, Europe, Asia-Pacific, Middle East and Africa, and South America. The report also covers the estimated market sizes and trends for 17 countries across major regions globally. The report offers the market size and forecasts in value (USD) for the above segments.
By Product
| Diagnostics Equipment | Dental Laser | Soft Tissue Lasers |
| Hard Tissue Lasers | ||
| Radiology Equipment | Extra-oral Radiology Equipment | |
| Intra-oral Radiology Equipment | ||
| Dental Chair & Equipment | ||
| Therapeutic Equipment | Dental Hand Pieces | |
| Electrosurgical Systems | ||
| CAD/CAM Systems | ||
| Milling Equipment | ||
| Casting Machine | ||
| Other Therapeutic Equipment | ||
| Dental Consumables | Dental Biomaterial | |
| Dental Implants | ||
| Crowns & Bridges | ||
| Other Dental Consumables | ||
| Other Dental Equipments | ||
By Treatment
| Orthodontic |
| Endodontic |
| Periodontic |
| Prosthodontic |
By End User
| Dental Hospitals |
| Dental Clinics |
| Academic & Research Institutes |
| Other End Users |
By Geography
| North America | United States |
| Canada | |
| Mexico | |
| Europe | Germany |
| United Kingdom | |
| France | |
| Italy | |
| Spain | |
| Rest of Europe | |
| Asia-Pacific | China |
| Japan | |
| India | |
| Australia | |
| South Korea | |
| Rest of Asia-Pacific | |
| Middle East & Africa | GCC |
| South Africa | |
| Rest of Middle East & Africa | |
| South America | Brazil |
| Argentina | |
| Rest of South America |
| By Product | Diagnostics Equipment | Dental Laser | Soft Tissue Lasers |
| Hard Tissue Lasers | |||
| Radiology Equipment | Extra-oral Radiology Equipment | ||
| Intra-oral Radiology Equipment | |||
| Dental Chair & Equipment | |||
| Therapeutic Equipment | Dental Hand Pieces | ||
| Electrosurgical Systems | |||
| CAD/CAM Systems | |||
| Milling Equipment | |||
| Casting Machine | |||
| Other Therapeutic Equipment | |||
| Dental Consumables | Dental Biomaterial | ||
| Dental Implants | |||
| Crowns & Bridges | |||
| Other Dental Consumables | |||
| Other Dental Equipments | |||
| By Treatment | Orthodontic | ||
| Endodontic | |||
| Periodontic | |||
| Prosthodontic | |||
| By End User | Dental Hospitals | ||
| Dental Clinics | |||
| Academic & Research Institutes | |||
| Other End Users | |||
| By Geography | North America | United States | |
| Canada | |||
| Mexico | |||
| Europe | Germany | ||
| United Kingdom | |||
| France | |||
| Italy | |||
| Spain | |||
| Rest of Europe | |||
| Asia-Pacific | China | ||
| Japan | |||
| India | |||
| Australia | |||
| South Korea | |||
| Rest of Asia-Pacific | |||
| Middle East & Africa | GCC | ||
| South Africa | |||
| Rest of Middle East & Africa | |||
| South America | Brazil | ||
| Argentina | |||
| Rest of South America | |||


Key Questions Answered in the Report
How large is the dental equipment market in 2026?
It is valued at USD 12.56 billion in 2026 with a 5.04% CAGR projected through 2031.
Which product category grows fastest through 2031?
Diagnostics equipment, led by cone-beam CT and wireless sensors, is forecast to expand at a 6.85% CAGR.
Why are clear aligners boosting equipment demand?
Aligner workflows require intraoral scanners, AI planning software, and thermoforming units, driving a 9.33% CAGR in orthodontic equipment.
What hinders digital-equipment adoption in emerging clinics?
Upfront capital costs of USD 250,000–400,000 and import tariffs in Brazil and Indonesia slow investment.
Which region is the fastest-growing for dental equipment?
Asia Pacific is set to rise at an 8.93% CAGR through 2031, fueled by clinic expansion in China and India.
Page last updated on:


