Cosmetic Dentistry Market Size and Share
Market Overview
| Study Period | 2020 - 2031 |
|---|---|
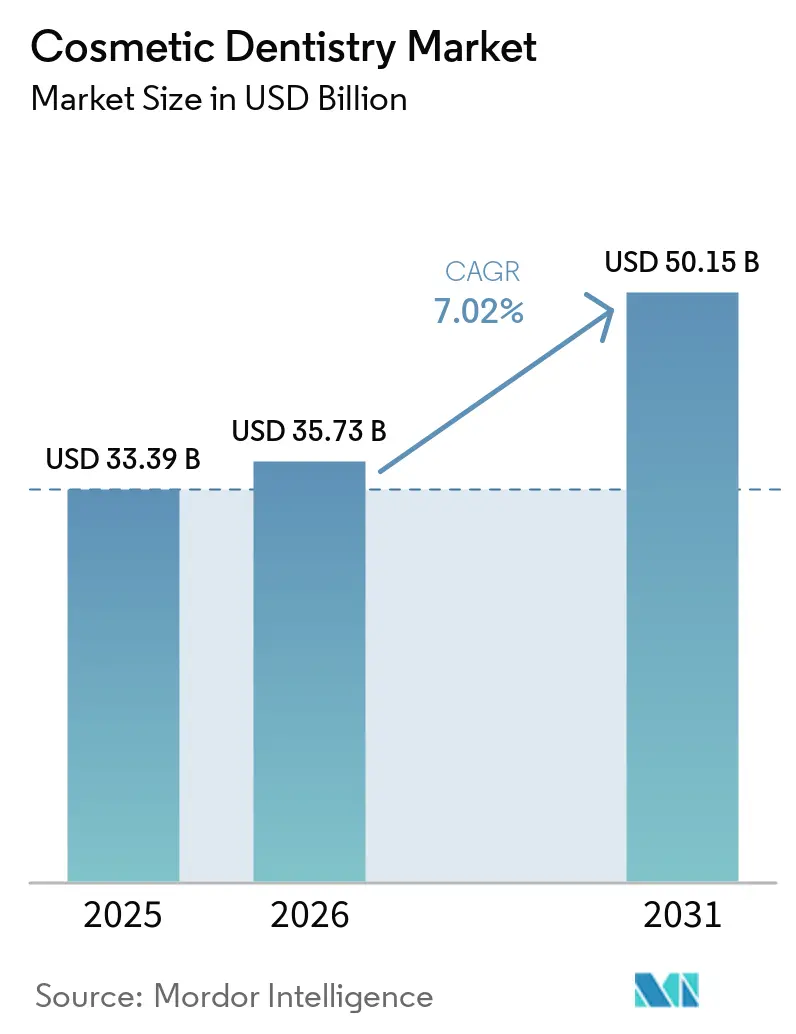
| Market Size (2026) | USD 35.73 Billion |
| Market Size (2031) | USD 50.15 Billion |
| Growth Rate (2026 - 2031) | 7.02% CAGR |
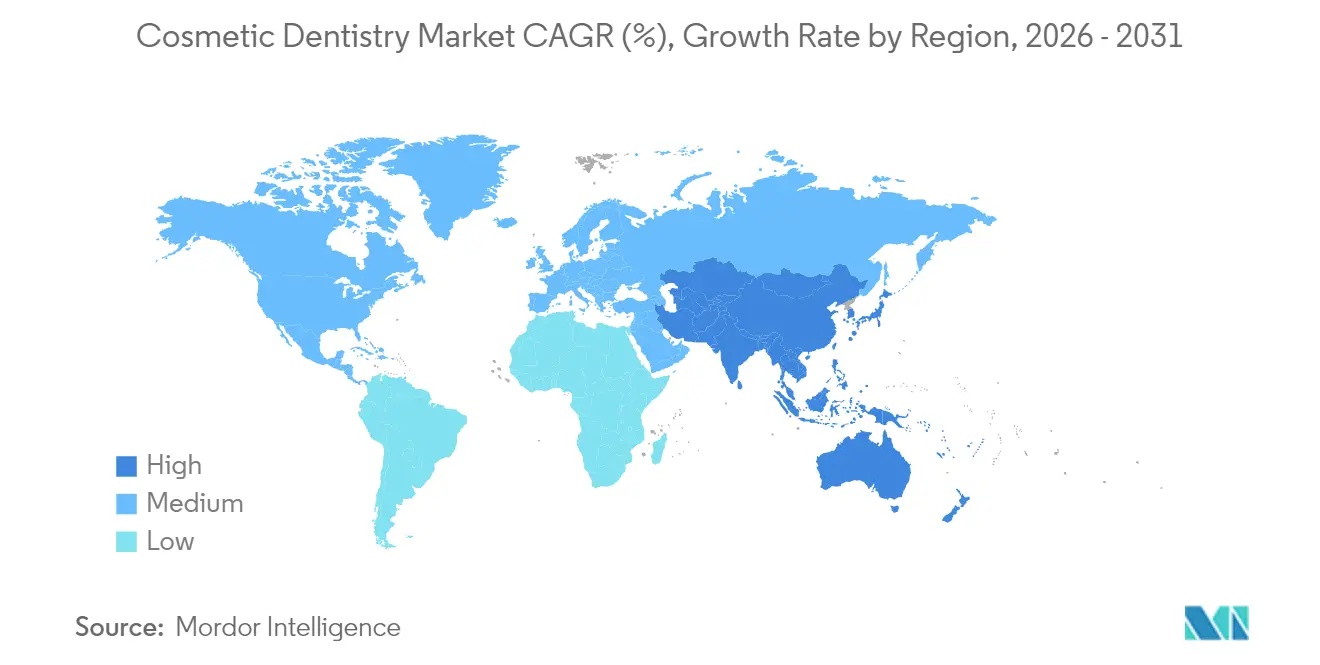
| Fastest Growing Market | Asia Pacific |
| Largest Market | North America |
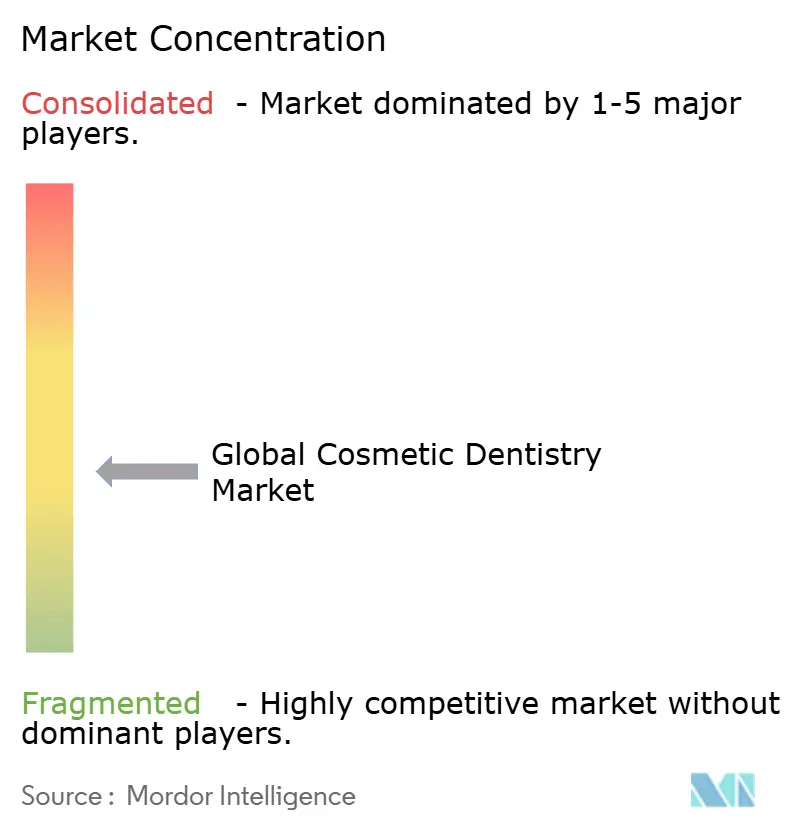
| Market Concentration | Medium |
Major Players *Disclaimer: Major Players sorted in no particular order Image © Mordor Intelligence. Reuse requires attribution under CC BY 4.0. | |
Cosmetic Dentistry Market Analysis by Mordor Intelligence
The cosmetic dentistry market size was valued at USD 33.39 billion in 2025 and estimated to grow from USD 35.73 billion in 2026 to reach USD 50.15 billion by 2031, at a CAGR of 7.02% during the forecast period (2026-2031). Rising demand for elective smile enhancements, lifestyle shifts toward social-media visibility, and rapid integration of chairside digital workflows are the primary growth engines. Clear aligner therapy is expanding at a 9.31% CAGR as shape-memory polymers and AI-guided planning shorten treatment times. Asia Pacific is advancing at 8.03% CAGR, driven by surging middle-class disposable incomes and aggressive clinic investment in digital orthodontics, while North America retains a 39.82% revenue foothold through widespread insurance adoption of restorative codes and a dense network of dental service organizations (DSOs). Across regions, tighter mercury regulations hasten the transition from amalgam to ceramic and composite solutions, pressing small practices to modernize or partner with corporate groups to fund CAD/CAM upgrades.
Key Report Takeaways
- By product type, dental systems and equipment held 33.62% revenue share in 2025, whereas clear aligners are forecast to expand at a 8.98% CAGR through 2031.
- By procedure type, orthodontic correction commanded 32.05% of the cosmetic dentistry market share in 2025, while esthetic enhancement is projected to grow at an 8.05% CAGR to 2031.
- By age group, adults accounted for 82.25% of the cosmetic dentistry market in 2025; teenagers are forecast to post the highest 8.31% CAGR between 2026 and 2031.
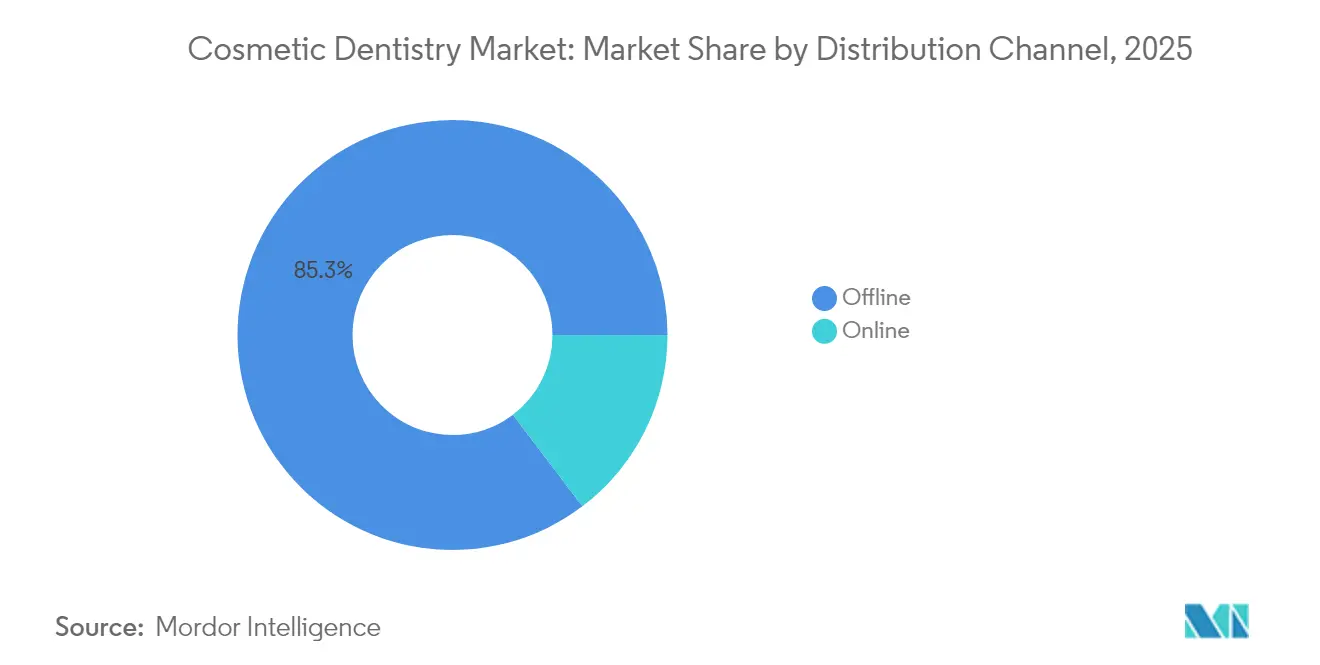
- By distribution channel, offline outlets captured 85.32% of the cosmetic dentistry market size in 2025, whereas online platforms are set to rise at a 8.72% CAGR through 2031.
- By end-user, dental clinics led with 63.78% revenue share in 2025, while DSOs are advancing at a 7.52% CAGR through 2031.
- By geography, North America held 39.35% of the cosmetic dentistry market share in 2025, whereas Asia-Pacific exhibits the fastest 7.71% CAGR through 2031.
Note: Market size and forecast figures in this report are generated using Mordor Intelligence’s proprietary estimation framework, updated with the latest available data and insights as of 2026.
Global Cosmetic Dentistry Market Trends and Insights
Drivers Impact Analysis*
| Driver | (~) % Impact on CAGR Forecast | Geographic Relevance | Impact Timeline |
|---|---|---|---|
| “Zoom-Boom” social-media visibility | +1.8% | North America, Europe, Global urban hubs | Short term (≤ 2 years) |
| Direct-to-consumer clear-aligner platforms | +1.7% | North America, Europe, Urban Asia Pacific | Short term (≤ 2 years) |
| Chairside CAD/CAM adoption by corporate groups | +1.5% | North America, Western Europe, Australia | Medium term (2-4 years) |
| Cross-border dental tourism | +1.2% | Asia Pacific, Eastern Europe, Latin America | Medium term (2-4 years) |
| Rise of minimally invasive cosmetic techniques | +1.1% | Global | Medium term (2-4 years) |
| Regulatory shift away from dental amalgam | +0.9% | Europe, North America, Japan | Long term (≥ 4 years) |
| Source: Mordor Intelligence | |||
“Zoom-Boom” Social-Media Visibility
Consumer exposure to high-resolution video meetings has heightened self-scrutiny of smiles and propelled cosmetic consultation volumes. A 2024 Journal of Dental Sciences study[1]Chen Y., “Video Calling Frequency and Elective Dental Consultations,” Journal of Dental Sciences, elsevier.com recorded a 43% surge in elective inquiries linked to “Zoom dysmorphia”. Video-centric platforms such as TikTok and Instagram continuously showcase veneer, whitening, and aligner transformations, expanding practitioner outreach and normalizing elective treatment. The downstream effect includes a notable 42% rise in teeth-whitening demand and a 36% jump in veneer consultations among high-frequency video users. Influencer-led marketing now funnels prospective patients to virtual triage, compressing the awareness-to-appointment cycle and reinforcing steady premium pricing despite macro-economic softness.
Direct-to-Consumer Clear-Aligner Platforms
DTC aligner companies offer remote impression kits and virtual monitoring priced at USD 1,200–3,500, undercutting in-office ranges of USD 3,000–8,000. This affordability unlocks first-time adult orthodontic conversions and fills appointment gaps for general practitioners who integrate hybrid review models. A 2024 Spanish cohort study[2] reported 60% unmet expectations due to insufficient supervision, placing regulatory focus on transparency and informed consent. Nonetheless, platform algorithms that track wear-time compliance have broadened the active adult orthodontic pool, contributing 1.7 percentage points to CAGR during the first forecast biennium.
Chairside CAD/CAM Adoption by Corporate Groups
DSOs scale digital dentistry by distributing capital expenses across multi-clinic networks. Same-day milling cuts laboratory turnaround by 35-40%, elevates case-acceptance rates 28%, and lowers unit lab fees up to 60%. Standardized digital protocols also harmonize restoration quality across locations, reinforcing brand reputation. Advanced ceramics produced in-office meet aesthetic demands while eliminating external shipping delays, a critical advantage for patient satisfaction. As DSOs extend into secondary cities, smaller independents struggle to match equipment spending, prompting affiliations or mergers that further consolidate market power.
Cross-Border Dental Tourism
Price differentials between industrialized and emerging economies continue to motivate outbound travel for cosmetic dentistry. Patients from the United States save 50-70% on comprehensive cases in Mexico while receiving care from clinicians trained in U.S. or EU programs. Frequent-flyer packages bundle hotel stays and bilingual care coordination, making full-arch implant therapy financially attainable. Destination clinics are reinvesting tourism revenue into intraoral scanners, 3-D printers, and milled zirconia units, creating a technology leapfrog that accelerates adoption of minimally invasive restorative methods across host countries. Over 3 million travelers pursued dental procedures in 2024, and patient flow shows a compounded annual increase of nearly 10%, reinforcing the tourism driver’s impact through 2030.
Restraints Impact Analysis*
| Restraint | (~) % Impact on CAGR Forecast | Geographic Relevance | Impact Timeline |
|---|---|---|---|
| Limited insurance reimbursement for elective aesthetics | –1.6% | Global (highest in emerging markets) | Long term (≥ 4 years) |
| High capital requirements for CAD/CAM and 3-D printers | –1.2% | Global (acute in lower-income markets) | Medium term (2-4 years) |
| Shortage of skilled digital dental technicians | –0.9% | Global; highest in rapidly growing markets | Medium term (2-4 years) |
| Counterfeit whitening and aligner kits eroding patient trust | –0.7% | Global; highest in price-sensitive markets | Short term (≤ 2 years) |
| Source: Mordor Intelligence | |||
Limited Insurance Reimbursement for Elective Aesthetics
Most dental benefit plans classify whitening, veneers, and purely cosmetic crowns as elective, leading to out-of-pocket financing that constrains volume in middle-income segments. Medicare restricts coverage[3]Centers for Medicare & Medicaid Services, “Medicare Dental Coverage Overview,” cms.gov to procedures integral to medical therapies, excluding stand-alone esthetic corrections. Consequently, clinics in cost-sensitive geographies prioritize lower-margin basic care, delaying cosmetic equipment investment. Emerging subscription-style dental plans are expanding in the United States, yet their penetration remains below 15%, sustaining the restraint’s long-term drag.
High Capital Requirements for Digital Equipment
A complete chairside workflow—scanner, milling unit, furnace, and software—often exceeds USD 150,000, a burden for single-chair practices. Small clinics in Latin America and Southeast Asia predominantly outsource cosmetic crowns, stretching turnaround to 2-3 weeks and limiting premium case volume. While vendor financing and pay-per-use models are emerging, interest costs remain prohibitive in economies with double-digit lending rates. As a result, modernization lags behind patient expectations, especially in rural settings, dampening market expansion until equipment prices normalize or cooperative ownership structures mature.
*Our forecasts treat driver/restraint impacts as directional, not additive. The impact forecasts reflect baseline growth, mix effects, and variable interactions.
Segment Analysis
By Product Type: Clear Aligners Propel Digital Orthodontics
The cosmetic dentistry market size for product offerings shows dental systems and equipment at the helm, delivering 33.62% of 2025 revenue. Clear aligners, though smaller in absolute terms, are scaling swiftly with a 8.98% CAGR as AI-driven staging algorithms boost predictability. Thermoformed shape-memory trays reduce refinements, encouraging adults to initiate treatment even in non-orthodontic clinics. Material innovations in translucency and stain resistance are extending replacement intervals, raising gross margins for manufacturers and practitioners alike.
Rapid uptake of composite resins and high-strength ceramics follows global restrictions on mercury-based amalgam. Chairside zirconia blocks achieve natural translucency that rivals feldspathic porcelain, elevating restorative aesthetics without lab dependency. The cosmetic dentistry market continues to absorb 3-D printable resins for temporary restorations, fostering on-demand workflows in DSOs and academic centers. Teeth-whitening kits maintain relevance through retail channels, although growth moderates as in-office laser whitening captures premium seekers who value immediate results.


By Procedure Type: Esthetic Enhancement Gains Momentum
Orthodontic correction maintained 32.05% of the cosmetic dentistry market share in 2025, anchored by clear aligner acceptance among image-conscious adults. Yet, esthetic enhancement, encompassing whitening, veneers, and gingival re-contouring, exhibits the quickest 8.05% CAGR as minimally invasive protocols lower psychological and financial barriers. Digital smile-design platforms blend facial scanning and mock-up overlays, enabling real-time outcome visualization that lifts treatment acceptance.
Restorative aesthetics benefit from regulatory amalgam phaseouts, lifting demand for adhesive ceramics that mimic natural translucency. Prosthodontic rehabilitation procedures now converge functional and esthetic goals; monolithic zirconia full-arch bridges achieve superior strength while delivering lifelike shade layering. Integration of intraoral scanners with occlusal analysis software reduces adjustment appointments, preserving chair time for higher-margin cosmetic cases.
By Age Group: Adult Dominance with Teen Momentum
Adults represented 82.25% of the cosmetic dentistry market size in 2025 due to discretionary income and heightened aesthetic awareness. Elective veneer packages, implant-supported crowns, and comprehensive smile revisits remain adult staples. Incremental uptake of preventive aligner therapy indicates shifting attitudes toward early correction, extending lifetime value per patient.
Teenagers form the fastest-growing cohort at 8.31% CAGR, aided by clear aligners’ low-profile design and school-friendly wear schedules. Gamified mobile apps encourage compliance, while parental willingness to finance early interventions reflects the perceived psychosocial benefit. Pediatric clinics integrate educational AR modules to demystify cosmetic procedures, cultivating future adult clientele who are already comfortable with digital workflows.
By Distribution Channel: Offline Stronghold Faces Digital Upswing
Brick-and-mortar practices, hospitals, and laboratories controlled 85.32% of the cosmetic dentistry market share in 2025, underpinned by regulatory requirements for chairside supervision. Nonetheless, online platforms are accelerating at a 8.72% CAGR, especially in tray-based whitening and impression-kit sales. Tele-orthodontics bridges geographic gaps, funneling rural patients to centralized fabrication hubs that mail aligners on subscription.
Hybrid paradigms are emerging: patients complete initial assessments virtually, then attend condensed in-office fittings, compressing overall visits. Cloud-based case portals supply progress analytics to clinicians, balancing convenience with oversight. Traditional distributors respond by integrating e-commerce storefronts that bundle supplies with continuing-education content, defending relevance amid platform encroachment.
By End-User: Clinics Command, DSOs Surge
Dental clinics secured 63.78% revenue in 2025, reflecting their ubiquity and holistic service offerings. High patient loyalty and neighborhood proximity remain differentiators even as technology costs climb. To stay competitive, independents adopt fractional equipment models, sharing CAD/CAM mills through cooperative networks.
DSOs expand fastest at 7.52% CAGR by exploiting scale economies and centralized procurement. Multistate brands negotiate bulk material pricing, passing savings to patients while sheltering profitability. Integrated analytics monitor chair utilization and case acceptance, informing targeted marketing that further amplifies volume. Dental hospitals sustain relevance by aggregating prosthodontic specialists for complex cosmetic reconstructions, attracting referrals from general practices that lack onsite milling capacity.
Geography Analysis
North America generated 39.35% of global revenue in 2025, supported by robust private insurance penetration and cultural acceptance of elective enhancements. The United States adopts CAD/CAM modules swiftly, with DSOs rolling out identical digital workflows across networks of more than 800 offices. Canada emphasizes evidence-based minimal-preparation approaches, reflective of its regulated fee guides, while Mexico capitalizes on medical tourism through bundled implant-rehabilitation vacations that cost 60% less than U.S. equivalents.
Asia Pacific stands as the growth engine at an 7.71% CAGR. China witnesses a boom in urban middle-class spending on injection-molded resin veneers, while India positions itself as a cost-effective full-arch implant center supported by expatriate dentists returning from Gulf states. Japan and South Korea lead in digital dental education, embedding CAD courses into core curricula. Southeast Asian markets such as Vietnam gain share through franchise aligner shops linked to smartphone tracking apps. Europe ranks second, propelled by Germany, the United Kingdom, and France, each fostering dense intraoral-scanner adoption rates. EU enforcement of the Minamata Convention accelerates ceramic uptake, while national health services offer partial subsidies for functional crowns that incidentally improve aesthetics. The Middle East & Africa demonstrate steady adoption in affluent Gulf Cooperation Council (GCC) states, where clinics source premium European lab work for high-net-worth patients. South America’s momentum centers on Brazil, whose established cosmetic surgery culture extends to smile makeovers, with influencers popularizing combined orthognathic and veneer packages on social channels. Infrastructure gaps in rural Latin American and African markets temper volume growth but present untapped opportunity for mobile CAD/CAM units and portable scanner deployments.

Competitive Landscape
The cosmetic dentistry market hosts a blend of multinational conglomerates and agile disruptors. Dentsply Sirona, Align Technology, Institut Straumann AG, and 3M command broad portfolios that span scanners, materials, and manufacturing units, enabling end-to-end workflow control. Align Technology generated USD 797 million in clear-aligner revenue during Q1 2025[4]Align Technology Investor Relations, “Q1 2025 Financial Highlights,” aligntech.com , underscoring its brand resonance in adult orthodontics. Straumann broadened its digital platform with in-house milling centers, ensuring seamless integration for partner labs.
Vertical integration is the prevailing strategy: equipment vendors acquire cloud-based design suites to lock clinicians into proprietary ecosystems, raising switching costs and ensuring recurring revenue from consumables. Material science advances—such as bioactive ceramics with shade layering—provide further differentiation difficult for unintegrated rivals to match.
Direct-to-consumer challengers like SmileDirectClub cultivate brand loyalty via subscription whitening clubs and app-based progress tracking, compelling incumbents to launch semi-remote aligner options through general practices. Start-ups leveraging AI occlusal mapping or generative tooth morphology attract venture capital aimed at accelerating chairside automation. Consolidation intensifies as DSOs seek exclusive supply contracts, prompting mid-tier suppliers to forge niche positions in pediatric-focused cosmetics or low-budget whitening foams for emerging markets.
Cosmetic Dentistry Industry Leaders
BIOLASE, Inc
Dentsply Sirona
Institut Straumann AG
Solventum Corporation
ZimVie Inc
- *Disclaimer: Major Players sorted in no particular order

Recent Industry Developments
- May 2025: Align Technology reported Q1 2025 net revenues of USD 979 million, with clear aligner revenue of USD 797 million.
- April 2025: The American Academy of Cosmetic Dentistry introduced an education series titled “Facially Driven Smile Design: Minimally Invasive Strategies for Functional and Esthetic Excellence.”
- July 2024: The U.S. FDA cleared ZimVie’s GenTek restorative implants, expanding its cosmetic implant suite.
- June 2024: ZimVie Inc. confirmed it is exploring strategic options, including a potential sale, following acquisition interest from private-equity firms and industry peers.


Research Methodology Framework and Report Scope
Market Definitions and Key Coverage
Our study defines the cosmetic dentistry market as all elective professional procedures and supporting materials that enhance dental esthetics, including in-office teeth whitening, ceramic and composite veneers, chairside CAD/CAM crowns and bridges, implant-borne restorations, clear aligners, orthodontic brackets, bonding agents, inlays and onlays, as well as the dedicated imaging, milling and laser equipment that enable these services.
Scope exclusion: At-home over-the-counter whitening trays, mouthwashes and other retail oral-care products are not counted.
Segmentation Overview
- By Product Type
- Dental Systems & Equipment
- Dental Implants
- Dental Crowns & Bridges
- Orthodontic Braces
- Clear Aligners
- Teeth-Whitening Products
- Dental Veneers
- Cosmetic Ancillary Accessories
- By Procedure Type
- Restorative Aesthetics
- Orthodontic Correction
- Prosthodontic Rehabilitation
- Esthetic Enhancement
- By Age Group
- Adults
- Teenagers
- Children
- By Distribution Channel
- Offline
- Online
- By End-User
- Dental Clinics
- Dental Hospitals
- DSO / Group Practices
- Other End-Users
- By Geography (Value)
- North America
- United States
- Canada
- Mexico
- Europe
- Germany
- United Kingdom
- France
- Italy
- Spain
- Rest of Europe
- Asia-Pacific
- China
- India
- Japan
- Australia
- South Korea
- Rest of Asia-Pacific
- Middle East & Africa
- GCC
- South Africa
- Rest of Middle East & Africa
- South America
- Brazil
- Argentina
- Rest of South America
- North America
Detailed Research Methodology and Data Validation
Primary Research
Mordor analysts interviewed practicing prosthodontists, orthodontists, dental device distributors and lab owners across North America, Europe, Asia-Pacific and Latin America. These conversations clarified paid-case volumes, chair utilization, average selling prices and the practical impact of insurance exclusions, letting us validate secondary signals and fine-tune model assumptions.
Desk Research
We screened publicly available Tier-1 sources such as the American Dental Association fee survey, WHO oral-health databases, UN Comtrade shipment codes for HS 9021 and 9018, trade association briefs from the International Dental Manufacturers Association, and peer-reviewed journals discussing implant loading rates. Company 10-Ks, investor decks and reputable press releases supplied recent pricing moves and unit placements. Subscription tools (D&B Hoovers for manufacturer financials and Dow Jones Factiva for deal alerts) filled remaining gaps. This list is illustrative; many additional references were consulted.
Market-Sizing & Forecasting
A top-down and bottom-up blend underpins our model. We start with country-level procedure pools reconstructed from dentist density, adult disposable income, elective spending elasticity, implant penetration, and share of chairside CAD/CAM systems, which are then priced using surveyed ASPs. Supplier roll-ups for implants, aligners and whitening kits act as a cross-check before values are finalized. Multivariate regression on macro drivers (GDP per capita, private dental insurance enrollment, social-media search interest) projects demand through 2030, while scenario analysis captures technology adoption variance. Gaps in bottom-up counts, especially for lab-fabricated veneers, are bridged by import data proxies and expert consensus.
Data Validation & Update Cycle
Outputs pass three-layer checks: automated anomaly flags, peer review by a senior analyst, and a final sign-off meeting. Reports refresh annually, and interim updates trigger when regulatory reimbursement rules, major product launches or greater than 5 percent currency swings occur.
Why Mordor's Cosmetic Dentistry Baseline Commands Reliability
Published estimates often differ because firms pick unique product baskets, price-point assumptions or refresh cadences. We acknowledge those realities upfront and show how our disciplined variable selection and yearly recalibration create a dependable yardstick for planners.
Key gap drivers include whether whitening kits sold in drugstores are counted, the vintage of the base year, and the extent to which analyst teams validate ASP progression with live practitioner quotes.
Benchmark comparison
| Market Size | Anonymized source | Primary gap driver |
|---|---|---|
| USD 33.39 B (2025) | Mordor Intelligence | - |
| USD 30.10 B (2025) | Global Consultancy A | Excludes chairside equipment, relies on 2020 baseline and singular top-down ratios |
| USD 28.48 B (2025) | Industry Analyst B | Treats OTC whitening as in-scope, applies static ASPs without primary validation |
In summary, while numbers cluster within a narrow band, Mordor's stepwise validation, inclusive yet clinically grounded scope, and live price benchmarking deliver the balanced baseline most users can trace, replicate and confidently defend in internal discussions.


Key Questions Answered in the Report
Which technology is transforming orthodontic care within cosmetic dentistry?
Artificial-intelligence-guided clear aligner systems now allow virtual treatment planning, fewer in-office visits, and more predictable tooth movement, making discreet orthodontic correction accessible to a wider adult and teen population.
Why is Asia Pacific viewed as a strategic region for cosmetic dentistry expansion?
Rapid income growth, thriving dental-tourism corridors, and strong investment in digital scanners and chairside milling are combining to lift procedure volumes across major urban centers in China, India, and Southeast Asia.
How are dental service organizations (DSOs) gaining competitive ground over solo practices?
DSOs spread the cost of chairside CAD/CAM equipment across multiple clinics, standardize clinical protocols, and use data analytics to lift case-acceptance rates, enabling faster rollout of premium cosmetic procedures.
Which demographic is seeing the sharpest uptick in demand for aesthetic dental work?
Teenagers are increasingly opting for minimally visible clear aligners and preventive aesthetic treatments, driven by social-media influences and parental willingness to invest in early smile enhancement.
What regulatory trend is reshaping material choices in restorative cosmetics?
Global initiatives that phase down mercury amalgam use are accelerating the shift toward tooth-colored ceramics and composites, prompting practices to adopt new bonding systems and digital fabrication workflows.
What operational hurdles could slow technology adoption in emerging clinics?
High upfront costs for scanners, mills, and 3-D printers, coupled with a shortage of digitally trained dental technicians, can delay workflow upgrades unless addressed through vendor financing and targeted education programs.
Page last updated on:


