P2P Car Sharing Market Size and Share
Market Overview
| Study Period | 2020 - 2031 |
|---|---|
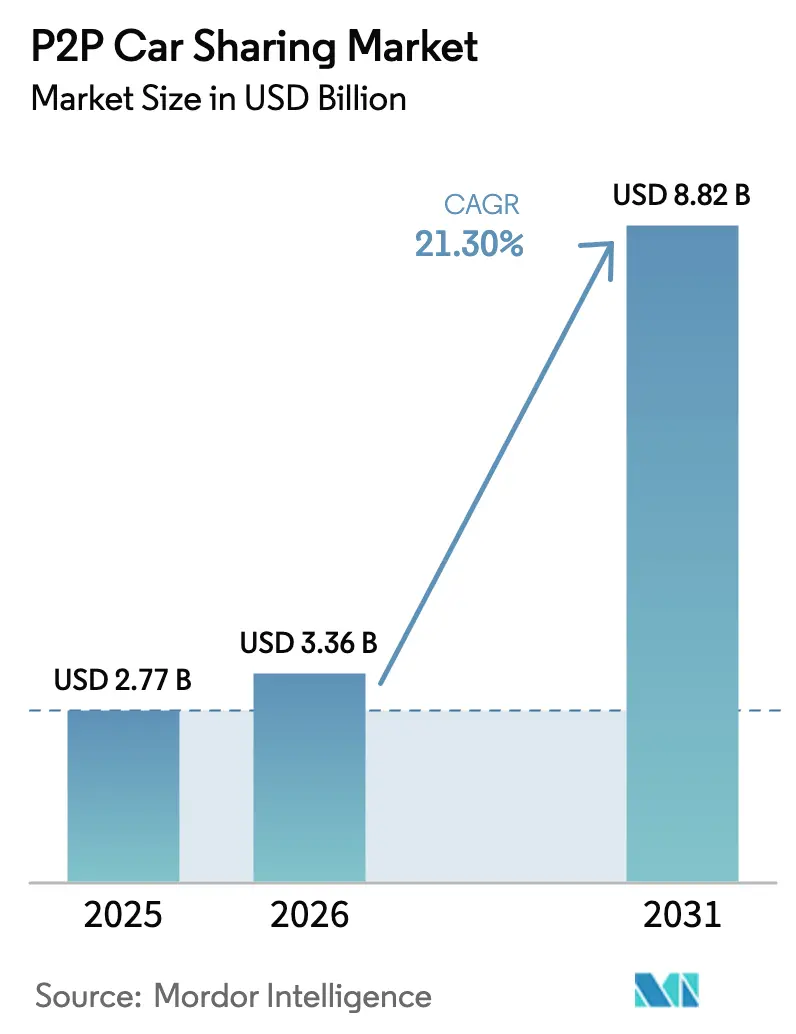
| Market Size (2026) | USD 3.36 Billion |
| Market Size (2031) | USD 8.82 Billion |
| Growth Rate (2026 - 2031) | 21.30% CAGR |
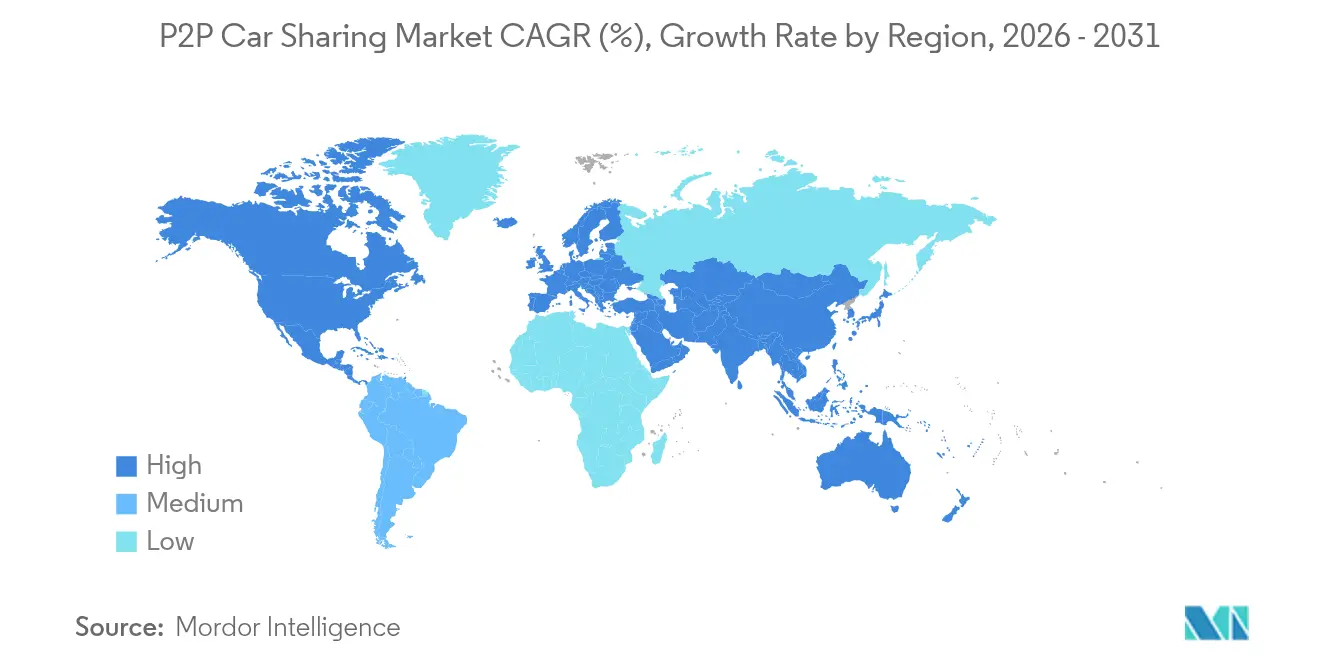
| Fastest Growing Market | Asia Pacific |
| Largest Market | Europe |
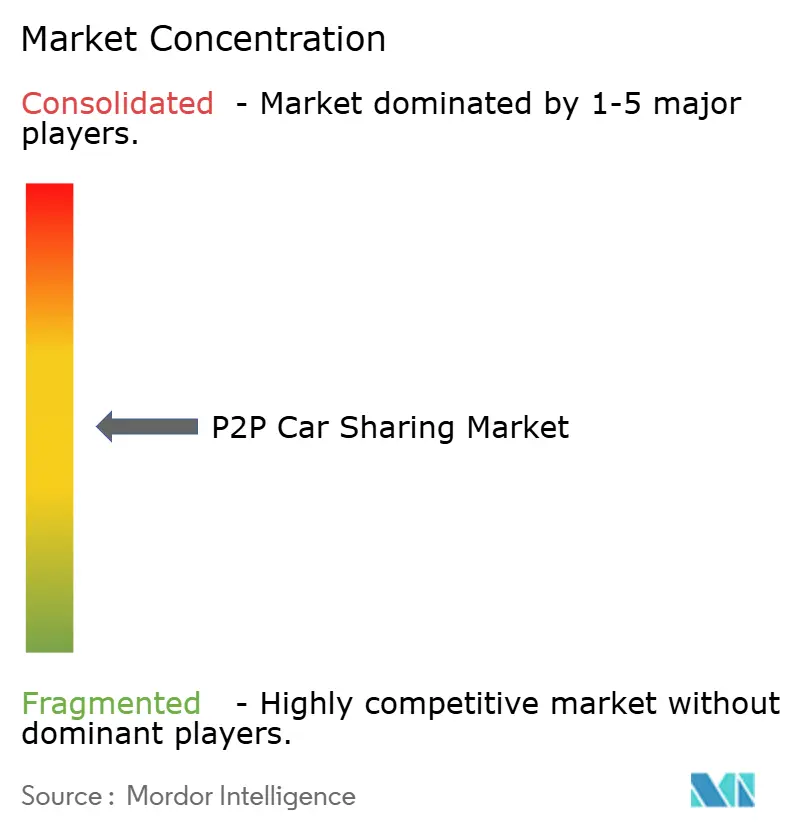
| Market Concentration | Medium |
Major Players *Disclaimer: Major Players sorted in no particular order Image © Mordor Intelligence. Reuse requires attribution under CC BY 4.0. | |
P2P Car Sharing Market Analysis by Mordor Intelligence
The P2P car sharing market size is expected to grow from USD 2.77 billion in 2025 to USD 3.36 billion in 2026 and is forecast to reach USD 8.82 billion by 2031 at 21.3% CAGR over 2026-2031. Demand is driven by digitally native city dwellers who prefer access over ownership, abundant venture capital that fuels platform expansion, and municipal regulations that favor low-emission, high-utilization fleets. Smartphone-based telematics has reduced booking and hand-off frictions, allowing platforms to scale internationally without large fixed-asset bases. Meanwhile, growing traffic congestion and rising parking fees intensify the appeal of flexible, pay-per-use mobility. Competitive strategies center on differentiated insurance, data-driven pricing, and partnerships with automakers that provide guaranteed vehicle supply. Looking ahead, autonomous driving pilots and vehicle-to-grid integrations are expected to deepen platform capabilities and open adjacent revenue streams.
Key Report Takeaways
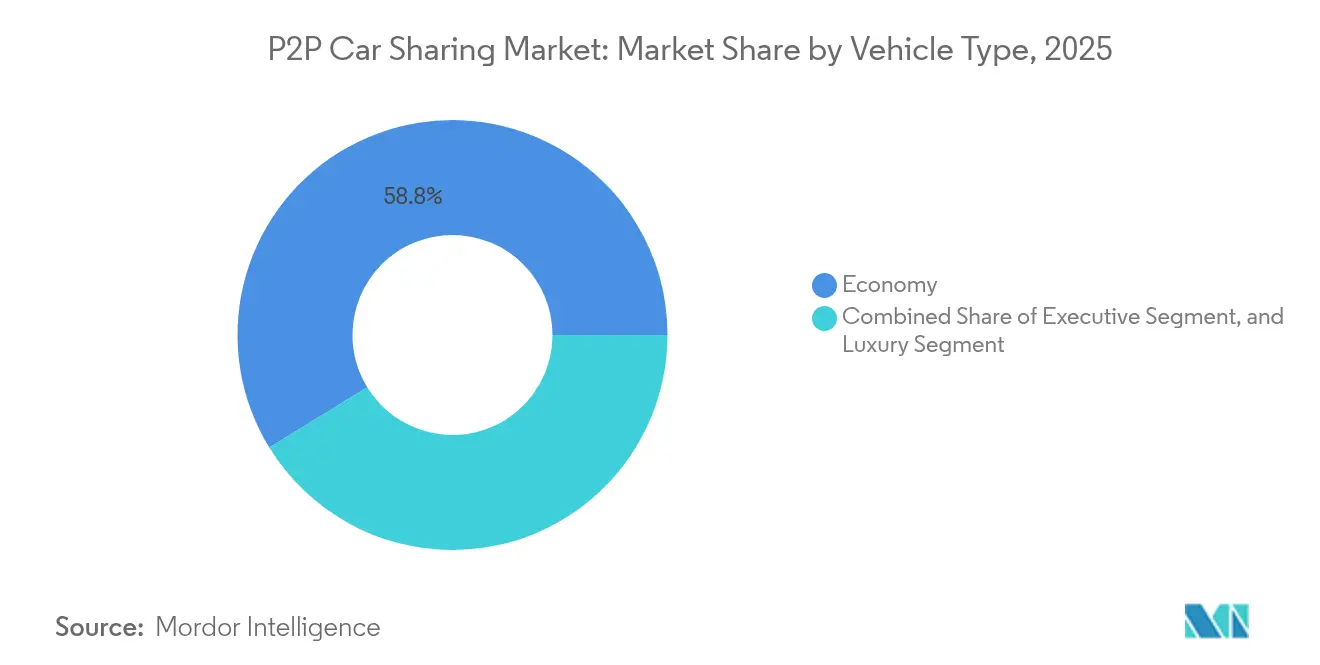
- By vehicle type, economy models captured 58.77% of P2P car sharing market share in 2025, while the luxury segment is projected to advance at a 22.65% CAGR through 2031.
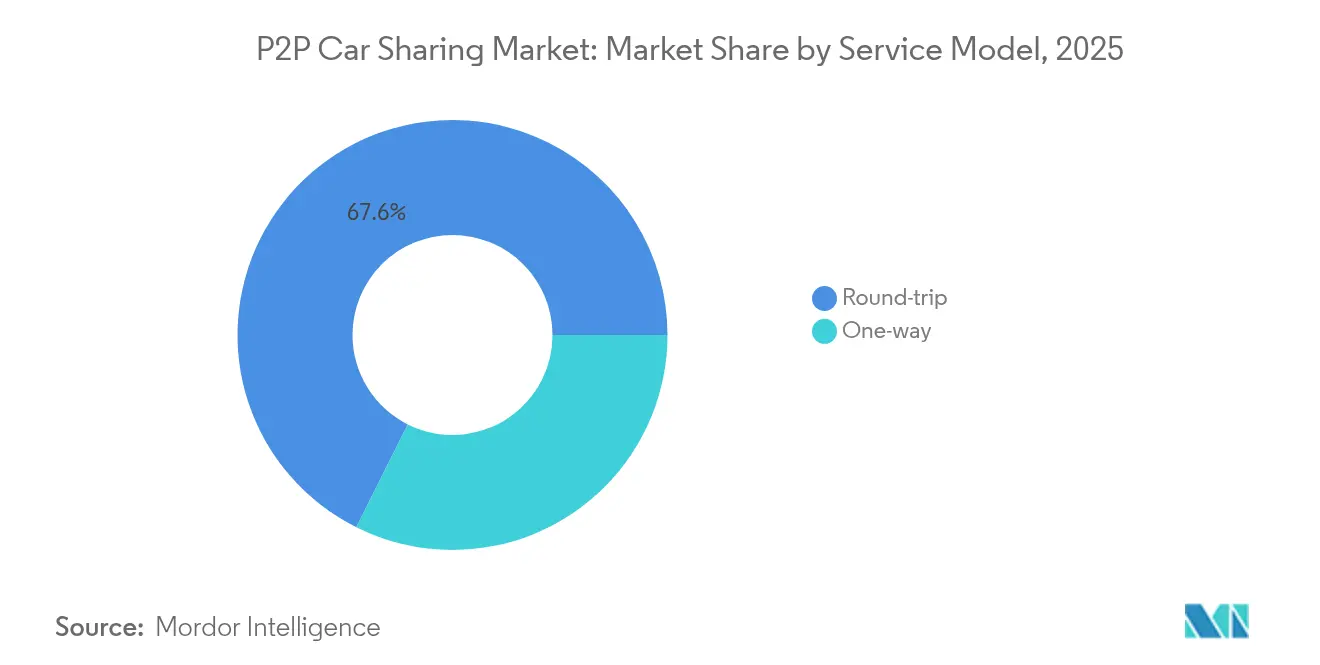
- By service model, the round-trip category held 67.62% of the P2P car sharing market share in 2025; one-way services post the highest forecast CAGR at 23.40% to 2031.
- By business model, station-based operations accounted for 66.85% of the P2P car sharing market size in 2025; free-floating fleets are expected to expand at a 25.10% CAGR during 2026-2031.
- By region, Europe retained 36.10% of 2025 revenue, whereas Asia-Pacific is set to record the fastest 26.20% CAGR through 2031.
Note: Market size and forecast figures in this report are generated using Mordor Intelligence’s proprietary estimation framework, updated with the latest available data and insights as of 2026.
Global P2P Car Sharing Market Trends and Insights
Drivers Impact Analysis*
| Driver | (~) % Impact on CAGR Forecast | Geographic Relevance | Impact Timeline |
|---|---|---|---|
| Changing customer preference for access over ownership | 6.2% | Global, with strongest impact in North America and Europe | Medium term (2-4 years) |
| Rising cost of vehicle ownership | 4.8% | Global, particularly acute in urban centers | Short term (≤ 2 years) |
| Expansion of urban low-emission zones | 3.9% | Europe and Asia-Pacific core, spill-over to North America | Long term (≥ 4 years) |
| Smartphone-enabled telematics for secure rentals | 3.1% | Global, with faster adoption in developed markets | Short term (≤ 2 years) |
| Automaker-backed P2P programs | 2.4% | North America and Europe, expanding to Asia-Pacific | Medium term (2-4 years) |
| Usage-based insurance innovations | 1.9% | North America and Europe, pilot programs in Asia-Pacific | Long term (≥ 4 years) |
| Changing customer preference for access over ownership | 6.2% | Global, with strongest impact in North America and Europe | Medium term (2-4 years) |
| Source: Mordor Intelligence | |||
Changing Customer Preference for Access Over Ownership
Millennial and Gen Z cohorts increasingly favor flexible use models, a trend amplified in cities where monthly parking can exceed USD 300. Willingness to substitute ownership is evident in surveys showing one-third of Europeans ready to abandon personal vehicles if alternatives are abundant. Platforms respond by offering specialty fleets—such as off-road SUVs or camper vans—that meet lifestyle needs and strengthen ecosystem stickiness. This behavioral pivot expands the P2P car sharing market by converting occasional curiosity into habitual usage. As digital identities and mobile payments mature, customer onboarding has fallen to minutes, reinforcing frictionless access as a competitive norm. The cumulative effect is a structural uplift in utilization rates that underpins the sector’s high CAGR.
Rising Cost of Vehicle Ownership
Total cost of ownership in several tier-one cities now tops USD 9,000 annually, propelled by insurance premiums and congestion charges.[1]Smartcar, “2025 Mobility Data Report,” smartcar.comUsage-based insurance delivers 20-30% premium relief for low-mileage drivers, a financial lever that platforms employ to highlight savings versus ownership. Elevated fuel and maintenance prices further tilt cost-benefit math toward shared mobility, especially for households pursuing budget optimization. For operators, these macro-pressures compress traditional rental margins yet enlarge the user pool receptive to P2P offers. Capital-intensive electrification remains a near-term challenge, but lower energy and servicing costs improve lifetime economics, enabling competitive daily rates even on premium EVs. Overall, ownership inflation functions as a demand catalyst that broadens the addressable P2P car sharing market.
Expansion of Urban Low-Emission Zones
More than 300 low-emission zones (LEZ) are active across Europe and Asia, driving up compliance costs for private motorists while sparing occasional users who rely on shared fleets.[2]Institute for European Environmental Policy, “Low-Emission Zone Impact Assessment,” ieep.euAir-quality gains, including 31% NOx reduction in Brussels, reinforce political momentum for wider rollouts. Operators amortize LEZ compliance—through fleet electrification or retrofit kits—over thousands of users, translating regulation into competitive advantage. Madrid’s Central LEZ cut downtown traffic by 8.1%, yet added volume in outer rings highlights the need for integrated mobility services that P2P platforms can provide. With dozens of zero-emission zones slated for 2030, fleet electrification becomes both a mandate and an opportunity to upsell premium, low-carbon access within the P2P car sharing market.
Smartphone-Enabled Telematics for Secure Rentals
Remote locking, real-time diagnostics, and AI-based damage detection have trimmed manual hand-off time to near zero, giving mobile-first operators a decisive efficiency edge. Persistent connectivity lets platforms dynamically score driver behavior and price risk, creating insurance partnerships that unlock ancillary revenue. Data richness also underpins predictive maintenance, boosting vehicle uptime and customer satisfaction. On the user side, instant booking and keyless entry elevate convenience to parity with ride-hailing. As 5G coverage spreads, bandwidth-heavy features—such as video-verified walk-arounds—become mainstream, further professionalizing the P2P car sharing industry. Collectively, telematics lowers operational cost per trip while elevating trust, accelerating global market penetration.
Restraints Impact Analysis*
| Restraint | (~) % Impact on CAGR Forecast | Geographic Relevance | Impact Timeline |
|---|---|---|---|
| Limited adoption in developing regions | -3.7% | Asia-Pacific emerging markets, Latin America, Africa | Medium term (2-4 years) |
| Regulatory uncertainty on private rentals | -2.9% | Global, with highest impact in emerging markets | Short term (≤ 2 years) |
| Trust and safety concerns | -2.1% | Global, particularly acute in developing regions | Long term (≥ 4 years) |
| EV-charging infrastructure variability | -1.8% | Global, with highest impact in rural and suburban areas | Long term (≥ 4 years) |
| Source: Mordor Intelligence | |||
Limited Adoption in Developing Regions
Smartphone penetration gaps and patchy digital payments restrict user acquisition, keeping platform density below viability thresholds in parts of Southeast Asia and Africa.[3]Public Transport Council, “Point-to-Point Transport Regulations 2020,” ptc.gov.sg Income disparities further constrain demand, as daily rental rates can eclipse local wage levels. Insurance ecosystems are often immature, complicating liability coverage and dampening investor appetite. Nonetheless, localized players such as Brazil’s Gringo leverage embedded finance to sidestep credit-card limitations, signaling that region-specific solutions can unlock latent demand. Policymakers in India and Indonesia are drafting EV-focused mobility guidelines, yet execution lags in infrastructure rollout. Taken together, emerging-market frictions slow, but do not negate, the long-term contribution of these regions to the P2P car sharing market.
Regulatory Uncertainty on Private Rentals
Patchwork legislation around insurance minimums, tax treatment, and data privacy adds compliance overhead that dissuades smaller entrants. New Jersey and Pennsylvania offer model statutes that mandate coverage and fee disclosures, but other U.S. states and many global jurisdictions remain ambiguous. Singapore’s 2020 point-to-point transport framework showcases how clear rules can foster growth, yet frequent revisions elsewhere force operators to re-engineer policies, inflating legal costs. Autonomous-vehicle regulations ride in parallel, layering additional certification hurdles that can stall fleet upgrades. For investors, inconsistent policy raises discount rates applied to cash-flow forecasts, tempering capital inflows despite robust demand projections for the P2P car sharing market.
*Our forecasts treat driver/restraint impacts as directional, not additive. The impact forecasts reflect baseline growth, mix effects, and variable interactions.
Segment Analysis
By Vehicle Type: Economy Dominance Drives Volume Growth
P2P car sharing market size for economy vehicles reached USD 1.63 billion in 2025 and continues to anchor platform utilization because compact models minimize fueling and parking expenses. High turnover aligns with the access-over-ownership ethos, encouraging operators to prioritize fleets that offer repeatable, low-cost trips for commuters and students. In parallel, fleet electrification initiatives concentrate first on sub-compact EVs whose battery packs satisfy urban range requirements while qualifying for LEZ incentives. Robust supply partnerships with Hyundai and Toyota safeguard vehicle availability despite lingering semiconductor shortages, enabling platforms to sustain growth momentum.
Demand polarization simultaneously fuels the luxury sub-segment, which registers the fastest 22.65% CAGR to 2031. Average rental yields above USD 200 per day broaden revenue diversity and attract affluent users seeking episodic indulgence rather than permanent depreciation exposure. Platforms differentiate by adding concierge services, mileage-limited performance models, and flexible insurance tiers that cap damage liability. The resulting bifurcated landscape lets operators cross-sell economy and premium tiers, extending customer lifetime value. Executive car adoption remains steady, filling mid-price gaps for business travelers who favor comfort without super-car premiums.


By Service Model: Round-Trip Stability Versus One-Way Innovation
The round-trip format contributed USD 1.87 billion to the 2025 P2P car sharing market size, reflecting 67.62% share built on operational predictability. Vehicles return to fixed locations, simplifying maintenance cycles and reducing repositioning expense. Corporate and university campuses sustain reliable booking patterns that underpin station utilization, helping operators negotiate long-term parking leases at preferential rates. Average trip durations hover around 26 hours, supporting overnight pricing that competes favorably with legacy rental agencies.
One-way trips scale rapidly from a smaller 2025 base as machine-learning engines analyze booking asymmetries and adjust pricing in real time. Integration with multimodal mobility apps encourages commuters to chain train, scooter, and one-way car legs into seamless journeys, enabling platforms to penetrate peak-hour demand that conventional round-trip fleets cannot serve. As autonomous pilots advance, repositioning cost is expected to plummet, erasing a key disadvantage and potentially shifting future P2P car sharing market share toward the one-way model.
By Business Model: Station-Based Reliability Meets Free-Floating Flexibility
Station-based operations generated USD 1.85 billion in 2025, equal to 66.85% of current P2P car sharing market share, because guaranteed pickup points build user trust and facilitate predictable scheduling for cleaning and charging. Multi-year parking concessions near transit hubs deliver strategic visibility into cost structures, a factor valued by fleet financiers. Operators experiment with solar-powered micro-depots that cut utility expenses and bolster ESG credentials, enhancing platform appeal to municipalities.
Free-floating fleets grow at a 25.10% CAGR from 2026-2031 as mobile connectivity and high-accuracy GPS reduce the risk of vehicle loss. The model excels in dense downtown grids where last-minute, short-hop demand is strong. Hybrid strategies are emerging: platforms anchor core zones with micro-depots but allow flexible drop-offs in satellite areas, achieving a balance between reliability and spontaneity. AI-enabled photo inspections at trip end streamline damage claims, mitigating one historic hurdle for free-floating expansion within the P2P car sharing industry.

Geography Analysis
Europe holds 36.10% of 2025 revenue, sustained by early adoption, stringent LEZ legislation, and an intricate public-transport mesh that complements car sharing. Cities such as Paris, Milan, and Berlin integrate P2P vehicles into MaaS (Mobility-as-a-Service) platforms that bundle transit passes, e-bikes, and car rentals into a single subscription. The EU Data Act, finalized in 2024, obliges automakers to share in-vehicle data with third parties, lowering integration friction for new entrants. Yet growth moderates as core urban cohorts edge toward saturation, prompting operators to court suburban and leisure users through differential pricing and off-peak promotions.
Asia-Pacific is the fastest-growing region, expanding at 26.20% CAGR, driven by megacity congestion and digital-wallet ubiquity. Super-apps such as Grab embed P2P car sharing within loyalty loops that encompass food delivery and buy-now-pay-later financing, boosting cross-service engagement. Government support is overt: South Korea grants tax credits on shared-mobility EV purchases, and China’s Internet Plus policy targets a quadrupling of fleet utilization. However, infrastructure disparities persist between coastal megacities and interior provinces, requiring flexible business models that account for charging and parking variability.
North America shows mixed signals. While the United States pioneered P2P car sharing, recent consolidation indicates intensifying competition and regulatory fragmentation. Turo remains the dominant brand yet postponed its IPO in 2025, highlighting investor caution. Getaround’s exit from U.S. operations underscores cost challenges in insurance, marketing, and customer support. Canada, by contrast, benefits from unified federal guidelines that permit cross-provincial fleet mobility, illustrating how homogeneous regulation can sustain market resilience. Latin American and African cities sit at earlier adoption phases, but rising smartphone penetration and supportive fintech ecosystems foreshadow future contributions to the global P2P car sharing market.

Competitive Landscape
Platform leadership coalesces around firms that marry capital efficiency with technology depth. Turo, Grab, and SOCAR command regional strongholds through continual investment in telemetry, fraud detection, and data-driven pricing. Traditional rental giants—Enterprise Holdings and Avis Budget Group—extend into P2P using existing depot networks and large corporate fleets to blunt competitive encroachment. Automakers seek strategic control: Volkswagen’s alliance with Uber to deploy autonomous ID. Buzz shuttles integrates OEM hardware, ride-hailing data, and P2P infrastructure to accelerate time-to-scale.
Technology is the primary differentiator. AI models set trip prices, anticipate demand spikes, and recommend fleet redistribution down to street level. Some operators pilot blockchain-anchored identity verification to shrink onboarding to seconds while curbing fraud. EV-only sharing specialists such as ZEVO leverage battery-state analytics to minimize downtime and integrate vehicle-to-grid revenue streams during idle periods. Market entry barriers rise as insurance partners favor data-rich incumbents, effectively locking out smaller challengers lacking actuarial credibility.
Nonetheless, niche opportunities remain. Rural markets where transit gaps persist invite community cooperatives backed by local credit unions. Commercial-vehicle sharing to address last-mile delivery surges offers diversification potential. Platform convergence is also intensifying: Miles’ integration into Bolt’s app illustrates how category blurring creates one-stop mobility dashboards that deepen customer engagement. Overall, strategic alliances, fleet electrification, and data monetization will determine future share distribution within the P2P car sharing market.
P2P Car Sharing Industry Leaders
Zipcar Inc.
Getaround Inc.
Turo Inc.
Share Now GmbH
BlaBlaCar (Comuto SA)
- *Disclaimer: Major Players sorted in no particular order

Recent Industry Developments
- June 2025: Tesla launched its robotaxi service in Austin, Texas, at USD 4.20 per ride, signaling a paradigm shift toward autonomous shared mobility.
- June 2025: ZEVO unveiled a peer-to-peer EV sharing platform for Tesla owners, underscoring technology-specific segmentation.
- April 2025: Lyft acquired Freenow for EUR 175 million, expanding multi-mobility coverage to nine European countries.
- April 2025: Volkswagen and Uber agreed to deploy autonomous ID. Buzz vans in Los Angeles trials commencing late 2025.


Global P2P Car Sharing Market Report Scope
The peer-to-peer (P2P) car-sharing market is a decentralized model where private car owners rent their vehicles to others through online platforms or mobile applications. This market uses technology to connect car owners with potential renters, providing a cost-effective and flexible alternative to traditional car rental services. P2P car sharing allows car owners to earn money from their underused vehicles while offering renters convenient and affordable transportation options.
The peer to peer car sharing markets is segmented by vehicle type (economy, executive, luxury), by service model (one-way, round trip), by business model (free floating, station based), by geography (North America [United States, Canada, Mexico, and Rest of North America], Europe [Germany, United Kingdom, France, Spain, and Rest of Europe], Asia-Pacific [India, China, Japan, New Zealand, Australia and Rest of Asia-Pacific], Latin America [Brazil, Argentina, and Rest of Latin America], Middle East and Africa [United Arab Emirates, Saudi Arabia, and Rest of Middle East and Africa]).
The report offers market forecasts and size in value (USD) for all the above segments.
| Economy |
| Executive |
| Luxury |
| One-way |
| Round-trip |
| Free Floating |
| Station Based |
| North America | United States | |
| Canada | ||
| Mexico | ||
| South America | Brazil | |
| Argentina | ||
| Rest of South America | ||
| Europe | United Kingdom | |
| Germany | ||
| France | ||
| Italy | ||
| Spain | ||
| Russia | ||
| Rest of Europe | ||
| Asia-Pacific | China | |
| Japan | ||
| India | ||
| South Korea | ||
| Australia and New Zealand | ||
| ASEAN-5 | ||
| Rest of Asia-Pacific | ||
| Middle East and Africa | Middle East | Saudi Arabia |
| UAE | ||
| Turkey | ||
| Rest of Middle East | ||
| Africa | South Africa | |
| Nigeria | ||
| Egypt | ||
| Rest of Africa | ||
| By Vehicle Type | Economy | ||
| Executive | |||
| Luxury | |||
| By Service Model | One-way | ||
| Round-trip | |||
| By Business Model | Free Floating | ||
| Station Based | |||
| By Geography | North America | United States | |
| Canada | |||
| Mexico | |||
| South America | Brazil | ||
| Argentina | |||
| Rest of South America | |||
| Europe | United Kingdom | ||
| Germany | |||
| France | |||
| Italy | |||
| Spain | |||
| Russia | |||
| Rest of Europe | |||
| Asia-Pacific | China | ||
| Japan | |||
| India | |||
| South Korea | |||
| Australia and New Zealand | |||
| ASEAN-5 | |||
| Rest of Asia-Pacific | |||
| Middle East and Africa | Middle East | Saudi Arabia | |
| UAE | |||
| Turkey | |||
| Rest of Middle East | |||
| Africa | South Africa | ||
| Nigeria | |||
| Egypt | |||
| Rest of Africa | |||


Key Questions Answered in the Report
How large is the P2P car sharing market today?
The P2P car sharing market size is USD 3.36 billion in 2026 and is projected to climb to USD 8.82 billion by 2031.
What is driving the rapid growth of P2P car sharing?
Key drivers include the preference for access over ownership, rising vehicle ownership costs, expansion of low-emission zones, and smartphone-enabled telematics that streamline rentals.
Which service model is expanding the fastest?
One-way rentals show the highest forecast growth, advancing at a 23.40% CAGR thanks to urban density and multimodal integrations.
Why is Asia-Pacific the fastest-growing region?
Rapid urbanization, supportive government policies, and integrated super-app ecosystems propel Asia-Pacific’s 26.20% CAGR through 2031.
How are regulations impacting the market?
Clear statutes in regions such as New Jersey and Singapore foster growth, while inconsistent rules elsewhere create compliance uncertainty and slow expansion.
Page last updated on:


