
China Data Center Server Market Size and Share
Market Overview
| Study Period | 2020 - 2031 |
|---|---|
| Forecast Data Period | 2026 - 2031 |
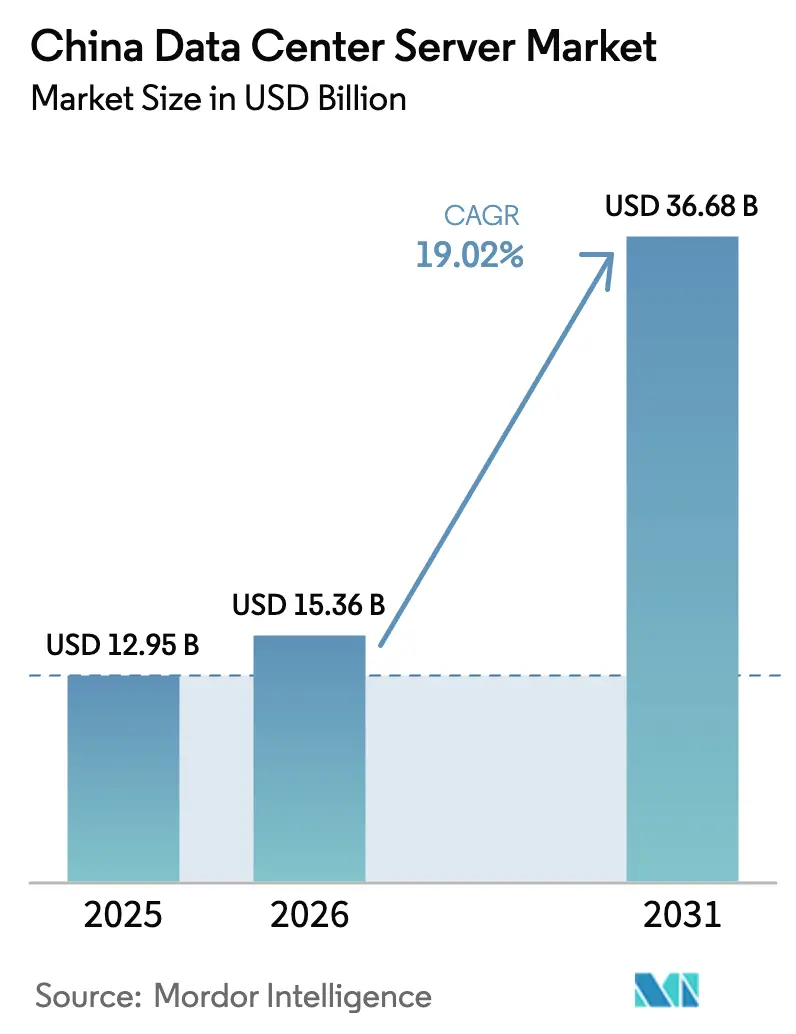
| Base Year Market Size (2025) | USD 12.95 Billion |
| Market Size (2026) | USD 15.36 Billion |
| Market Size (2031) | USD 36.68 Billion |
| Growth Rate (2026 - 2031) | 19.02 % |
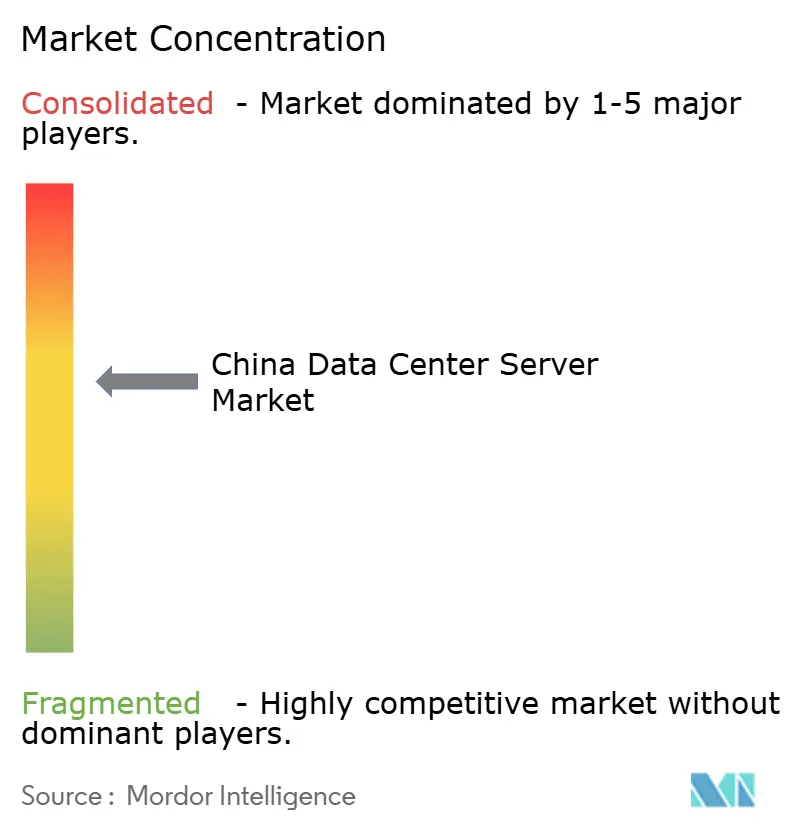
| Market Concentration | Medium |
Major Players *Disclaimer: Major Players sorted in no particular order Image © Mordor Intelligence. Reuse requires attribution under CC BY 4.0. | |
China Data Center Server Market Analysis by Mordor Intelligence
The China data center server market size was valued at USD 12.95 billion in 2025 and is estimated to grow from USD 15.36 billion in 2026 to reach USD 36.68 billion by 2031, at a CAGR of 19.02% during the forecast period (2026-2031). Beijing’s push for sovereign computing, the mounting demand for generative AI, and the fast-spreading adoption of edge analytics are reshaping procurement criteria away from legacy x86 refreshes toward GPU-dense, liquid-cooled systems. Hyperscalers are accelerating direct campus builds to gain control of thermal design, while colocation operators invest in Tier 3 expansions to capture enterprise workloads migrating out of aging server rooms. Simultaneously, western provinces entice batch-processing applications with lower power tariffs and abundant renewable energy, freeing scarce Tier 1 capacity for latency-sensitive AI training. Supply-chain headwinds, chiefly advanced packaging constraints and export restrictions on top-end GPUs, continue to temper near-term shipment velocity but are also stimulating indigenous processor adoption and the development of creative cooling architectures.
Key Report Takeaways
- By tier type, tier 3 installations dominated with a 71.24% share in 2025, whereas tier 4 facilities are expanding at a 20.31% CAGR through 2031.
- By data-center type, colocation deployments led with 56.87% of market share in 2025, while hyperscaler-owned sites are advancing at a 20.65% CAGR.
- By form factor, half-height blade servers captured 62.65% of market share in 2025; quarter-height micro-blades register the fastest growth at a 20.73% CAGR.
- By application, AI and machine-learning workloads accounted for 36.76% of market share in 2025, yet virtualization and private cloud workloads are rising at a 20.82% CAGR.
- By data-center size, hyperscale campuses held 40.54% of market share in 2025 and are on track for a 20.14% CAGR to 2031.
Note: Market size and forecast figures in this report are generated using Mordor Intelligence’s proprietary estimation framework, updated with the latest available data and insights as of January 2026.
China Data Center Server Market Trends and Insights
Drivers Impact Analysis*
| Driver | (~) % Impact on CAGR Forecast | Geographic Relevance | Impact Timeline |
|---|---|---|---|
| Surge in AI and GPU-Accelerated Workload Demand | +4.2% | National, concentrated in Beijing, Shanghai, Shenzhen, Hangzhou | Short term (≤ 2 years) |
| Rising Enterprise Cloud Adoption and Public Cloud IaaS Spending | +3.8% | National, led by eastern provinces and Pearl River Delta | Medium term (2-4 years) |
| Rapid 5G Roll-Out Catalyzing Edge Data Center Expansion | +3.5% | National, early gains in Guangdong, Jiangsu, Zhejiang | Medium term (2-4 years) |
| Government Digital-Infrastructure Incentives and Subsidies | +2.9% | National, prioritizing western regions under East-Data-West-Computing | Long term (≥ 4 years) |
| Commercialization of Underwater Data Centers for Sustainable Cooling | +1.8% | Coastal provinces: Shanghai, Hainan, Guangdong | Long term (≥ 4 years) |
| Factory-Integrated Cabinet Delivery Shortening Deployment Lead Times | +1.6% | National, with ODM hubs in Shenzhen, Suzhou | Short term (≤ 2 years) |
| Source: Mordor Intelligence | |||
Surge in AI and GPU-Accelerated Workload Demand
Large language models such as Alibaba’s Tongyi Qianwen and Baidu’s ERNIE require clusters of eight-way GPU nodes linked by 400 GbE or InfiniBand fabrics, pushing typical rack densities above 70 kW. Operators purchased roughly 1 million Nvidia H20 GPUs in 2025, pairing them with custom cold-plate loops to maximize throughput despite lower peak flops. Huawei’s Ascend 910B, fabricated at SMIC, is winning share among state-owned enterprises prioritizing supply-chain sovereignty over raw benchmark records. The Ministry of Industry and Information Technology reported a 45% jump in intelligent-computing power installations in early 2025, triple the growth of general-purpose servers. These dynamics lift average selling prices, accelerate adoption of NVMe storage, and magnify the overall momentum of the China data center server market.
Rising Enterprise Cloud Adoption and Public Cloud IaaS Spending
CAICT estimated that 38% of enterprise workloads ran on public or hybrid clouds by end-2025, up from 29% in 2023.[1]Alibaba Cloud, “Tongyi Qianwen Technical White Paper,” ALIBABACLOUD.COM Tencent Cloud pledged USD 10 billion through 2030 for new campuses in Tianjin, Chongqing, and Qingyuan, heightening bulk demand for high-density chassis. Alibaba Cloud’s fifth-generation ECS instances, powered by ARM-based Yitian 710 chips, trimmed per-VM cost by 20% relative to x86 predecessors.[2]China Academy of Information and Communications Technology, “Cloud Computing Development White Paper 2025,” CAICT.AC.CN With Baidu operating more than 500,000 servers and planning 100,000 more in 2026, vendor success hinges on securing hyperscale design wins. This concentration further solidifies purchasing power and shapes customization trends across the China data center server market.
Rapid 5G Roll-Out Catalyzing Edge Data Center Expansion
The three national telecom carriers had installed 3.6 million 5G base stations by 2025, all requiring proximate edge compute for latency-critical workloads. CAICT projects 50,000 MEC sites by 2027, each with 2–10 RU of servers. Huawei’s ruggedized FusionServer E series and Inspur’s NF5180M6-Edge illustrate designs that tolerate −5 °C to 45 °C ambient ranges, run on 300 W envelopes, and enable remote O&M via 5G backhaul. Regulatory targets of PUE < 1.3 at the edge accelerate adoption of direct-to-chip liquid loops even in micro-server formats. Collectively, edge build-outs extend the geographic and workload footprint of the China data center server market.
Government Digital-Infrastructure Incentives and Subsidies
Under the East-Data-West-Computing program, Beijing allocated CNY 50 billion (USD 7 billion) in 2025 to spur hyperscale construction in Inner Mongolia, Gansu, Guizhou, and Ningxia. Electricity tariffs in these zones fall to CNY 0.28 /kWh versus CNY 0.65 in Shanghai, shaving TCO by up to 30%. China Telecom’s 100-MW Hohhot build exemplifies latency-tolerant batch processing shifting inland, freeing Tier 1 racks for revenue-dense AI clusters. Policies mandate 50% renewable power by 2027, driving server buyers toward energy-efficient liquid-cooled architectures. Incentives therefore widen regional capacity while lifting premium server demand along the coast, reinforcing growth drivers for the China data center server market.
Restraints Impact Analysis*
| Restraint | (~) % Impact on CAGR Forecast | Geographic Relevance | Impact Timeline |
|---|---|---|---|
| High CapEx and Power-Land Scarcity in Tier 1 Hubs | -2.7% | Beijing, Shanghai, Shenzhen, Guangzhou | Short term (≤ 2 years) |
| Export Controls Limiting Access to Cutting-Edge GPUs and CPUs | -2.3% | National, acute in AI research institutions and hyperscalers | Medium term (2-4 years) |
| Advanced Packaging Capacity Bottlenecks for AI Server Components | -1.9% | National, supply-chain dependencies on Taiwan and South Korea | Medium term (2-4 years) |
| Water-Use Restrictions Challenging Liquid-Cooling Scale-Up | -1.4% | Beijing, Shanghai, Tianjin, Hebei province | Long term (≥ 4 years) |
| Source: Mordor Intelligence | |||
High CapEx and Power-Land Scarcity in Tier 1 Hubs
Land in Beijing’s Yizhuang and Shanghai’s Lingang averaged CNY 15 million (USD 2.1 million) per acre in 2025, while municipal power caps hold new allocations to 50 MW per project.[3]China Real Estate Information Corporation, “Land Price Index Report Q4 2025,” CRIC.COM Shenzhen bans builds with PUE above 1.25, effectively mandating liquid cooling and adding 20% to upfront spend. Operators retrofit telecom exchanges or source capacity in Chengdu and Wuhan where land costs one-third as much, then reserve Tier 1 racks for GPU-dense clusters. The bifurcated strategy increases logistical complexity and slows urban expansion, curbing near-term velocity for the China data center server market.
Export Controls Limiting Access to Cutting-Edge GPUs and CPUs
U.S. rules bar shipment of Nvidia H100, A100, and AMD MI300 GPUs, forcing Chinese buyers to rely on down-binned H20 parts that extend AI training cycles 40-60%. Huawei’s Ascend 910B delivers 26 TFLOPS FP16, yet porting CUDA-optimized frameworks to CANN prolongs software integration. Meanwhile, CoWoS packaging queues lengthened to eight months in 2025, inflating server prices by 25% and stretching lead times past two quarters. Such constraints temper deployment schedules and complicate capacity planning across the China data center server market.
*Our forecasts treat driver/restraint impacts as directional, not additive. The impact forecasts reflect baseline growth, mix effects, and variable interactions.
Segment Analysis
By Tier Type: Emphasis On Fault Tolerance Lifts Premium Segment
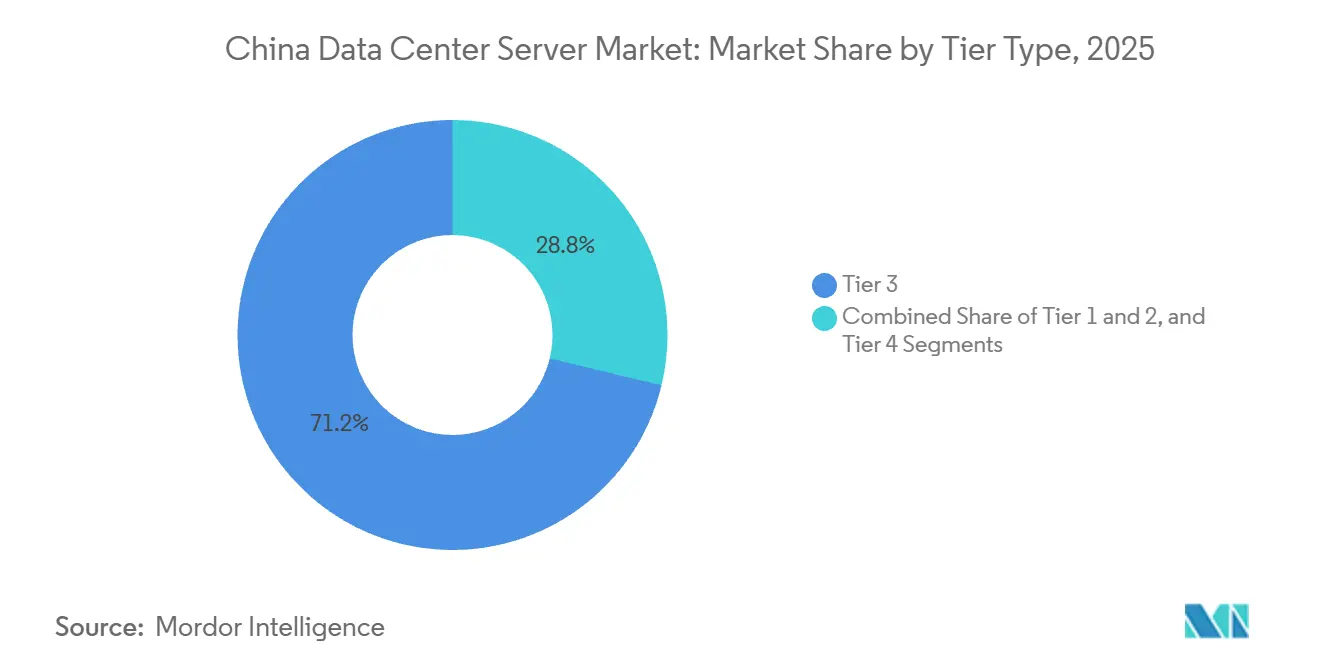
Tier 3 facilities held 71.24% of 2025 installations, underscoring their balance of cost and 99.982% uptime, while Tier 4 capacity is rising at a 20.31% CAGR as finance and public-cloud operators safeguard AI training runs from interruption. In 2025, China Construction Bank reported 12 Tier 4 sites that hosted distributed-ledger settlement workloads without unscheduled outages. Insurance carriers and hospitals follow suit to comply with 99.995% availability mandates. Vendors cater with blade platforms featuring dual-path fabrics and hot-swap everything, elevating ASPs but minimizing downtime penalties.
Price-sensitive SMEs continue to favor Tier 3 colocation racks that cost roughly 30% less than Tier 4 cabinets, fueling resilient refresh for single-supply air-cooled servers. Prefabricated Tier 3 pods, deliverable in six months, suit the rapid iteration culture of Chinese software firms. Consequently, the China data center server market sustains a dual-track mix, where high-margin Tier 4 nodes grow fastest yet Tier 3 still anchors shipment volume.



By Data Center Size: Hyperscale Dominates Capacity And Innovation
Hyperscale campuses with more than 10,000 servers commanded 40.54% of installed units in 2025 and are progressing at a 20.14% CAGR as Alibaba Cloud, Tencent Cloud, and Baidu Cloud add greenfield sites inland. Alibaba operated seven such campuses in 2025 and announced two more in Chengdu and Wuhan, each designed for 80,000 liquid-cooled racks. Volume buys secure up to 30% list-price discounts and enable co-design of custom silicon.
Large (1,000-10,000 servers) and medium (100-1,000) facilities remain vital for regional ISPs, provincial governments, and industrial hubs that crave local control but lack hyperscale budgets. Small on-premise rooms are retiring as cloud-first mandates take hold, redirecting replacement demand into shared facilities. The resulting scale polarization concentrates bargaining power and defines roadmaps for the China data center server market.
By Data Center Type: Colocation Leads, Hyperscalers Gain Share
Colocation operators enjoyed 56.87% deployment share in 2025, hosting regulated workloads that require customer hardware ownership yet professional facilities management. GDS Holdings added 120 MW of Tier 1 city capacity in late-2025, illustrating persistent urban demand. At the same time, hyperscalers are pressing a 20.65% CAGR by internalizing batches to fine-tune cooling and networking at lower TCO.
Enterprise server rooms continue to shrink, giving way to edge PoPs or cloud services that better meet PUE and staffing constraints. Colocation firms differentiate with liquid-cooling-as-a-service and compliance audits, boosting stickiness even as hyperscalers scoop strategic land. These cross-currents shape procurement cycles and vendor ranking within the China data center server market.
By Form Factor: Blades Remain Mainstream As Micro-Blades Accelerate
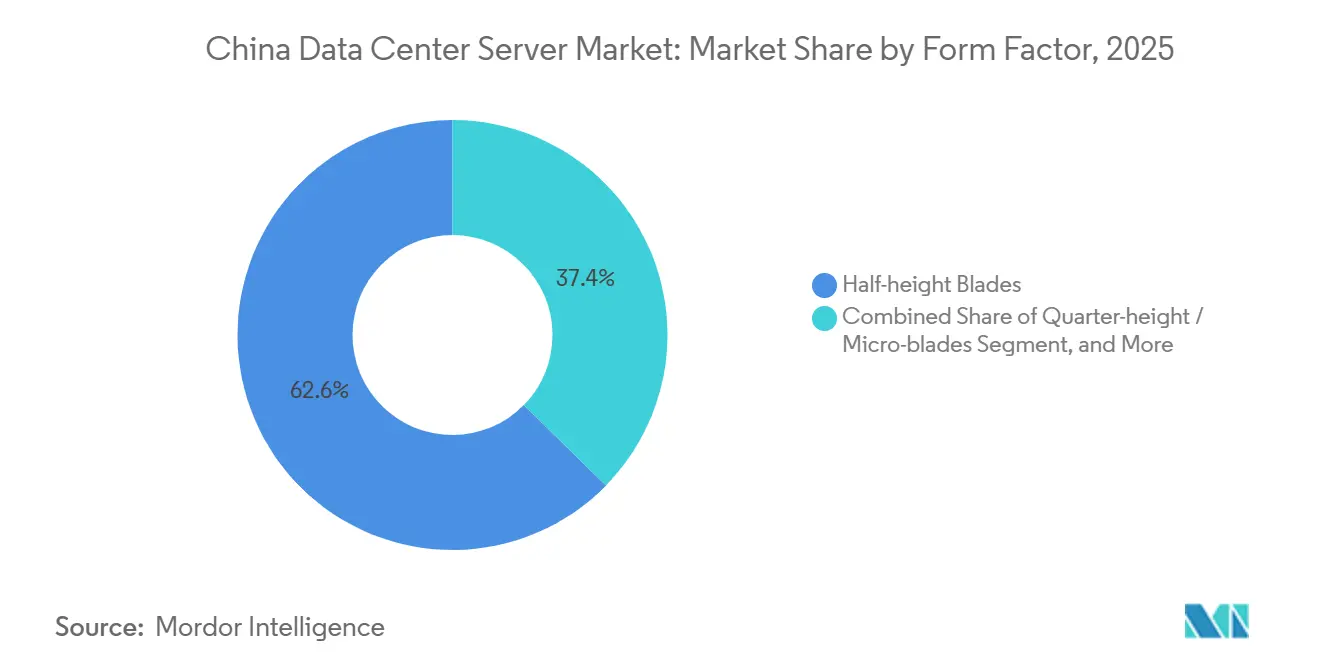
Half-height blades filled 62.65% of shipments in 2025, leveraging shared chassis resources to enhance density. A 10U enclosure holding 16 blades provides 32 CPU sockets, translating into operational savings on cabling and airflow. Liquid-cooling-ready variants enable 15 kW per blade, keeping pace with GPU requirements. Quarter-height micro-blades, however, are expanding at a 20.73% CAGR as 5G MEC sites need compact, low-power nodes.
Huawei’s CH121 V5 and Inspur’s NF5180M6-Edge typify micro-servers that fit telecom racks and tolerate high ambient temperatures. As operators shift inference workloads to the edge, the China data center server market size for micro-blades is expected to multiply, while full-height GPU blades remain staples for centralized AI training clusters.
By Application And Workload: AI Leads While Virtualization Rebounds
AI, ML, and data-analytics tasks occupied 36.76% of server cycles in 2025, fueled by multimodal model training and fraud-detection engines. Alibaba’s Tongyi Qianwen required a USD 300 million, 10,000-GPU cluster, spotlighting the capital intensity of frontier AI. Nevertheless, virtualization and private cloud workloads are rising at a 20.82% CAGR as enterprises refactor monoliths into containerized microservices to satisfy digital-transformation targets.
High-performance computing and storage workloads migrate to inland hyperscale sites where power is cheaper. Edge servers, equipped with T4 or MLU220 accelerators, proliferate in mobile-gaming and autonomous-vehicle telemetry. The resulting workload mosaic expands total addressable demand, ensuring the China data center server market share of AI remains high even as traditional IT refresh accelerates.
Geography Analysis
Eastern seaboard provinces such as Beijing, Shanghai, Guangdong, and Zhejiang hosted 55% of installed capacity in 2025, leveraging dense fiber, high spending power, and proximity to multinational headquarters. Beijing’s Yizhuang zone interconnects directly with ChinaNet backbones, supporting latency-sensitive fintech and gaming apps. Shanghai’s Lingang cluster specializes in Tier 4 builds for high-frequency trading, sustaining rack rates that justify sub-1.1 PUE investments. Guangdong’s linkage to Hong Kong attracts cross-border SaaS, with colocation vacancy under 8% despite steady supply growth.
Under the East-Data-West-Computing program, Inner Mongolia, Gansu, Guizhou, and Ningxia are absorbing batch-processing and archival workloads. Inner Mongolia offers CNY 0.25 /kWh wind power, 60% below Shanghai levels, prompting China Mobile and China Unicom to commission 100-MW campuses. Guizhou’s cool climate enables free-air cooling ten months a year, further improving TCO. Western deployments typically emphasize storage-dense x86 nodes, while coastal sites reserve racks for GPU-rich AI clusters, illustrating a bifurcated hardware mix within the China data center server market.
Tier 2 cities like Chengdu, Wuhan, Xi’an, and Hangzhou emerge as equilibrium locations, offering land 50% cheaper than Tier 1 yet fiber latency under 10 ms to coastal IXPs. Alibaba’s planned hyperscale builds in Chengdu and Wuhan exemplify the trend. These cities also benefit from university talent pools and provincial incentives, driving localized edge deployments that expand the geographic footprint of the China data center server industry.
Regulatory Landscape
China's data center server procurement is influenced by national data protection and cybersecurity requirements, alongside energy-efficiency mandates that shape server density and cooling choices. The Cybersecurity Law, Data Security Law, and Personal Information Protection Law reinforce localization and compliance needs for critical information infrastructure (CII) operators, affecting hardware qualification, supply-chain assurance, and the deployment of sensitive workloads.
On the infrastructure side, MIIT has continued to steer the sector toward greener, higher-density builds, including policy direction on energy-saving equipment and data center efficiency. These measures tie new-build economics to low PUE outcomes and support faster liquid-cooling adoption. In June 2026, authorities introduced measures to facilitate green power direct-connection models for industrial parks and data centers, complementing the broader East-Data-West-Computing framework that channels capacity growth toward national hub nodes in regions such as Inner Mongolia, Gansu, Guizhou, and Ningxia.
Competitive Landscape
The market indicates moderate concentration, with players such as Huawei, Inspur, Lenovo, Dell Technologies, New H3C, and others. Huawei leverages Kunpeng CPUs and Ascend GPUs to sell vertically integrated FusionServers insulated from export shocks, winning government and SOE deals. Inspur and Lenovo deploy rapid-customization factories capable of delivering tailored racks in four weeks, catering to hyperscalers that refresh thousands of nodes per order. Dell Technologies and Hewlett Packard Enterprise remain preferred by multinationals for global support continuity but face 20-25% pricing gaps versus domestic peers.
Original design manufacturers such as Foxconn accelerate share gains by shipping turnkey, liquid-ready cabinet pods that compress on-site installation from weeks to days. Cooling specialists like CoolIT Systems partner with server brands to retrofit installed fleets, prolonging asset life cycles. Indigenous chipmakers Phytium, Hygon, Cambricon collaborate with OEMs on reference boards to meet cybersecurity localization rules, creating alternate technology stacks that diversify the China data center server market.
Huawei filed over 1,200 thermal-management patents between 2023 and 2025, potentially extracting royalties or deterring fast followers. Pricing battles persist, yet service attach rates liquid-coolant maintenance, firmware updates, AI-platform consulting now drive profitability more than bare-metal margin. The evolving landscape ultimately advantages suppliers capable of integrating silicon, firmware, rack mechanics, and field services into cohesive offers.
China Data Center Server Industry Leaders
Huawei Technologies Co., Ltd.
Lenovo Group Limited
New H3C Technologies Co., Ltd.
Super Micro Computer, Inc.
Dell Technologies Inc.
- *Disclaimer: Major Players sorted in no particular order

Market Opportunities and Future Outlook
AI-native infrastructure creates whitespace for integrated, high-density server platforms that combine compute, networking, and storage into deployable pods aligned with stricter efficiency requirements. Product activity in 2026 shows this direction, including Huawei's Atlas 950 SuperPoD and TaiShan SuperPoD offerings and New H3C's UniPoD S80000 series SuperPod, alongside upgrades in intelligent computing switches and AI-native storage. As racks move toward higher power envelopes and liquid cooling becomes embedded in new builds, buyers are looking for liquid-ready chassis, serviceable cold-plate designs, and factory-integrated cabinet delivery that reduces on-site commissioning time.
Regional programs under East-Data-West-Computing and related provincial incentives also continue to shape where demand concentrates, particularly in western hub nodes where lower tariffs and renewables pair with batch-processing and training workloads. The June 2026 push to enable green power direct connections for data centers further strengthens the case for operators and colocation providers to procure server fleets that can run at higher utilization under tighter carbon and PUE constraints. That, in turn, supports adjacent demand for energy-aware firmware, power-capping features, and storage architectures optimized for AI pipelines (for example, scale-out designs and memory pooling).
Recent Industry Developments
- June 2026: State-led procurement for 40,000 servers valued up to 11.55 billion yuan progressed with suppliers linked to the Huawei Kunpeng ecosystem securing about 71% of contract value. This procurement supports faster Arm/Kunpeng based server adoption and consolidates domestic supplier leadership and ecosystem momentum.
- May 2026: H3C launched the UniPoD S80000 series SuperPod, S9800 intelligent computing switch, and X20000 AI-native storage during NAVIGATE 2026 in Beijing. The launch expands domestic integrated data-center pod and AI-native storage offerings and improves local system-integration capability.
- March 2026: At MWC Barcelona 2026, Huawei unveiled its Atlas 950 SuperPoD, TaiShan 950 SuperPoD, and TaiShan 200/500 series computing solutions for carrier and AI data center environments. The release strengthens Huawei's Kunpeng/Ascend based stack and reinforces Huawei's position in AI-ready data-center solutions.


Research Methodology Framework and Report Scope
Market Definition and Coverage
This market counts the revenue generated from servers deployed inside data centers in China, including systems purchased by hyperscalers, colocation operators, and enterprise facilities that host workloads.
Scope exclusions: It excludes data center buildings and power and cooling infrastructure, as well as standalone PC and consumer servers not deployed for data center operations.
Segmentation Overview
- By Tier Type
- Tier 1 and 2
- Tier 3
- Tier 4
- By Data Center Size
- Small Data Center
- Medium Data Center
- Large Data Center
- Hyperscale Data Center
- By Data Center Type
- Colocation Data Center
- Hyperscalers Data Center/CSPs
- Enterprise and Edge Data Center
- By Form Factor
- Half-height Blades
- Full-height Blades
- Quarter-height / Micro-blades
- By Application / Workload
- Virtualisation and Private Cloud
- High-Performance Computing (HPC)
- Artificial Intelligence/Machine Learning and Data Analytics
- Storage-centric
- Edge / IoT Gateways
Data Sources, Market Sizing, and Validation
Desk Research
Desk research started with mapping China data center capacity buildouts and how they translate into server demand. Public statistics and sector indicators were reviewed from sources such as the National Bureau of Statistics of China, the Ministry of Industry and Information Technology, China Customs trade statistics, the International Telecommunication Union, and the International Energy Agency for power and efficiency context.
To tighten assumptions, we also reviewed company annual reports, exchange filings, investor presentations, earnings call notes, and reputable press coverage on large campus expansions and policy programs (including East Data, West Compute). Where needed, paid subscriptions for company financials and news, patent databases, and shipment-level import and export tracking were used to cross-check timelines and build a clean list of active suppliers and buyers. The desk sources noted here are illustrative, and many other public references were used to validate and clarify the data points we collected.
Primary Interviews and Surveys
Primary work was used to confirm what portion of installed IT load translates into server purchases each year, and how the mix is shifting toward accelerator-rich nodes and higher density racks. We spoke with data center operators, cloud and internet platform buyers, systems integrators, and component channel participants across major demand hubs, and then reconciled differences in pricing, lead times, and refresh behavior before finalizing the model.
Distribution of primary research fieldwork respondents
| Company type | Respondent position |
|---|---|
| Top tier: 39% | CXOs: 16% |
| Mid tier: 40% | Functional/Unit leaders: 36% |
| Smaller Players: 21% | Managers: 48% |
Market-Sizing & Forecasting
Sizing was built using a top-down demand reconstruction where new data center capacity additions and IT load commissioning were converted into server units, and then translated into revenue using application-weighted average selling prices. The unit path was adjusted using checks such as data center tier expansion patterns, average rack density by workload, the share of AI and HPC deployments, replacement cycles for x86 refreshes, and the mix shift toward liquid-cooled and GPU-dense configurations.
Those totals were then corroborated with selective bottom-up approximations, such as sampled supplier revenue splits, channel checks on shipment cadence, and a volume times ASP build for a set of common configurations. When gaps appeared, they were handled by using conservative ranges from interview feedback and then narrowing them using trade flow directionality and announced capacity rollouts. For forecasting, we used scenario analysis anchored on expected commissioning schedules, policy-driven compute relocation, and pricing normalization as supply constraints ease, and the final trajectory was reviewed against what respondents consider a realistic procurement cadence.
Data Validation & Update Cycle
Outputs were validated through multiple passes, first by cross-checking implied server units per MW against typical design assumptions, and then by testing whether the revenue curve aligns with known expansion cycles for hyperscale and colocation builds. Any sharp jumps were flagged, and we re-checked the underlying drivers like price steps for accelerator configurations, delayed commissioning, or one-off procurement events.
Before sign-off, the model and key assumptions are reviewed by another analyst, followed by a final consistency check across years and conversion rates. The report is refreshed annually, and interim updates are made when material events change demand, supply, or pricing. Right before delivery, we do a fresh pass so clients receive the most current view available.
Mordor Intelligence's China Data Center Server Market Size Versus Other Published Estimates
Published market sizes for China data center servers can look far apart because the studies do not always count the same things, and they also use different price and shipment timing assumptions. Differences usually come from what is treated as a data center server versus a broader server market, which workloads are emphasized, and how currency conversion and base year selection are handled.
A common gap driver is whether AI accelerator servers are counted as complete systems at system ASPs, or whether the pricing is anchored on older x86 configurations that understate the current mix shift. Another driver is refresh cadence, where some sources assume smooth annual replacements, even though ordering can be lumpy due to campus commissioning schedules and lead-time constraints. When server demand is tied back to commissioned IT load and rack density by workload, with pricing normalized to the purchase window, the spread becomes easier to explain, which is how it is handled here by Mordor Intelligence.
Benchmark comparison
| Source | Market Size | Gaps in Research Methodology |
|---|---|---|
| Mordor Intelligence | USD 12.95 B (2025) | |
| Industry Tracker A | USD 18.20 B (2025) | Uses a broader China server revenue pool and attributes a larger share to data centers, which can pull in edge and enterprise server demand outside dedicated facilities. |
| Trade Journal B | USD 10.40 B (2024) | Relies on an older base year and a narrower x86-focused ASP curve, which can undercount GPU-dense systems and delay the impact of new hyperscale campus ramps. |
Taken together, the comparison shows that scope and timing choices explain most of the variance, rather than a single growth assumption. By keeping the demand pool tied to data center commissioning signals and then stress-testing prices and mix with interview inputs, the final number stays traceable to clear steps that can be repeated year to year.


Key Questions Answered in the Report
What is the current value of the China data center server market?
The market was valued at USD 15.36 billion in 2026 and is forecast to reach USD 36.68 billion by 2031.
How fast is spending on servers in China growing?
Revenue is projected to rise at a 19.02% CAGR between 2026 and 2031, led by AI-optimized, liquid-cooled platforms.
Which server form factor is most popular among Chinese operators?
Half-height blade servers dominate shipments with a 62.65% share in 2025, though micro-blades are the fastest-growing choice for edge sites.
Why are hyperscale data centers expanding inland?
Western provinces offer cheaper land, lower power tariffs, and renewable-energy incentives, helping operators shift latency-tolerant workloads while freeing Tier 1 space for GPU clusters.
How are U.S. export controls affecting Chinese server procurement?
Restrictions on top-end GPUs extend AI training times and force operators to adopt domestically produced accelerators, lengthening deployment cycles and raising server costs.
What cooling technologies are gaining traction in China’s data centers?
Direct-to-chip liquid loops, immersion baths, and pilot underwater modules are all being adopted to meet aggressive PUE targets and municipal water quotas.
Page last updated on:
- Artificial Intelligence (AI) Data Center Market AI facilities across all regions, split by facility type, component and tier.
- Data Center Construction Market Construction across the global market, covering tier, facility size and facility type.
- China Hyperscale Data Center Market China hyperscale sites, split by facility type, component and tier.
- France Hyperscale Data Center Market Hyperscale sites in France, split by facility type, component and tier.
- China Artificial Intelligence (AI) Optimised Data Center Market AI facilities in China, split by facility type, component and tier.
- France Data Center Construction Market Construction demand across France, covering tier, facility type and infrastructure.





