Cyber Risk Quantification And Scoring Platforms Market Size and Share
Market Overview
| Study Period | 2020 - 2031 |
|---|---|
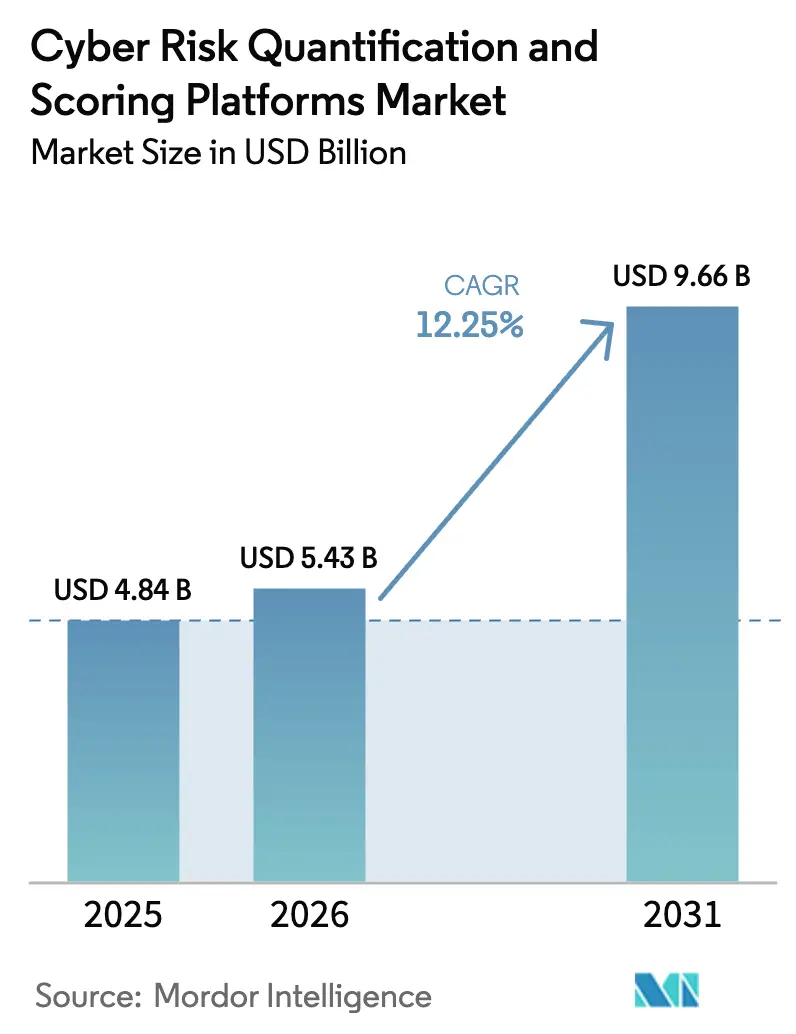
| Market Size (2026) | USD 5.43 Billion |
| Market Size (2031) | USD 9.66 Billion |
| Growth Rate (2026 - 2031) | 12.25% CAGR |
| Fastest Growing Market | Asia Pacific |
| Largest Market | North America |
| Market Concentration | Medium |
Major Players *Disclaimer: Major Players sorted in no particular order Image © Mordor Intelligence. Reuse requires attribution under CC BY 4.0. | |
Cyber Risk Quantification And Scoring Platforms Market Analysis by Mordor Intelligence
The cyber risk quantification and scoring platforms market size was valued at USD 4.84 billion in 2025 and estimated to grow from USD 5.43 billion in 2026 to reach USD 9.66 billion by 2031, at a CAGR of 12.25% during the forecast period (2026-2031). This expansion reflects the migration from qualitative assessments to financially expressed risk models that satisfy regulatory disclosure rules and insurer demands. Enterprise boards, insurers, and regulators now converge on a single expectation: express cyber exposure in clear monetary terms. Adoption accelerates as actuarial-grade data improves underwriting, while AI-driven analytics turn static assessments into real-time financial impact projections. Growth is particularly visible among small and medium enterprises that access SaaS platforms, and among Asian buyers that leapfrog legacy qualitative tools.
Key Report Takeaways
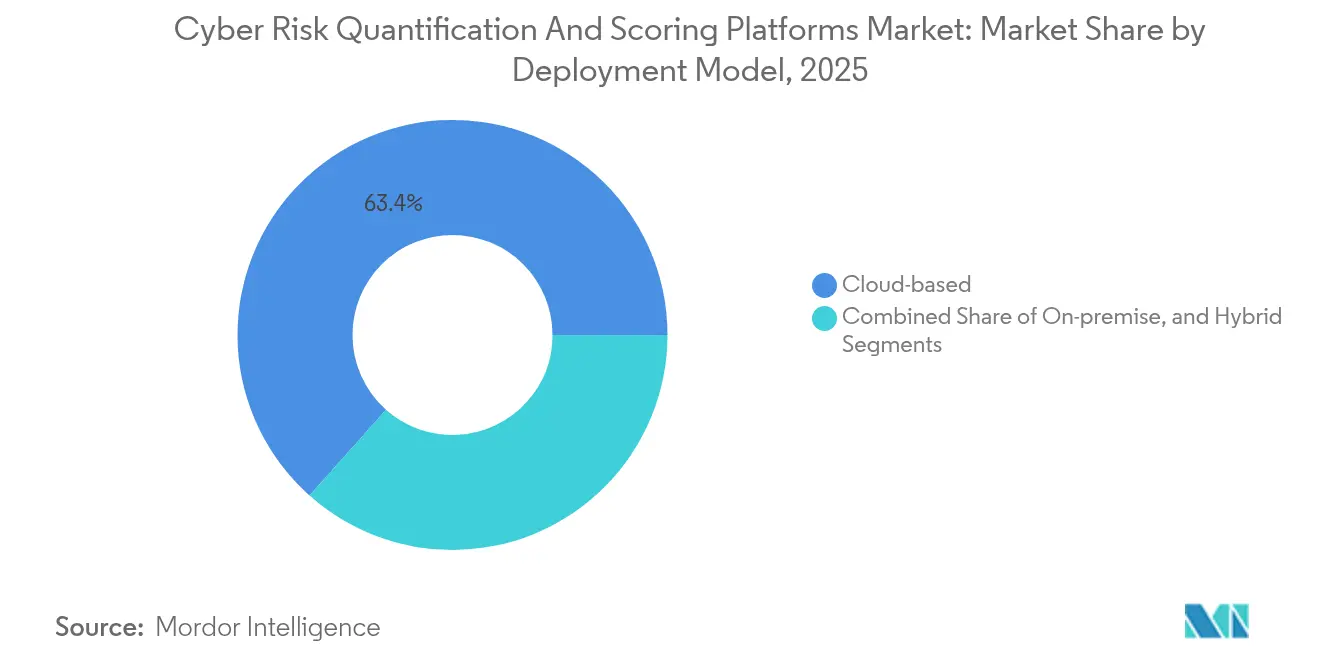
- By deployment model, cloud-based deployments led with 63.42% of the cyber risk quantification and scoring platforms market share in 2025, while hybrid deployments are projected to expand at a 17.12% CAGR through 2031.
- By organisation size, large enterprises controlled 60.38% of the 2025 cyber risk quantification and scoring platforms market size, yet the SME segment is set to grow fastest at 14.62% CAGR to 2031.
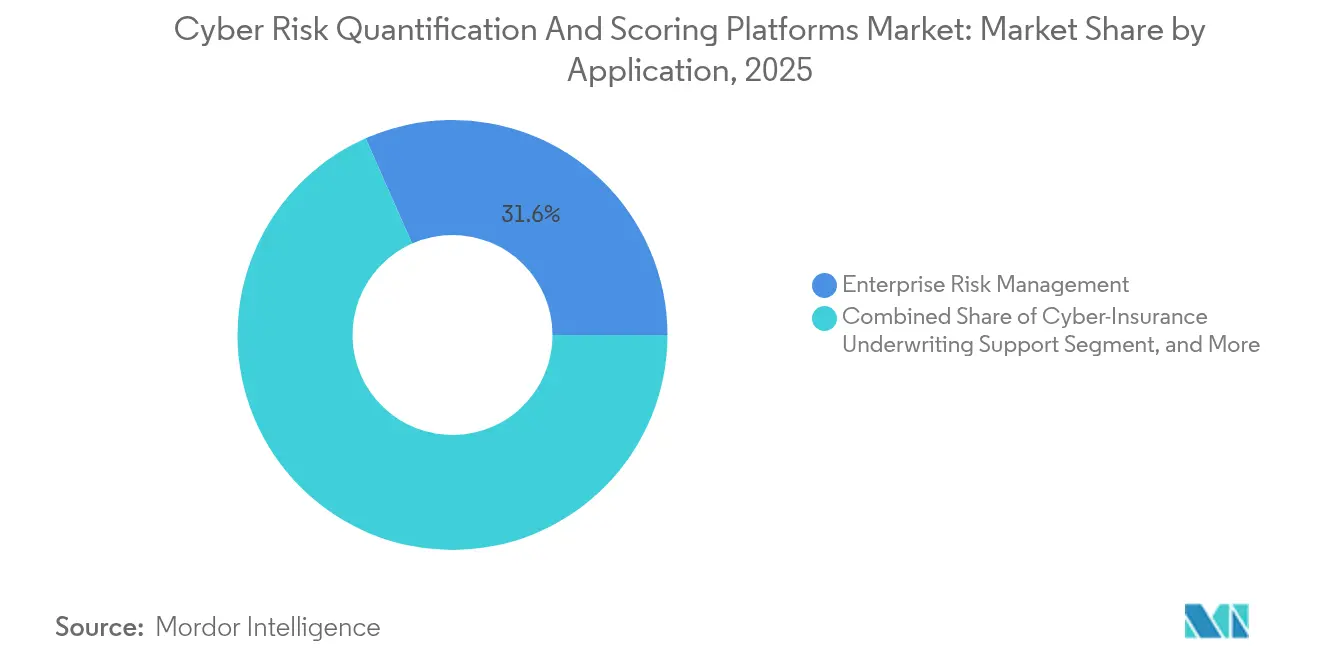
- By application, enterprise risk management held a 31.62% of the 2025 cyber risk quantification and scoring platforms market size; cyber-insurance underwriting support will register the highest CAGR of 19.28% over the forecast window.
- By industry vertical, BFSI vertical captured 27.65% of the 2025 cyber risk quantification and scoring platforms market size, whereas healthcare is forecast to grow at a 15.72% CAGR thanks to heightened ransomware exposure.
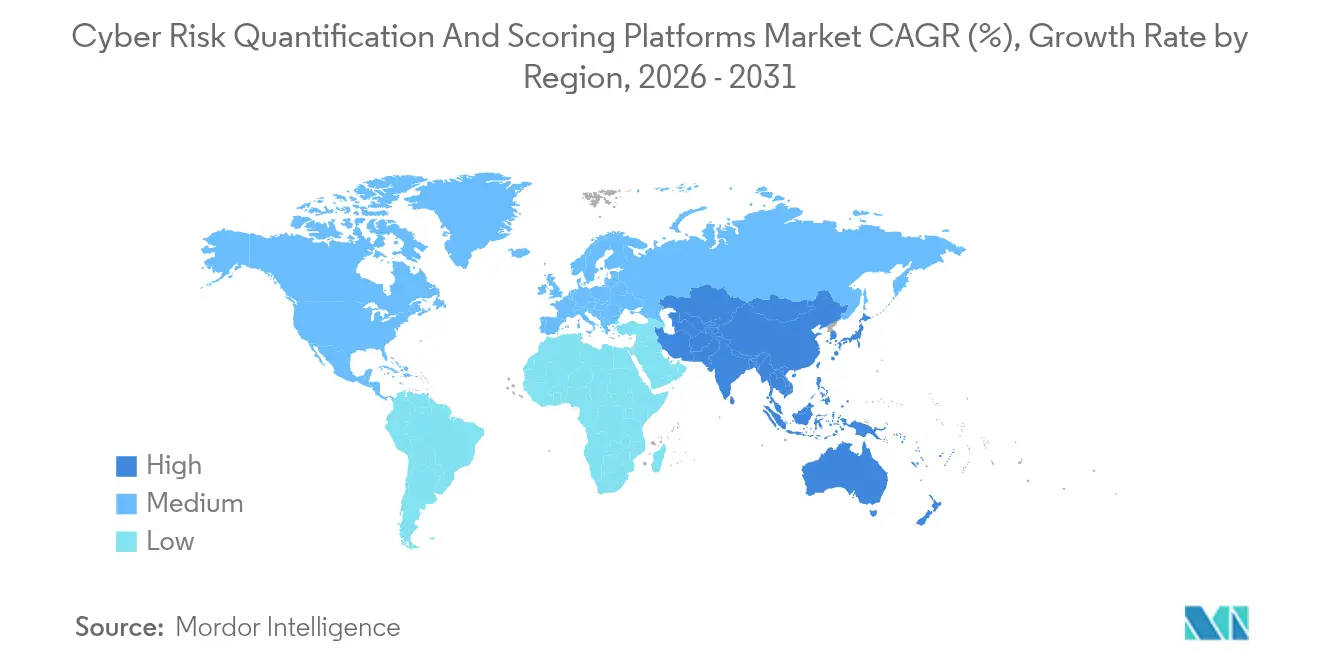
- By geography, North America accounted for 45.70% of the 2025 cyber risk quantification and scoring platforms market size; Asia-Pacific will lead regional growth at 14.92% CAGR through 2031.
Note: Market size and forecast figures in this report are generated using Mordor Intelligence’s proprietary estimation framework, updated with the latest available data and insights as of 2026.
Global Cyber Risk Quantification And Scoring Platforms Market Trends and Insights
Drivers Impact Analysis*
| Driver | (~) % Impact on CAGR Forecast | Geographic Relevance | Impact Timeline |
|---|---|---|---|
| Regulatory mandates for quantitative cyber-risk disclosure | +3.2% | Global, with early adoption in North America and the EU | Medium term (2-4 years) |
| Accelerating cyber-insurance adoption demands actuarial-grade data | +2.8% | Global, led by North America, expanding to the Asia-Pacific | Short term (≤ 2 years) |
| AI-driven real-time financial-impact modelling | +2.1% | North America and the EU core, spill-over to the Asia-Pacific | Medium term (2-4 years) |
| Board-level pressure to express cyber risk in monetary terms | +1.9% | Global, concentrated in public companies | Short term (≤ 2 years) |
| Supply-chain attack surge elevating external risk scoring needs | +1.7% | Global, with manufacturing hubs in the Asia-Pacific, most affected | Long term (≥ 4 years) |
| Tokenisation of cyber risk into capital-market instruments | +0.8% | North America and the EU, pilot programs in select markets | Long term (≥ 4 years) |
| Source: Mordor Intelligence | |||
Regulatory mandates for quantitative cyber-risk disclosure
The United States SEC cybersecurity rules that became effective in December 2023 oblige public issuers to file material incident details within four business days and discuss governance processes in financial terms. Similar obligations emerge in Europe under DORA and NIS2, compelling banks and operators of essential services to produce structured ICT risk assessments. Boards, therefore, prioritise platforms that translate vulnerabilities into dollar-denominated loss scenarios, eliminating qualitative ambiguity and improving audit readiness.
Accelerating cyber-insurance adoption demanding actuarial-grade data
Global cyber-insurance premiums are on track to reach USD 29 billion by 2027, and 75% of top carriers already use advanced analytics for continuous risk selection.[1]Arthur J. Gallagher, “2025 Cyber Insurance Market Conditions Outlook,” ajg.com Insurers reward clients who produce quantified loss curves, while parametric covers and catastrophe bonds rely on the same data stream. As a result, the cyber risk quantification and scoring platforms market benefits from insurer-driven pull as well as enterprise push.
AI-driven real-time financial-impact modelling
AI transforms one-off FAIR assessments into live dashboards that adjust loss distributions whenever threat intelligence or asset values move. Guidance from the U.S. Department of the Treasury urges the financial sector to model AI-specific security failures in monetary terms. Financial institutions, therefore, adopt generative adversarial networks for tail-risk estimation, a capability now embedded in leading quantification suites.
Board-level pressure to express cyber risk in monetary terms
Delaware case law clarifies directors’ duty of care for cybersecurity oversight, raising personal liability fears among board members. The updated NIST CSF 2.0 “Govern” function further elevates the topic. Resulting demand for clear, CFO-friendly loss numbers propels adoption of quantification software that feeds into capital allocation, D&O insurance, and executive compensation benchmarks.
Restraints Impact Analysis*
| Restraint | (~) % Impact on CAGR Forecast | Geographic Relevance | Impact Timeline |
|---|---|---|---|
| Absence of agreed-upon modelling standards | -2.1% | Global, with fragmentation most acute in emerging markets | Medium term (2-4 years) |
| Data privacy rules restricting incident data sharing | -1.4% | EU and North America, expanding to Asia-Pacific | Long term (≥ 4 years) |
| Scarcity of FAIR-certified quant talent | -1.2% | Global, most severe in Asia-Pacific and emerging markets | Long term (≥ 4 years) |
| Credibility gaps from immature Gen-AI models | -0.9% | Global, with higher scepticism in regulated industries | Short term (≤ 2 years) |
| Source: Mordor Intelligence | |||
Absence of agreed-upon modelling standards
Although the FAIR Institute introduced the Open FAIR 2 certification to harmonise terminology, divergence persists across industries and regulators, hindering cross-enterprise benchmarking. Investors in cyber-linked securities seek uniform loss curves before deploying capital, yet different distributions and quantile methods remain common. This standardisation deficit slows the cyber risk quantification and scoring platforms market because multinational buyers must reconcile overlapping frameworks before scaling a global program.
Data-privacy rules restricting incident-data sharing
GDPR, CCPA, and a wave of national privacy acts limit disclosure of breach telemetry that fuels actuarial models. As a result, vendors often synthesise data sets or rely on public filings, lowering model granularity. Privacy-preserving options such as federated learning exist but add complexity and cost, particularly for smaller buyers. Fragmented data pools, therefore, dampen prediction accuracy, tempering growth prospects in highly regulated regions.
*Our forecasts treat driver/restraint impacts as directional, not additive. The impact forecasts reflect baseline growth, mix effects, and variable interactions.
Segment Analysis
By Deployment Model: Hybrid solutions balance control and scalability
Hybrid architectures generated a 17.12% CAGR outlook as enterprises keep sensitive datasets on-premises while harnessing cloud analytics for Monte Carlo simulations. Cloud services nonetheless retained the largest 63.42% cyber risk quantification and scoring platforms market share in 2025, thanks to rapid provisioning and subscription pricing that attract mid-market buyers. On-premises deployments served defence and critical infrastructure operators that face strict residency laws.
Hybrid adoption rose because DORA and sector-specific guidelines require internal control over high-value data, yet boards still want AI-based forecasting that is cost-effective. Financial institutions mix local data lakes with SaaS sandboxes, delivering continuous value-at-risk estimates without violating sovereignty rules. This flexibility supports the cyber risk quantification and scoring platforms market size expansion among regulated entities that were reluctant to migrate fully to the public cloud.


By Organization Size: SMEs close the resilience gap
SMEs delivered the fastest 14.62% CAGR as affordable SaaS tools removed entry barriers. Large enterprises still commanded 60.38% of 2025 revenue, reflecting earlier adoption cycles and broad asset portfolios. However, supply-chain clauses from larger customers now oblige smaller suppliers to present quantified risk scores, creating market pull.
SMEs historically lacked incident response testing and insurance penetration, yet regulatory spill-over and insurer portals now offer ready-made assessment templates. Simplified dashboards convert technical findings into financial language that executives understand, shrinking the resilience gap and broadening the cyber risk quantification and scoring platforms customer base.
By Application: Insurance underwriting reshapes data requirements
Cyber-insurance underwriting support will grow at a 19.28% CAGR, overtaking governance and compliance use cases. Insurers use API feeds from policyholders to recalculate aggregate limits and co-insurance structures. Enterprise risk management held a 31.62% revenue lead in 2025, still crucial as a starting point for program budgeting and board reporting.
Third-party risk management also expands as 98% of corporates report supply-chain disruptions, prompting quantified scorecards in vendor contracts. Boards integrate monetary risk forecasts into capital plans, while auditors request the same data for DORA and NIS2 submissions, embedding quantification platforms deeply into assurance workflows.
By Industry Vertical: Healthcare shows the highest velocity
Healthcare achieved a 15.72% CAGR outlook, driven by ransomware incidents such as the USD 6.3 billion Change Healthcare disruption. BFSI retained a dominant 27.65% share because actuarial culture already values quantified operational risk.
Manufacturers adopt solutions to protect industrial control systems and comply with new digital-product directives. IT and telecom providers quantify exposure for SLA pricing, while energy utilities model grid-outage losses linked to smart infrastructure. Government agencies replicate Minnesota’s multi-agency rollout to justify cybersecurity budgets using financial language.
Geography Analysis
North America’s 45.70% share in 2025 stems from early SEC disclosure rules and mature insurance demand. Prominent vendors such as RiskLens, Bitsight, and Kovrr originated regional best practices that now influence global procurement. Uptake spreads across Canada and Mexico as multinationals apply uniform methodologies to avoid compliance fragmentation. State governments invest in quantification to prioritise spending, reinforcing public-sector adoption momentum.
Asia-Pacific records the highest 14.92% CAGR. Regulatory pushes in Singapore, China, and Japan require structured risk metrics, while premiums remain lower than in the United States, implying significant headroom. Cyber-insurance premiums in the region grow nearly 50% annually, feeding real-time underwriting data back into vendor tools. SMEs in Thailand, Vietnam, and Malaysia use cloud-native suites to leapfrog spreadsheet-based assessments, accelerating the cyber risk quantification and scoring platforms market.
Europe’s trajectory accelerates with the Digital Operational Resilience Act becoming fully applicable in January 2025. Harmonised rules eliminate member-state variation and oblige financial entities to produce quantitative metrics, benefiting platform providers. GDPR restrictions create local demand for privacy-preserving analytics, spurring product innovation. The United Kingdom follows its own but similar path, prompting dual-regime features in many solutions.

Competitive Landscape
The market remains moderately fragmented yet trends toward consolidation. Bitsight’s USD 115 million purchase of Cybersixgill adds automated threat intelligence, bolstering credit-style risk scores.[4]BankInfoSecurity, “Bitsight Boosts Threat Intel Offerings With Cybersixgill Buy,” bankinfosecurity.com Moody’s partnership supplies 325 million-entity coverage, dwarfing rival datasets and raising competitive stakes.
Safe Security, Axio, and KPMG lead independent rankings for model transparency and board-ready visuals. Kovrr focuses on insurance portfolios, while SecurityScorecard counters with vendor-risk lineage. Litigation between vendors signals intense rivalry for data science talent and proprietary algorithms.
AI investment dominates R&D budgets, targeting dynamic loss forecasting and automated control mapping. Vendors build vertical templates for healthcare, manufacturing, and energy, while lighter tiers serve SMEs. The next consolidation wave is expected before 2027 as larger data providers acquire niche model developers to reinforce platform breadth.
Cyber Risk Quantification And Scoring Platforms Industry Leaders
Bitsight Technologies Inc.
SecurityScorecard Inc.
RiskLens Inc.
CyberCube Analytics Inc.
Safe Security Inc.
- *Disclaimer: Major Players sorted in no particular order

Recent Industry Developments
- February 2025: Bitsight closed its USD 115 million Cybersixgill acquisition, integrating automated threat intelligence with exposure scoring.
- January 2025: The Digital Operational Resilience Act became fully applicable across the EU financial sector, formalizing quantitative ICT risk rules.
- November 2024: CyberCube surpassed 100 clients and expanded catastrophe-bond analytics for insurers.
- September 2024: Gallagher Re reported 50% annual growth in Asia-Pacific cyber-insurance premiums, lifting underwriting data demand.


Global Cyber Risk Quantification And Scoring Platforms Market Report Scope
| Cloud-based |
| On-premise |
| Hybrid |
| Enterprise Risk Management |
| Third-Party / Vendor Risk Management |
| Cyber-Insurance Underwriting Support |
| Board Reporting and Strategy |
| Compliance and Audit Support |
| Small and Medium Enterprises (SMEs) |
| Large Enterprises |
| Banking, Financial Services and Insurance (BFSI) |
| Healthcare and Life Sciences |
| Retail and eCommerce |
| Manufacturing and Industrial |
| IT and Telecom |
| Energy and Utilities |
| Government and Defense |
| Other Industry Vertical |
| North America | United States | |
| Canada | ||
| Mexico | ||
| South America | Brazil | |
| Argentina | ||
| Rest of South America | ||
| Europe | Germany | |
| United Kingdom | ||
| France | ||
| Italy | ||
| Spain | ||
| Russia | ||
| Rest of Europe | ||
| Asia-Pacific | China | |
| Japan | ||
| India | ||
| South Korea | ||
| Rest of Asia-Pacific | ||
| Middle East and Africa | Middle East | Saudi Arabia |
| United Arab Emirates | ||
| Turkey | ||
| Rest of Middle East | ||
| Africa | South Africa | |
| Nigeria | ||
| Rest of Africa | ||
| By Deployment Model | Cloud-based | ||
| On-premise | |||
| Hybrid | |||
| By Application / Use-Case | Enterprise Risk Management | ||
| Third-Party / Vendor Risk Management | |||
| Cyber-Insurance Underwriting Support | |||
| Board Reporting and Strategy | |||
| Compliance and Audit Support | |||
| By Organisation Size | Small and Medium Enterprises (SMEs) | ||
| Large Enterprises | |||
| By Industry Vertical | Banking, Financial Services and Insurance (BFSI) | ||
| Healthcare and Life Sciences | |||
| Retail and eCommerce | |||
| Manufacturing and Industrial | |||
| IT and Telecom | |||
| Energy and Utilities | |||
| Government and Defense | |||
| Other Industry Vertical | |||
| By Geography | North America | United States | |
| Canada | |||
| Mexico | |||
| South America | Brazil | ||
| Argentina | |||
| Rest of South America | |||
| Europe | Germany | ||
| United Kingdom | |||
| France | |||
| Italy | |||
| Spain | |||
| Russia | |||
| Rest of Europe | |||
| Asia-Pacific | China | ||
| Japan | |||
| India | |||
| South Korea | |||
| Rest of Asia-Pacific | |||
| Middle East and Africa | Middle East | Saudi Arabia | |
| United Arab Emirates | |||
| Turkey | |||
| Rest of Middle East | |||
| Africa | South Africa | ||
| Nigeria | |||
| Rest of Africa | |||


Key Questions Answered in the Report
How large is the of the 2025 cyber risk quantification and scoring platforms market size in 2026?
It is valued at USD 5.43 billion and is projected to reach USD 9.66 billion by 2031.
Which deployment model grows fastest over the forecast period?
Hybrid deployments post a 17.12% CAGR as enterprises balance sovereignty and cloud analytics.
Why are SMEs adopting quantification platforms?
Supply-chain mandates and accessible SaaS tools help SMEs meet customer and insurer requirements.
What drives demand from insurers?
Actuarial-grade data supports USD 29 billion in projected cyber-insurance premiums and real-time underwriting.
Which region offers the highest growth opportunity?
Asia-Pacific demonstrates a 14.92% CAGR due to rapid digitalisation and evolving regulation.
How is healthcare using cyber risk quantification?
Hospitals model ransomware losses, exemplified by a USD 6.3 billion disruption after the Change Healthcare attack.
Page last updated on:


