Cyber Liability And Underwriting Tools Market Size and Share
Market Overview
| Study Period | 2019 - 2030 |
|---|---|
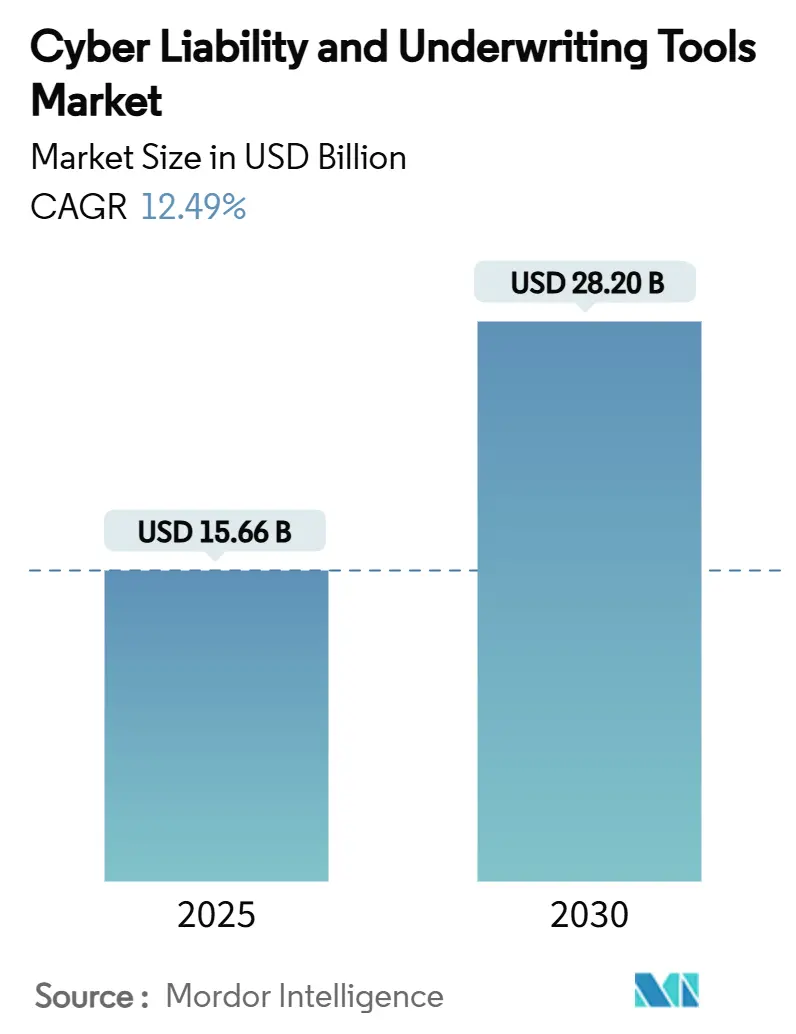
| Market Size (2025) | USD 15.66 Billion |
| Market Size (2030) | USD 28.20 Billion |
| Growth Rate (2025 - 2030) | 12.49% CAGR |
| Fastest Growing Market | Asia Pacific |
| Largest Market | North America |
| Market Concentration | Medium |
Major Players *Disclaimer: Major Players sorted in no particular order Image © Mordor Intelligence. Reuse requires attribution under CC BY 4.0. | |
Cyber Liability And Underwriting Tools Market Analysis by Mordor Intelligence
The cyber liability and underwriting tools market size stood at USD 15.66 billion in 2025 and is forecast to reach USD 28.20 billion by 2030, registering a 12.49% CAGR. The trajectory reflects a decisive pivot from questionnaire-based underwriting toward AI-driven, real-time platforms that ingest vast telemetry and map emerging vulnerabilities. Heightened ransomware activity, regulatory harmonisation around operational resilience, and cloud-native analytics are accelerating the adoption of these tools. Growing capital inflows, exemplified by private-equity stakes in niche providers, continue to expand product breadth and geographic reach. Meanwhile, insurers face mounting pressure to quantify systemic risk exposures as interconnected infrastructures amplify loss severity.[1]Travelers Companies, “Travelers Completes Acquisition of Corvus Insurance,” investors.travelers.com
Key Report Takeaways
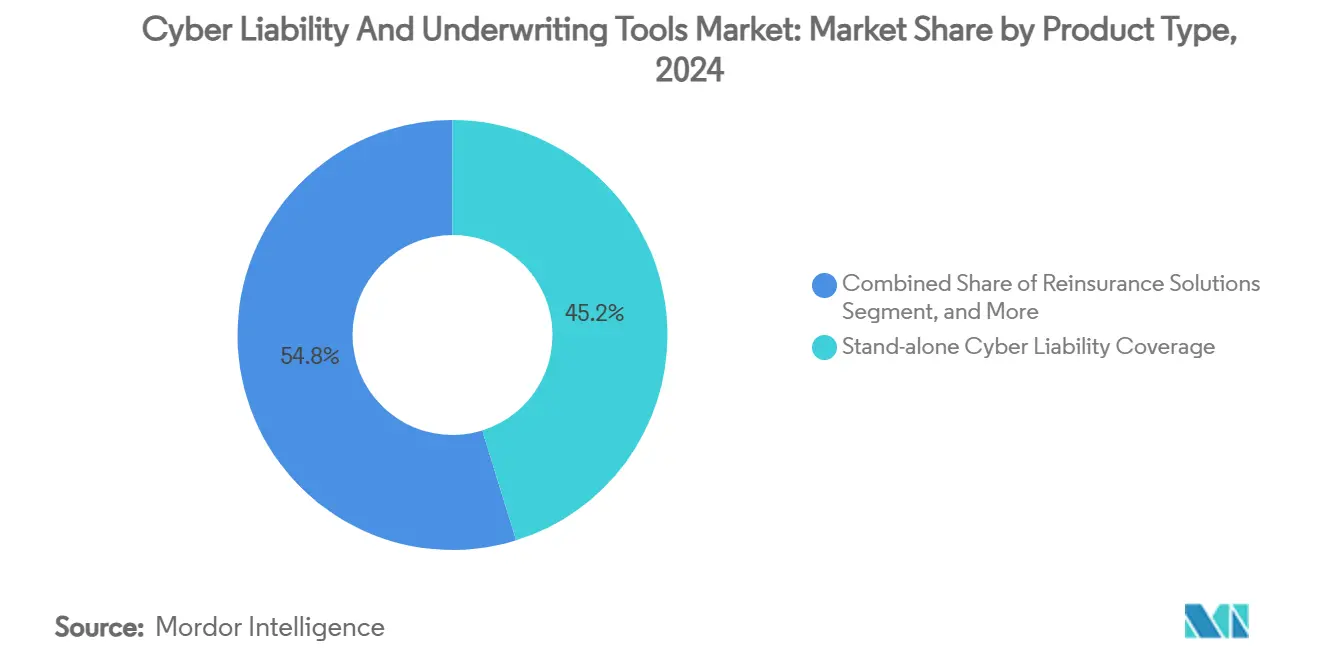
- By product type, stand-alone cyber liability coverage held 45.2% of the cyber liability and underwriting tools market share in 2024, while reinsurance solutions are projected to grow at an 18.1% CAGR through 2030.
- By underwriting tool type, risk-scoring and analytics platforms accounted for 40.8% of the cyber liability and underwriting tools market size in 2024; continuous monitoring tools are advancing at 19.2% annually to 2030.
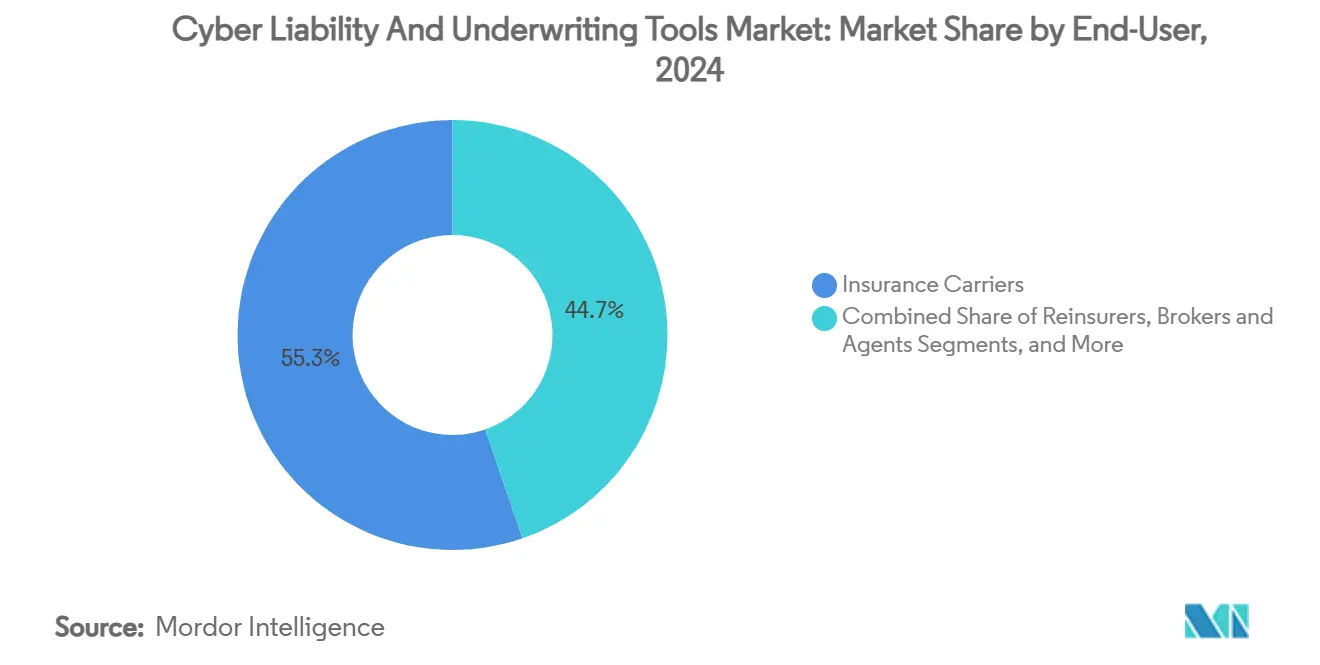
- By end-user, insurance carriers represented 55.3% of end-user demand in 2024; managing general agents exhibit the fastest projected expansion at 17.1% CAGR.
- By organization size, large enterprises with more than USD 1 billion in gross written premiums captured 48.2% of the market in 2024, whereas small and specialty insurers are growing at a 15.4% CAGR.
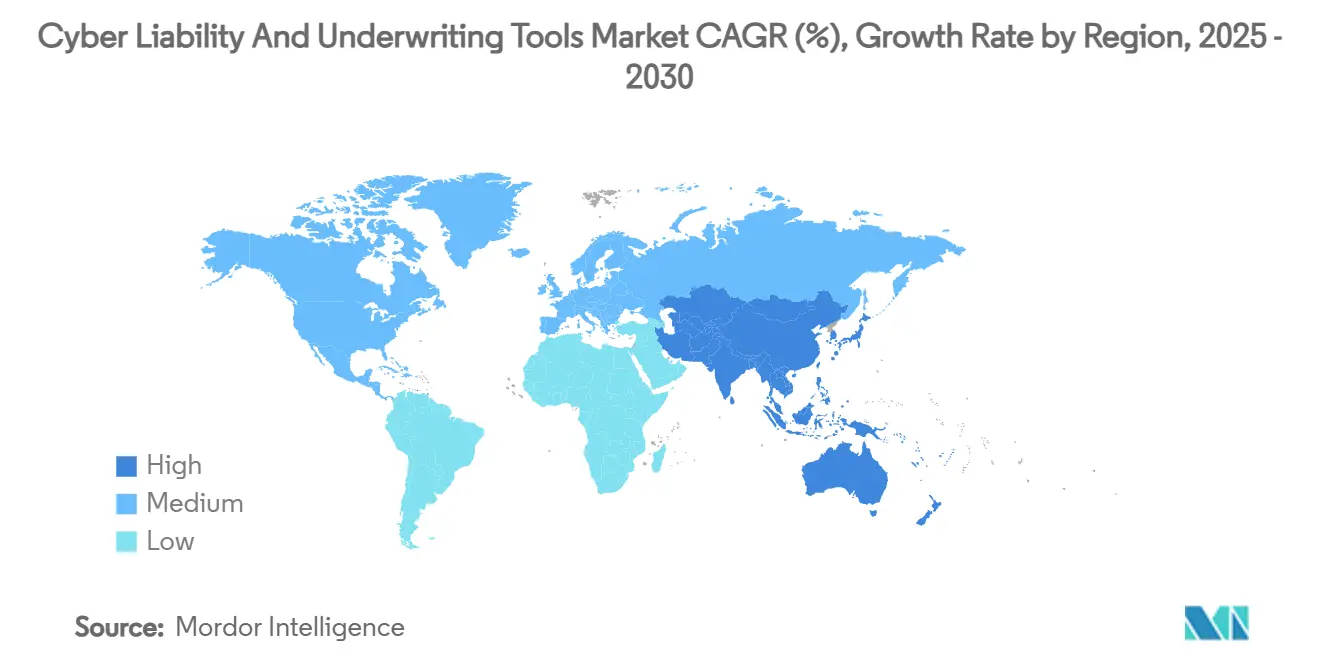
- By geography, North America commanded 62.2% revenue share in 2024, while Asia-Pacific is set to rise at a 14.5% CAGR through 2030.
Global Cyber Liability And Underwriting Tools Market Trends and Insights
Drivers Impact Analysis*
| Driver | (~) % Impact on CAGR Forecast | Geographic Relevance | Impact Timeline |
|---|---|---|---|
| Escalating frequency and severity of ransomware attacks | +3.2% | Global, with the highest impact in North America and Europe | Short term (≤ 2 years) |
| Stringent data-protection mandates (GDPR, CCPA, DORA) | +2.8% | EU and North America are primary, expanding to the Asia-Pacific | Medium term (2-4 years) |
| Growing adoption of cloud-native underwriting platforms | +2.1% | Global, led by North America and Western Europe | Medium term (2-4 years) |
| Rise of AI-driven threat-intelligence integrations | +1.9% | Global, with early adoption in developed markets | Long term (≥ 4 years) |
| Emergence of parametric and micro-cyber products | +1.4% | Asia-Pacific and emerging markets, expanding globally | Long term (≥ 4 years) |
| Monetisation of IoT/OT telemetry for cyber risk scoring | +1.1% | Industrial regions globally, led by North America and the EU | Long term (≥ 4 years) |
| Source: Mordor Intelligence | |||
Escalating Frequency and Severity of Ransomware Attacks
Ransomware affected 59% of organisations in 2024, with average incident costs reaching USD 1.85 million, prompting insurers to seek granular threat intelligence when pricing coverage. The CrowdStrike outage in July 2024 caused USD 5.4 billion in Fortune 500 losses and USD 1.5 billion in insurance payouts, exposing systemic risk concentrations.[2]Harvard Business Review, “What the 2024 CrowdStrike Glitch Can Teach Us About Cyber Risk,” hbr.org Underwriting platforms now integrate live feeds from security operations centres to calculate attack-vector probabilities. Coverage gaps—where only part of the losses are reimbursed—are steering demand toward parametric triggers that settle claims immediately. Because ransomware-as-a-service commoditises attack tools, risk models increasingly incorporate geopolitical and criminal-ecosystem indicators to capture shifting threat dynamics.
Stringent Data-Protection Mandates
The Digital Operational Resilience Act took effect in January 2025, obliging European financial entities to evidence robust ICT controls. Parallel statutes in Singapore and Malaysia extend similar accountability standards. These regulations push underwriting engines to score governance maturity, incident response readiness, and third-party oversight alongside technical controls. Harmonised compliance checklists allow platforms to normalise data across jurisdictions, reducing uncertainty for cross-border programmes. As disclosures increase, richer datasets feed actuarial models, narrowing the uncertainty bands that have historically inflated premiums.
Growing Adoption of Cloud-Native Underwriting Platforms
Cloud-native architectures let insurers ingest petabyte-scale telemetry without on-premises constraints. Google Cloud’s Risk Protection Program couples automated posture scanning with instant premium quotes, illustrating how infrastructure hosting and underwriting can converge. AIG’s CyberMatics reports real-time risk scores to corporate clients, enabling iterative remediations that feed back into pricing algorithms. Because cloud services auto-scale, carriers model accumulation risk across multi-tenant environments more precisely. Parametrix has extended this logic to cloud downtime cover, using one-hour outage triggers to deliver parametric payouts. These approaches lower friction, compress underwriting cycles, and unlock novel product structures.
Rise of AI-Driven Threat-Intelligence Integrations
Artificial-intelligence modules detect latent patterns in breach datasets and forecast loss severities. CyberCube’s Portfolio Manager Version 6 applies machine-learning classifiers to simulate catastrophic scenarios across millions of endpoints. Bitsight and Moody’s jointly analyse 325 million organisations to derive implied cyber threat scores from firmographic and telemetry inputs.[3]Bitsight, “Bitsight and Moody’s Launch New Cyber Risk Solution,” bitsight.com Insurers now extend coverage to AI-specific hazards such as data poisoning, as shown by AXA XL’s generative-AI endorsement. The challenge is balancing AI’s predictive power with its potential to create new vulnerabilities that conventional models overlook.
Restraints Impact Analysis*
| Restraint | (~) % Impact on CAGR Forecast | Geographic Relevance | Impact Timeline |
|---|---|---|---|
| Scarcity of long-tail cyber loss data for actuarial models | -2.1% | Global, most acute in emerging markets | Medium term (2-4 years) |
| High model uncertainty from rapidly evolving threat vectors | -1.8% | Global, with the highest impact in developed markets | Short term (≤ 2 years) |
| Regulatory ambiguity around "silent cyber" clauses | -1.3% | Global, particularly in jurisdictions with unclear frameworks | Medium term (2-4 years) |
| Capacity constraints and reinsurance skepticism in emerging markets | -0.9% | Asia-Pacific, Latin America, and Africa primarily | Long term (≥ 4 years) |
| Source: Mordor Intelligence | |||
Scarcity of Long-Tail Cyber Loss Data for Actuarial Models
Traditional frequency-severity methods falter when breaches manifest years after compromise. Academic studies highlight how heavy-tailed loss distributions distort capital modelling, leading to premium mispricing. Reporting lags further skew datasets, forcing underwriters to adjust for temporal bias. Because regulatory disclosures vary across jurisdictions, global portfolios suffer from inconsistent incident definitions. Platforms are experimenting with graph-based contagion models that treat cyber events like epidemiological outbreaks to capture accumulation risk more realistically.
Regulatory Ambiguity Around “Silent Cyber” Clauses
Legacy property and casualty policies often lack explicit cyber exclusions, exposing carriers to unpriced liabilities. Munich Re cautions that hidden coverages can erupt during litigation, triggering disputes over whether cyber triggers were intended. Recent court rulings have rejected broad war-exclusion interpretations, complicating policy wording. Efforts by Lloyd’s to mandate clarity are ongoing, but inconsistencies persist. Underwriting tools, therefore, embed text analytics engines to scan contract libraries and quantify silent exposures, yet uncertainty continues to suppress capacity and elevate retentions.
*Our forecasts treat driver/restraint impacts as directional, not additive. The impact forecasts reflect baseline growth, mix effects, and variable interactions.
Segment Analysis
By Product Type: Stand-Alone Coverage Dominates Amid Rising Reinsurance Innovation
Stand-alone policies secured 45.2% of the cyber liability and underwriting tools market share in 2024 as enterprises demanded dedicated protection free from sub-limits embedded in package products. Reinsurance solutions are forecast to grow at an 18.1% CAGR by 2030 because primary carriers seek capacity buffers against systemic events.
The cyber liability and underwriting tools market size for reinsurance is projected to expand steadily as carriers adopt surge stop-loss treaties and explore cyber insurance-linked securities. Instruments such as Aon’s ‘surge’ structure help stabilise loss ratios when multi-client incidents exceed threshold levels. Although capacity remains concentrated in advanced markets, innovations aimed at emerging economies are gaining traction through regional pools and specialty facultative placements.


By Underwriting Tool Type: Analytics Platforms Lead While Real-Time Monitoring Accelerates
Risk-scoring and analytics platforms contributed 40.8% of 2024 revenue, forming the analytical backbone for both carriers and MGAs. Continuous monitoring tools are expected to post a 19.2% CAGR, reflecting a pivot from periodic assessments to always-on telemetry.
Because the cyber liability and underwriting tools market size for monitoring solutions scales with each additional endpoint, vendors integrate attack-surface discovery and behavioural analytics to generate continual portfolio-level insights. Partnerships such as Liberty Mutual’s collaboration with BitSight deliver non-intrusive network ratings that refresh daily. These capabilities help underwriters pre-empt claim spikes by prompting insureds to remediate vulnerabilities before exploitation.
By End-User: Carriers Dominate While MGAs Drive Innovation
Insurance carriers represented 55.3% of spending in 2024, leveraging predictive platforms to optimise portfolio composition and manage accumulation risk. Managing general agents are projected to increase their share at a 17.1% CAGR by 2030, owing to their agility in addressing niche exposures.
The cyber liability and underwriting tools market size continues to expand as MGAs adopt white-label analytics, allowing them to differentiate through proprietary scoring while avoiding heavy infrastructure investment. Vertafore’s Surefyre acquisition bolstered low-code workflow automation, illustrating how MGAs embed rules-based decisioning that rivals carrier in-house platforms. Collaboration between Coalition and The Hartford in the United Kingdom further demonstrates how MGA innovation accelerates international expansion.
By Organisation Size: Large Enterprises Lead While Specialty Insurers Innovate
Firms with more than USD 1 billion gross written premium controlled 48.2% of revenue in 2024, underlining their resource advantage in acquiring advanced analytics platforms. Small and specialty insurers are growing at a 15.4% CAGR as cloud-based solutions level the technology playing field.
The cyber insurance underwriting tools industry benefits when nimble insurers deploy modular APIs to overlay advanced analytics atop core policy systems. QBE’s venture strategy, directing 25% of its investments into cyber-technology start-ups, exemplifies how incumbents foster innovation ecosystems. Specialty carriers gain flexibility by focusing on targeted classes such as industrial-control systems or maritime cyber, where mainstream policies often exclude bespoke exposures.
Geography Analysis
North America retained 62.2% revenue share in 2024 because of mature regulatory frameworks, deep capital markets, and high incident frequency that demands sophisticated underwriting analytics. The release of NIST Cybersecurity Framework 2.0 in February 2024 offers common control baselines that underwriting engines adopt for standardised scoring.[4]NIST, “The NIST Cybersecurity Framework 2.0 is Here,” csrc.nist.gov Competitive pressure in the region is prompting feature consolidation, illustrated by Travelers’ acquisition of Corvus for USD 435 million to blend AI-driven scoring with traditional underwriting.
Asia-Pacific is forecast to deliver a 14.5% CAGR through 2030, yet its share remains modest, pointing to significant headroom. Regulatory advances such as Singapore’s expanded Cybersecurity Act and Malaysia’s Cyber Security Act 2024 require critical infrastructure owners to evidence resilience measures, which feed directly into underwriting data models. Average premium rates in the region trail North America, suggesting that adoption curves will steepen as SMEs recognise coverage gaps.
Europe benefits from harmonised directives like DORA that took effect in 2025, compelling financial entities to conduct annual ICT stress tests. Germany’s approach emphasises continuity planning, creating demand for scenario-based analytics that quantify downtime impacts. The United Kingdom is crafting a Cyber Security and Resilience Bill to align with EU standards, signalling convergence that eases cross-border programme design. While premium volumes are lower than in North America, incident disclosure obligations generate robust datasets that sharpen actuarial accuracy.

Competitive Landscape
Competition is intensifying as insurers acquire analytics providers to secure proprietary scoring engines. The field remains moderately fragmented, yet ongoing consolidation points toward higher concentration once the headline acquisitions are digested. Travelers’ Corvus deal, completed in January 2024, allowed the acquirer to integrate dynamic risk-scoring into its middle-market offerings.
Technology partnerships are equally pivotal. Moody’s RMS allied with Bitsight to combine catastrophe modelling with external security ratings, delivering portfolio-level cyber accumulation analytics. CyberCube’s collaboration with CatX extends specialist analytics into alternative-capital marketplaces, enabling investors to benchmark cyber risks alongside natural-catastrophe perils.
White-space opportunities exist in parametric products and IoT/OT telemetry scoring. Descartes Underwriting launched a parametric cyber cover in Germany targeting SMEs, showcasing how automated triggers can shorten settlement cycles. Market entrants focusing on industrial sectors or emerging economies leverage specialisation to differentiate against full-suite providers.
Cyber Liability And Underwriting Tools Industry Leaders
CyberCube Analytics, Inc.
Guidewire Software, Inc.
BitSight Technologies, Inc.
At-Bay, Inc.
Kovrr Ltd.
- *Disclaimer: Major Players sorted in no particular order

Recent Industry Developments
- February 2025: Descartes Underwriting introduced a parametric cyber cover in Germany, delivering rapid payouts for SME interruptions.
- January 2025: Coalition added an Affirmative AI Endorsement, extending definitions to AI-related security failures.
- January 2025: DUAL Europe rolled out Cyber Active Protect, bundling insurance with prevention services for SMEs.
- January 2025: F-Secure and Allianz Partners announced a joint cybersecurity-insurance suite.


Global Cyber Liability And Underwriting Tools Market Report Scope
| Cyber Liability Insurance Policy Packages |
| Stand-alone Cyber Liability Coverage |
| Reinsurance Solutions |
| Risk Scoring and Analytics Platforms |
| Cyber Exposure Modelling Tools |
| Vulnerability Assessment and Continuous Monitoring Tools |
| Actuarial and Pricing Engines |
| Insurance Carriers |
| Reinsurers |
| Managing General Agents (MGAs) |
| Brokers and Agents |
| Large Enterprises ( > US$1 bn GWP) |
| Mid-Sized Insurers (US$100 m–US$1 bn GWP) |
| Small and Specialty Insurers ( < US$100 m GWP) |
| North America | United States | |
| Canada | ||
| Mexico | ||
| South America | Brazil | |
| Argentina | ||
| Rest of South America | ||
| Europe | United Kingdom | |
| Germany | ||
| France | ||
| Italy | ||
| Spain | ||
| Russia | ||
| Rest of Europe | ||
| Asia-Pacific | China | |
| Japan | ||
| India | ||
| South Korea | ||
| Australia | ||
| Rest of Asia-Pacific | ||
| Middle East and Africa | Middle East | Gulf Cooperation Council (GCC) |
| Turkey | ||
| Rest of Middle East | ||
| Africa | South Africa | |
| Nigeria | ||
| Rest of Africa | ||
| By Product Type | Cyber Liability Insurance Policy Packages | ||
| Stand-alone Cyber Liability Coverage | |||
| Reinsurance Solutions | |||
| By Underwriting Tool Type | Risk Scoring and Analytics Platforms | ||
| Cyber Exposure Modelling Tools | |||
| Vulnerability Assessment and Continuous Monitoring Tools | |||
| Actuarial and Pricing Engines | |||
| By End-User | Insurance Carriers | ||
| Reinsurers | |||
| Managing General Agents (MGAs) | |||
| Brokers and Agents | |||
| By Organisation Size | Large Enterprises ( > US$1 bn GWP) | ||
| Mid-Sized Insurers (US$100 m–US$1 bn GWP) | |||
| Small and Specialty Insurers ( < US$100 m GWP) | |||
| By Geography | North America | United States | |
| Canada | |||
| Mexico | |||
| South America | Brazil | ||
| Argentina | |||
| Rest of South America | |||
| Europe | United Kingdom | ||
| Germany | |||
| France | |||
| Italy | |||
| Spain | |||
| Russia | |||
| Rest of Europe | |||
| Asia-Pacific | China | ||
| Japan | |||
| India | |||
| South Korea | |||
| Australia | |||
| Rest of Asia-Pacific | |||
| Middle East and Africa | Middle East | Gulf Cooperation Council (GCC) | |
| Turkey | |||
| Rest of Middle East | |||
| Africa | South Africa | ||
| Nigeria | |||
| Rest of Africa | |||


Key Questions Answered in the Report
What is the current value of the cyber liability and underwriting tools market?
The market was valued at USD 15.66 billion in 2025 and is projected to reach USD 28.20 billion by 2030.
Which region leads the adoption of underwriting analytics?
North America held 62.2% of global revenue in 2024, benefiting from mature regulation and sophisticated threats.
Which product category is expanding fastest?
Reinsurance solutions are forecast to grow at an 18.1% CAGR through 2030 as carriers seek capacity against systemic cyber events.
How quickly are continuous monitoring tools growing?
Vulnerability assessment and continuous monitoring solutions are expected to post 19.2% annual growth to 2030.
Who are the key buyers of these tools?
Insurance carriers represent 55.3% of spending, followed by rapidly expanding managing general agents seeking specialised analytics.
What is driving Asia-Pacific growth?
Strengthening cyber regulations and accelerating digital transformation are propelling a 14.5% CAGR in the region through 2030.
Page last updated on:


