Market Overview
| Study Period | 2020 - 2031 |
|---|---|
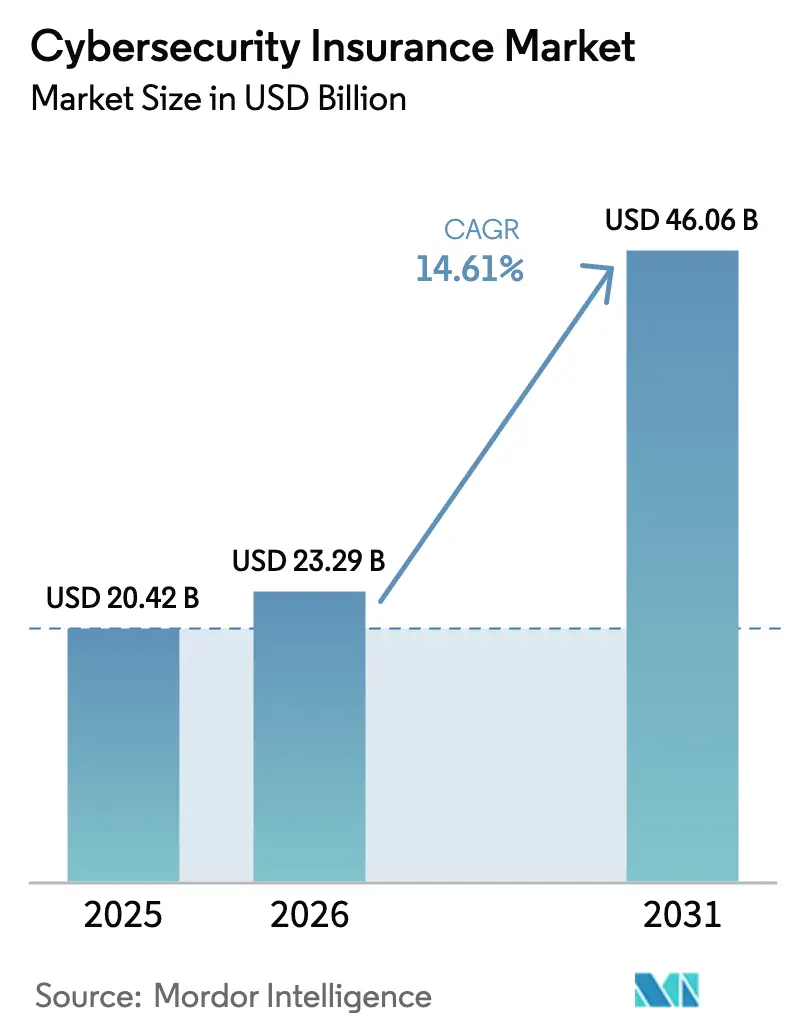
| Market Size (2026) | USD 23.29 Billion |
| Market Size (2031) | USD 46.06 Billion |
| Growth Rate (2026 - 2031) | 14.61% CAGR |
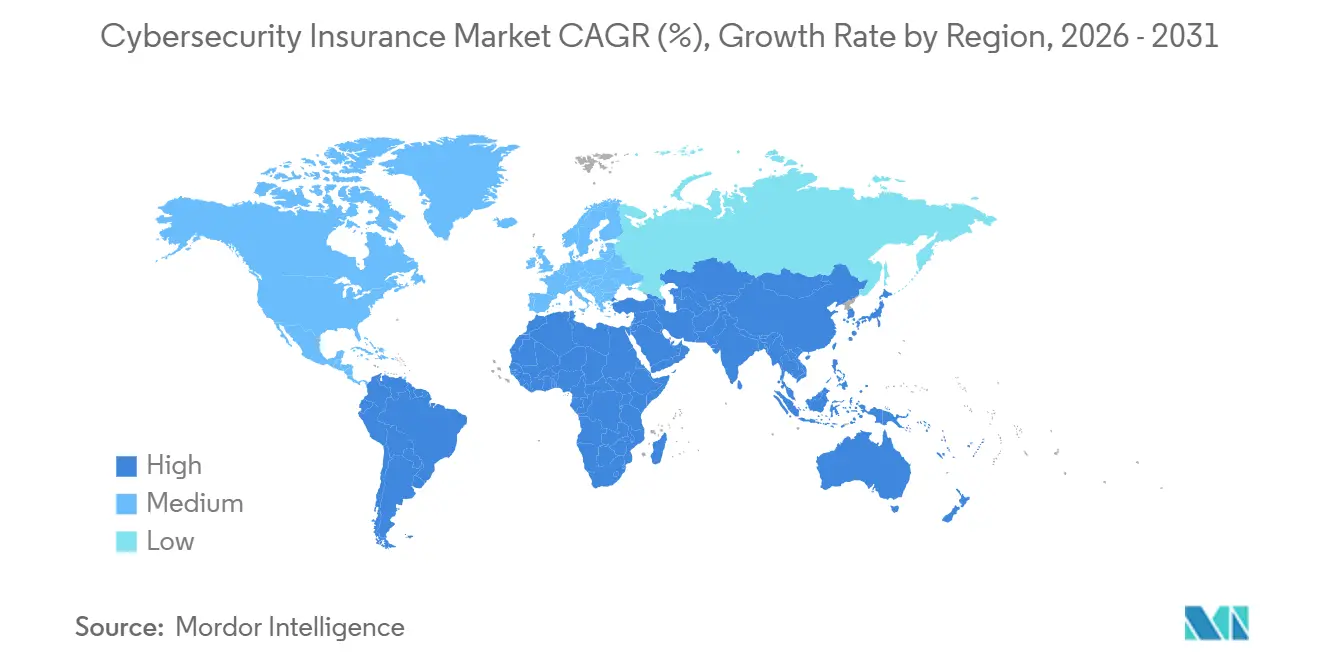
| Fastest Growing Market | Asia Pacific |
| Largest Market | North America |
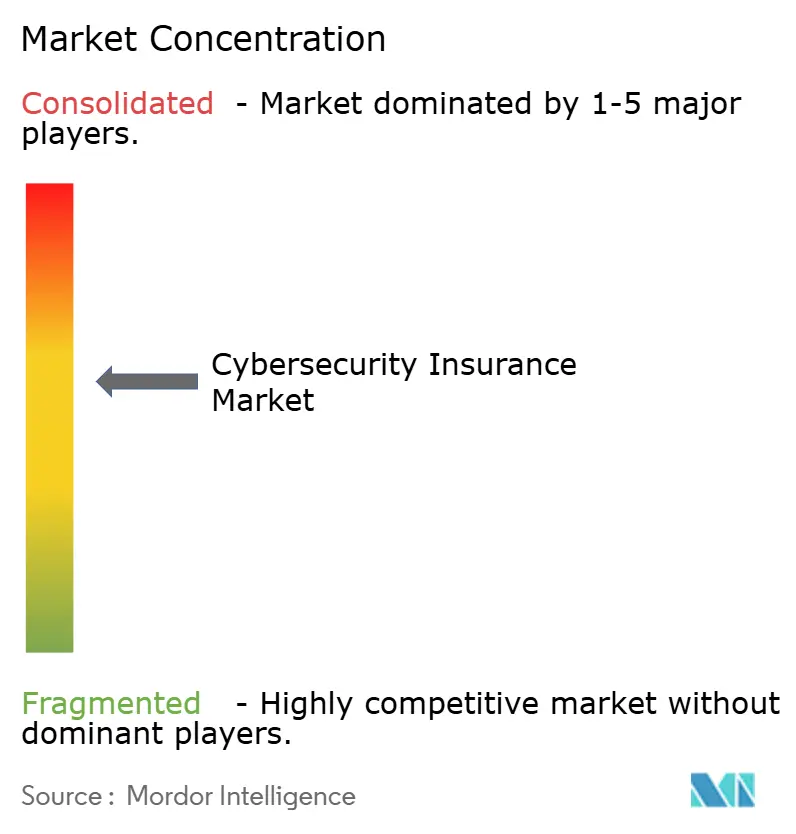
| Market Concentration | Medium |
Major Players *Disclaimer: Major Players sorted in no particular order Image © Mordor Intelligence. Reuse requires attribution under CC BY 4.0. | |
Cybersecurity Insurance Market Analysis by Mordor Intelligence
The cybersecurity insurance market size is projected to be USD 20.42 billion in 2025, USD 23.29 billion in 2026, and reach USD 46.06 billion by 2031, growing at a CAGR of 14.61% from 2026 to 2031. Premium rate moderation, wider regulatory coverage requirements, and growing board-level demand for quantified cyber-risk transfer are reinforcing demand momentum. Capacity is expanding, yet underwriting discipline remains tight as carriers reserve capital for sectors with concentrated systemic exposure. The shift from indemnity-only offerings toward integrated InsurSec models is compressing loss ratios because embedded controls lower claim severity. Growth prospects also benefit from parametric innovation that shortens claims cycles and attracts under-served small and medium enterprises, particularly in Asia-Pacific where new data-protection statutes are raising minimum coverage limits.
Key Report Takeaways
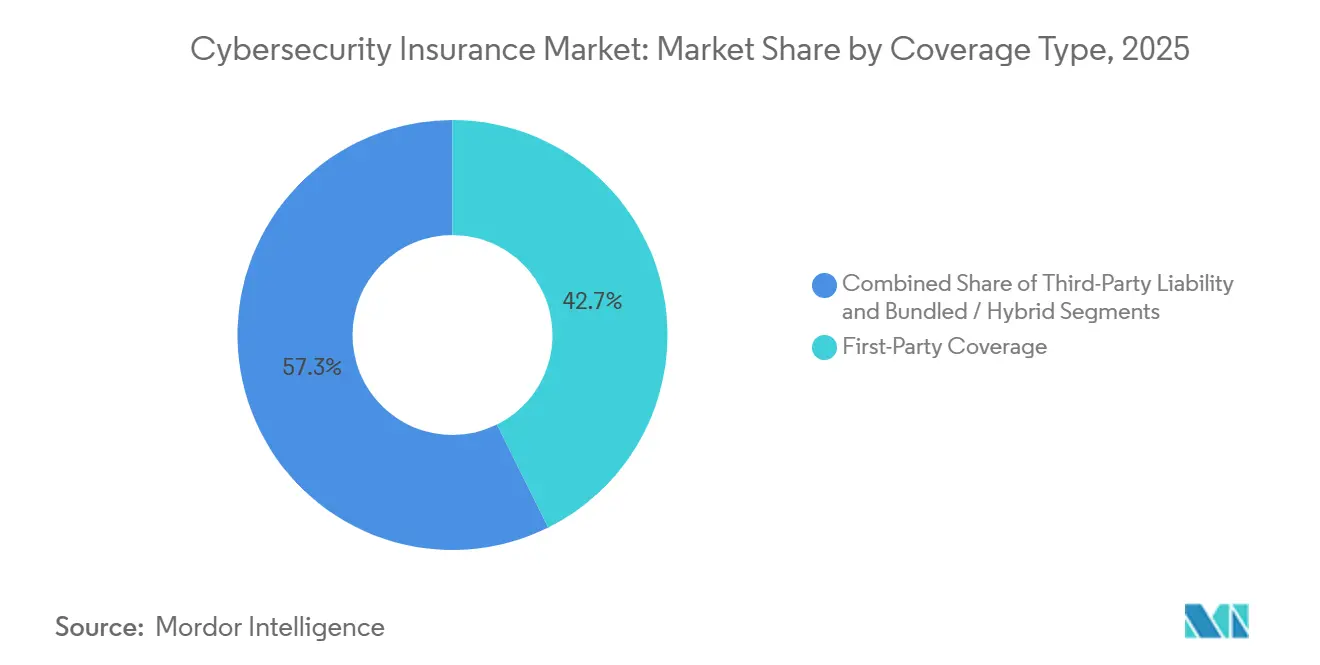
- By coverage type, first-party protection led with 42.66% of 2025 premiums, while third-party liability is advancing at a 15.32% CAGR through 2031.
- By insurance type, stand-alone policies held 53.17% share of the 2025 cybersecurity insurance market size and are growing at a 15.72% CAGR to 2031.
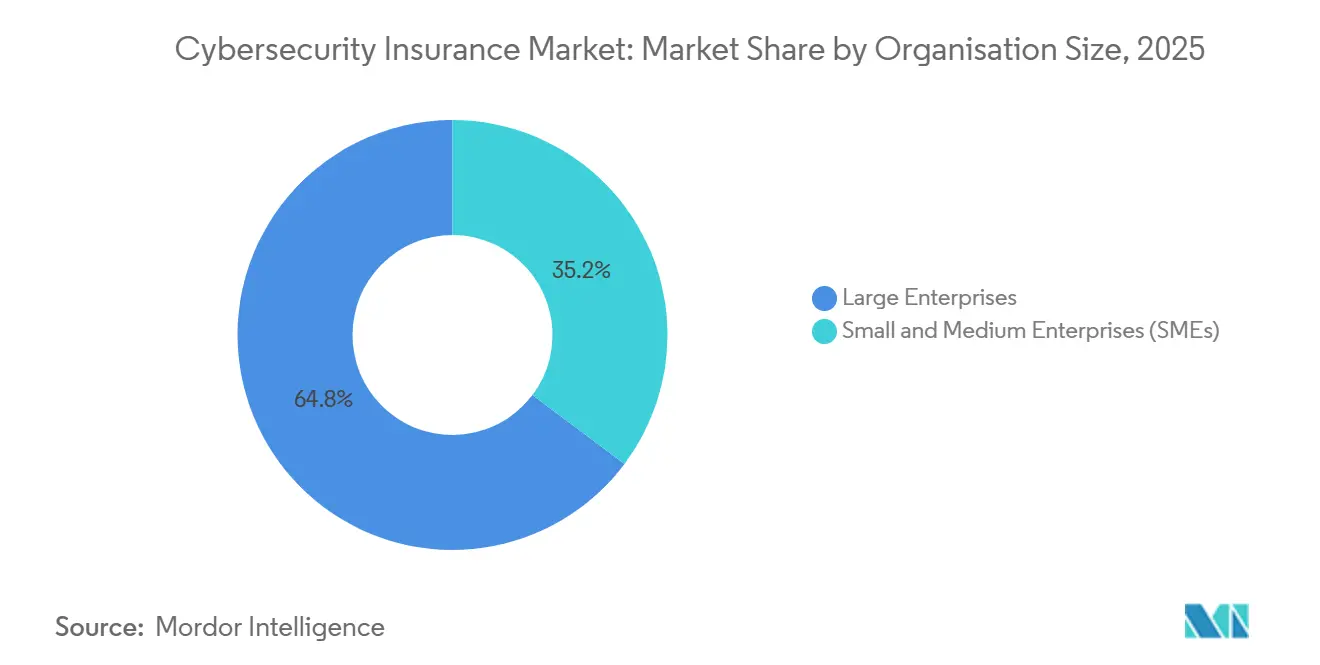
- By organization size, large enterprises captured 64.77% of premiums in 2025, yet the SME segment is projected to grow fastest at a 15.69% CAGR between 2026-2031.
- By end-user industry, banking, financial services and insurance accounted for 28.86% of 2025 demand, whereas manufacturing is forecast to expand at a 16.03% CAGR through 2031.
- By geography, North America commanded 39.66% of 2025 global premiums, while Asia-Pacific is expected to post the highest regional growth with a 16.12% CAGR during 2026-2031.
Note: Market size and forecast figures in this report are generated using Mordor Intelligence’s proprietary estimation framework, updated with the latest available data and insights as of January 2026.
Global Cybersecurity Insurance Market Trends and Insights
Drivers Impact Analysis*
| Driver | (~) % Impact on CAGR Forecast | Geographic Relevance | Impact Timeline |
|---|---|---|---|
| Cloud-First Digitalization Upsizes Cyber-Loss Exposure | +3.2% | Global, with concentration in North America, Europe, and Asia-Pacific | Medium term (2-4 years) |
| Escalating Regulatory Mandates (GDPR, NY DFS, DORA, SEC Rules) | +2.8% | Europe and North America lead; Asia-Pacific adoption accelerating | Short term (≤ 2 years) |
| Board-Level Focus on Quantifying Cyber Risk | +1.9% | North America and Europe, expanding to Asia-Pacific financial hubs | Medium term (2-4 years) |
| SME-Focused Low-Cost Parametric Covers Emerging | +1.5% | Global, with early traction in North America and Western Europe | Long term (≥ 4 years) |
| InsurSec Models Bundling Security Services and Cover | +1.3% | North America and Europe, pilot programs in Asia-Pacific | Medium term (2-4 years) |
| Tokenized Cyber ILS Attracting New Capacity | +0.9% | Bermuda, London, Singapore as domiciles; global investor base | Long term (≥ 4 years) |
| Source: Mordor Intelligence | |||


Cloud-First Digitalization Upsizes Cyber-Loss Exposure
Rapid migration to multi-tenant cloud platforms has widened breach pathways through misconfigured storage, compromised service accounts, and lateral movement between tenants. The February 2024 ransomware strike on Change Healthcare, which generated USD 2.3 billion in direct and business-interruption costs, showed how a single service disruption can ripple through critical U.S. healthcare workflows.[1]U.S. Securities and Exchange Commission, “UnitedHealth Group Form 10-Q,” SEC.gov Insurers now demand multi-factor authentication, privileged-access controls, and immutable backups before binding coverage, and many apply sub-limits to cloud-service-provider outages. Demand for first-party business-interruption extensions is therefore rising because a cloud outage can paralyze geographically dispersed operations within hours. These technical prerequisites are tightening selection standards even as headline capacity grows, thereby preserving profitability while sustaining policy uptake among cloud-heavy enterprises.
Escalating Regulatory Mandates (GDPR, NY DFS, DORA, SEC Rules)
Harmonized resilience laws are transforming cybersecurity insurance from discretionary spending into a compliance instrument. The Digital Operational Resilience Act, effective January 2025, obliges more than 20,000 EU financial entities to test cyber-resilience annually and disclose incidents within strict timelines.[2]EUR-Lex, “Regulation (EU) 2022/2554 on Digital Operational Resilience for the Financial Sector,” eur-lex.europa.eu New York’s 2023 DFS amendment compels large financial firms to certify cybersecurity programs and imposes penalties of up to USD 1,000 per day for non-compliance.[3]New York State Department of Financial Services, “Cybersecurity Requirements for Financial Services Companies,” dfs.ny.gov Parallel disclosure rules from the U.S. SEC require listed companies to announce material incidents within four business days and describe board oversight, embedding cyber-risk reporting in fiduciary duty. Together these statutes elevate baseline coverage limits, particularly for third-party fines and legal defense, thereby lifting overall premium volume.
Board-Level Focus on Quantifying Cyber Risk
Shareholder litigation over post-breach oversight failures has pushed directors to measure cyber risk alongside credit and operational hazards. The new SEC rules oblige issuers to identify board members with cybersecurity expertise, which has increased demand for actuarial evidence that coverage aligns with stated risk appetite. Advisory frameworks translate technical vulnerabilities into value-at-risk metrics, enabling boards to benchmark insurable loss tails. Insurers are capitalizing by offering bundled cyber-risk assessments that validate governance structures. Policies now feature tiered premiums that reward organizations demonstrating annual loss expectancy reductions documented through verified security-score improvements. As a result, underwriters can segment applicants more accurately and avoid adverse selection.
SME-Focused Low-Cost Parametric Covers Emerging
Traditional questionnaires, high deductibles, and six-week underwriting cycles historically excluded many SMEs. Parametric covers solve these frictions by paying preset limits when a qualifying event is verified by trusted data feeds, independent of loss proofs. Coalition’s entry-level product, marketed at USD 500 per year for firms with less than USD 5 million in revenue, bundles automated vulnerability scanning and phishing simulations that help lower incident frequency. Claims settle in hours rather than weeks because smart contracts release funds once a trigger is validated, improving liquidity for cash-constrained firms. The feedback loop between continuous posture monitoring and premium adjustments further reduces moral hazard, which is boosting insurer confidence to scale penetration in the under-insured SME segment.
Restraints Impact Analysis*
| Restraint | (~) % Impact on CAGR Forecast | Geographic Relevance | Impact Timeline |
|---|---|---|---|
| Actuarial Data Scarcity and Modeling Uncertainty | -2.1% | Global, acute in emerging markets with limited claims history | Medium term (2-4 years) |
| High Premium and Retention Levels Deter SMEs | -1.8% | North America and Europe, where pricing hardened 2020-2023 | Short term (≤ 2 years) |
| Contractual War and Systemic-Risk Exclusions | -1.3% | Global, with heightened scrutiny in Europe post-Ukraine conflict | Long term (≥ 4 years) |
| Reinsurance Capacity Caps for Critical-Infrastructure Risks | -1.0% | North America and Europe, affecting energy, utilities, transport sectors | Medium term (2-4 years) |
| Source: Mordor Intelligence | |||
Actuarial Data Scarcity and Modeling Uncertainty
Attack vectors mutate faster than loss data accumulates, undermining classical actuarial techniques. The 2021 Kaseya ransomware campaign spread through managed-service providers and harmed more than 1,500 downstream clients, showing how a zero-day exploit can distort correlation assumptions overnight. Carriers react by capping per-event aggregates, excluding incidents tied to unpatched vulnerabilities older than 30 days, and charging steep additional premiums for undefended remote-desktop ports. Fragmented breach-reporting laws outside Europe and North America suppress accurate frequency statistics, inflating pricing buffers against modeling error and delaying expansion in jurisdictions lacking transparent notification regimes.
High Premium and Retention Levels Deter SMEs
Although average global prices fell 11% during 2025, many SMEs still confront deductibles exceeding annual information-technology budgets. A 2024 NAIC survey found that 58% of small U.S. firms declined coverage because median premiums of USD 2,400 for USD 1 million in limits and retentions of USD 25,000 eclipsed expected loss values. Hard-market legacies also mean insurers selectively retreat from high-risk classes, forcing remaining buyers into costly self-insured layers. This adverse selection concentrates loss experience within a shrinking risk pool, pushing rates back up and throttling growth potential in the mass SME segment unless parametric innovation scales quickly.
*Our forecasts treat driver/restraint impacts as directional, not additive. The impact forecasts reflect baseline growth, mix effects, and variable interactions.
Segment Analysis
By Coverage Type: Liability Surge Outpaces First-Party Growth
Third-party liability coverage is projected to outstrip first-party demand at a 15.32% CAGR through 2031 as privacy fines and class actions proliferate under stringent statutes such as Illinois’s Biometric Information Privacy Act. First-party protection, which commanded 42.66% of cybersecurity insurance market share in 2025, remains foundational for funding incident response, business-interruption, and ransom outlays but is maturing in North America and Europe where attachment points keep rising. Growing reliance on operational technology in healthcare and manufacturing multiplies direct-loss scenarios, so insurers are adding sub-limits for cloud-outage or equipment-recalibration costs, sustaining incremental demand even as pricing moderates.
Litigation risk from regulatory fines under the EU GDPR, which allows sanctions up to 4% of global turnover, is propelling uptake of defense and settlement towers, especially among international platforms that process data across member states. Hybrid products that consolidate both loss types under unified limits help multinationals avoid allocation disputes when a ransom payment morphs into class-action liability. This hybridization stabilizes combined ratios by ensuring balanced premium inflows across frequency-prone first-party and severity-heavy liability claims, keeping the cybersecurity insurance market attractive for reinsurers.


By Insurance Type: Stand-Alone Policies Dominate Amid Silent-Cyber Disputes
Stand-alone contracts captured 53.17% of global premiums in 2025 and are accelerating at 15.72% as risk managers decouple cyber perils from property and casualty covers to secure clearer wording. The NotPetya disputes that followed Zurich’s denial of Mondelez’s USD 100 million property claim highlighted ambiguity in “all-risk” forms and spurred demand for bespoke language that overrides war exclusions. Dedicated policies now integrate granular warranties such as mandatory multifactor authentication and 30-day patching windows, which general-liability endorsements rarely enforce.
Packaged extensions retain relevance for micro-enterprises where price sensitivity trumps coverage breadth, yet many carriers have removed ransomware, social engineering, and business-interruption protections from these endorsements. Continuous-scanning offerings like Coalition’s active-insurance model reinforce the stand-alone preference by giving insureds real-time visibility into external attack surfaces and allowing underwriters to amend terms mid-policy when high-risk vulnerabilities appear. This dynamic underpins sustainable growth in the cybersecurity insurance market size for stand-alone products.
By Organization Size: SME Segment Accelerates on Parametric Innovation
Large enterprises controlled 64.77% of the 2025 cybersecurity insurance market size because they purchase high limits often USD 100 million or more and must comply with DORA, SEC, and NY DFS frameworks. Growth, however, is shifting to SMEs, projected to climb 15.69% as parametric solutions compress acquisition costs while offering rapid liquidity. Cowbell Cyber uses external signals such as SSL validity and patch cadence to price risks within minutes, trimming broker commissions and underwriting hours. Lower fixed expenses enable sub-USD 1,000 annual premiums that broaden affordability.
Large accounts still renew multi-layered programs but face constrained capacity for systemic events. Many are accepting co-insurance clauses or higher retentions, capping their contribution to future cybersecurity insurance market share expansion. SMEs meanwhile value simplified triggers that bypass forensic disputes, and they respond quickly to premium incentives that reward improved security hygiene, driving faster unit growth.
By End-User Industry: Manufacturing Leads Growth Amid OT Convergence
Manufacturing is poised to record a 16.03% CAGR through 2031, reflecting convergence between information-technology and operational-technology networks. The disruption wrought by ransomware on industrial lines, as demonstrated in the Colonial Pipeline incident, elevates both direct production downtime and cascading supply-chain costs. Insurers are tailoring endorsements that reimburse equipment recalibration, spoilage, and safety-system recertification, thereby aligning policy structures with real-world loss scenarios.
Banking, financial services, and insurance retained the largest 2025 share at 28.86% because EU DORA testing mandates, U.S. GLBA updates, and Asia-Pacific privacy laws impose compulsory cyber-resilience audits. The sector’s mature governance underpins predictable loss development, allowing carriers to deploy meaningful capacity at stable rates. Nonetheless, margin expansion is migrating to industrial verticals where insurance penetration is low and digitalization is surging, supporting sustained growth in the cybersecurity insurance market.
Geography Analysis
North America generated 39.66% of global premiums in 2025, anchored by pervasive disclosure laws and a litigious environment that magnifies third-party settlement values. SEC rules obliging public issuers to report incidents within four business days standardize claims timelines and improve model accuracy. Canada’s 2024 breach-notification amendments have harmonized cross-border requirements, making regional programs easier to structure. Yet saturation among Fortune 500 buyers is tempering volume growth, directing carrier focus toward middle-market firms and municipalities.
Asia-Pacific is expected to log the fastest expansion at 16.12% through 2031, propelled by China’s Personal Information Protection Law and India’s CERT-In six-hour incident-report directive, both of which compel multinational companies to arrange local-admitted policies. Singapore and Hong Kong regulators now encourage cyber insurance as part of operational-risk capital planning for banks, while Australia’s revised Security of Critical Infrastructure Act imposes 12-hour outage reporting and heavy penalties for non-compliance, driving uptake in telecom and energy sectors. Low historical claims data still suppresses capacity, but carriers are partnering with regional reinsurers to share accumulation risk.
Europe’s trajectory is shaped by DORA, which forces financial entities to test resilience triennially and hold boards accountable for cyber oversight. Germany’s BaFin now links capital reserves to measured exposure, nudging banks toward third-party transfer. Lloyd’s war-exclusion clause LMA5565, introduced in 2023, excludes state-sponsored operations and has driven European buyers to negotiate carve-backs or secure supplemental political-risk covers. South America, the Middle East and Africa remain nascent; while the United Arab Emirates and Saudi Arabia have national cyber-security mandates, local underwriting capacity remains thin, opening space for parametric, fronted, or reinsurance-backed solutions to seed market development.

Competitive Landscape
The market has a moderately concentrated structure that balances scale efficiencies with room for new entrants. Established players such as American International Group, Chubb, and Beazley leverage two decades of claims data to refine pricing algorithms, but their broker-centric distribution raises acquisition costs relative to digital attackers. InsurTech leaders Coalition and Cowbell Cyber differentiate through continuous scanning, real-time risk scoring, and parametric triggers, enabling sub-24-hour binding for SMEs and compressing expense ratios.
Strategic differentiation is migrating toward InsurSec bundles that fuse endpoint detection, incident-response retainers, and insurance into a single subscription. Beazley’s partnership with Coveware, which has cut average ransom payments by 30%, exemplifies how proactive security services reduce ultimate loss severity. Reinsurance capacity remains selective, particularly for critical-infrastructure exposures after Lloyd’s introduced cyber-war exclusions, but tokenized insurance-linked securities approved by Bermuda in 2024 are attracting pension and sovereign wealth funds, injecting alternative capital streams.
Competitive pressure is most acute in the middle-market and parametric niches, where automated underwriting and direct-to-customer portals erode broker commissions. Traditional carriers respond by piloting AI-assisted submissions, launching agile parametric products for supply-chain events, and acquiring stakes in cyber-risk quantification platforms to enrich modeling inputs. Although price competition is intensifying, disciplined capacity deployment and technology-driven loss prevention are sustaining combined ratios below 90%, keeping the cybersecurity insurance market profitable for innovators and incumbents alike.
Cybersecurity Insurance Industry Leaders
AXA XL
Chubb Limited
Beazley plc
Allianz Global Corporate and Specialty
American International Group (AIG)
- *Disclaimer: Major Players sorted in no particular order

Recent Industry Developments
- February 2026: Coalition announced a partnership with Microsoft to ingest Azure Active Directory telemetry, enabling real-time premium credits for robust identity controls.
- January 2026: Beazley launched a United Kingdom parametric ransomware product that pays within 48 hours once specified strains are detected, with a limit of GBP 250,000 (USD 318,000) per event.
- November 2025: AXA XL opened a Singapore underwriting hub with USD 500 million in dedicated limits for financial institutions responding to stricter MAS tech-risk guidelines.
- September 2025: Zurich Insurance Group bought a minority stake in Safe Security to integrate its cyber-risk quantification score into underwriting.


Research Methodology Framework and Report Scope
Market Definitions and Key Coverage
Our study defines the cyber-security insurance market as gross written premiums generated worldwide from stand-alone or packaged policies that indemnify organizations for first-party losses and third-party liabilities arising from cyber events, including ransomware, data breaches, and business interruption. According to Mordor Intelligence, the model captures carriers, captives, and managing general agents that actively underwrite these risks.
(Scope exclusion) Personal cyber cover sold to individuals and any re-insurance transfers are left outside this assessment.
Segmentation Overview
- By Coverage Type
- First-Party Coverage
- Third-Party Liability
- Bundled / Hybrid
- By Insurance Type
- Stand-Alone Cyber
- Packaged / Endorsement
- By Organisation Size
- Small and Medium Enterprises (SMEs)
- Large Enterprises
- By End-User Industry
- BFSI
- Healthcare
- Retail and E-Commerce
- IT and Telecom
- Manufacturing
- Government and Public Sector
- Other End-User Industries
- By Geography
- North America
- United States
- Canada
- Mexico
- South America
- Brazil
- Argentina
- Rest of South America
- Europe
- United Kingdom
- Germany
- France
- Sweden
- Rest of Europe
- Asia-Pacific
- China
- Japan
- India
- Australia
- South Korea
- Rest of Asia-Pacific
- Middle East and Africa
- Middle East
- Saudi Arabia
- United Arab Emirates
- Turkey
- Rest of Middle East
- Africa
- South Africa
- Nigeria
- Rest of Africa
- Middle East
- North America
Detailed Research Methodology and Data Validation
Primary Research
Mordor analysts spoke with underwriters, brokers, risk managers, and cyber-security consultants across North America, Europe, and Asia-Pacific. These conversations clarified typical policy limits, retention trends, and how ransomware severity is reshaping pricing, thereby filling data gaps and validating desk inputs.
Desk Research
We mapped the universe of cyber-risk policies through regulator filings and open datasets such as NAIC statutory statements, EIOPA Solvency II disclosures, and Lloyd's syndicate results, which offer premium volume, claims ratios, and geographic splits. Industry associations, such as the Geneva Association and the Association of British Insurers, supplemented these with take-up rates and loss-event bulletins. Financials and strategic moves of leading carriers were screened on D&B Hoovers, while news flow on pricing cycles and large claims was tracked on Dow Jones Factiva. This list illustrates, not exhausts, our secondary groundwork.
Market-Sizing & Forecasting
A top-down build begins with 2024 national premium pools reported by regulators, then adjusts for exchange rates and missing territories before segmenting by coverage type and industry. Bottom-up cross-checks, carrier roll-ups, sampled average premium × policy counts, and broker channel checks calibrate totals. Key variables in our multivariate regression forecast include corporate cyberattack frequency, average ransom paid, policy take-up among SMEs, regulatory mandates coming into force, and median premium rate movements. Scenario envelopes were stress-tested and outliers reconciled through expert re-interviews.
Data Validation & Update Cycle
Every draft runs through anomaly screens, peer review, and senior analyst sign-off. Models refresh annually; interim updates trigger when quarterly filings or major loss events shift fundamentals.
Why Mordor's Cybersecurity Insurance Baseline Commands Reliability
Published estimates often diverge because firms choose different premium pools, policy mixes, and update cadences.
Key gap drivers include whether small packaged endorsements are counted, how currency conversions are timed, and if future premium rate softening is factored or ignored. Mordor's scope aligns with regulator definitions, applies live FX rates, and revisits rate assumptions with brokers each quarter, which explains the contrast shown below.
Benchmark comparison
| Market Size | Anonymized source | Primary gap driver |
|---|---|---|
| USD 20.42 B (2025) | Mordor Intelligence | - |
| USD 16.54 B (2025) | Global Consultancy A | Excludes micro-enterprise packaged covers; uses 2023 FX averages |
| USD 20.88 B (2024) | Industry Research House B | Projects premiums before regulator revisions; limited SME sampling |
| USD 21.67 B (2025) | Trade Journal C | Applies higher assumed rate hikes and omits carrier self-retention |
These comparisons show that once scope and rate assumptions are normalized, Mordor's balanced baseline remains the most transparent and repeatable reference for strategic decision-making.


Key Questions Answered in the Report
How fast is the cybersecurity insurance market expected to grow through 2031?
The market is forecast to grow at a 14.61% CAGR between 2026 and 2031, nearly doubling from USD 23.29 billion in 2026 to USD 46.06 billion by 2031.
Which segment currently holds the largest cybersecurity insurance market share?
Stand-alone cyber policies lead with 53.17% of 2025 premium, reflecting buyer preference for clear wording and dedicated limits.
Why are SMEs increasingly purchasing cyber coverage?
Parametric products priced from USD 500 annually and streamlined underwriting platforms now offer fast claims payments, making coverage affordable for under-resourced SMEs.
Which region will post the fastest growth?
Asia-Pacific is projected to expand at a 16.12% CAGR through 2031 due to stringent new data-protection mandates in China, India, Japan, and Australia.
What is driving demand in the manufacturing sector?
Integration of operational-technology with IT systems heightens ransomware exposure, and dedicated endorsements covering recalibration and spoilage are fueling a 16.03% CAGR.
How are insurers addressing systemic cyber-catastrophe risk?
Carriers are tightening sub-limits, partnering with reinsurers, and issuing tokenized cyber catastrophe bonds that transfer correlated loss tails to capital-markets investors.
Page last updated on:


