Plant Activators Market Size and Share
Market Overview
| Study Period | 2020 - 2030 |
|---|---|
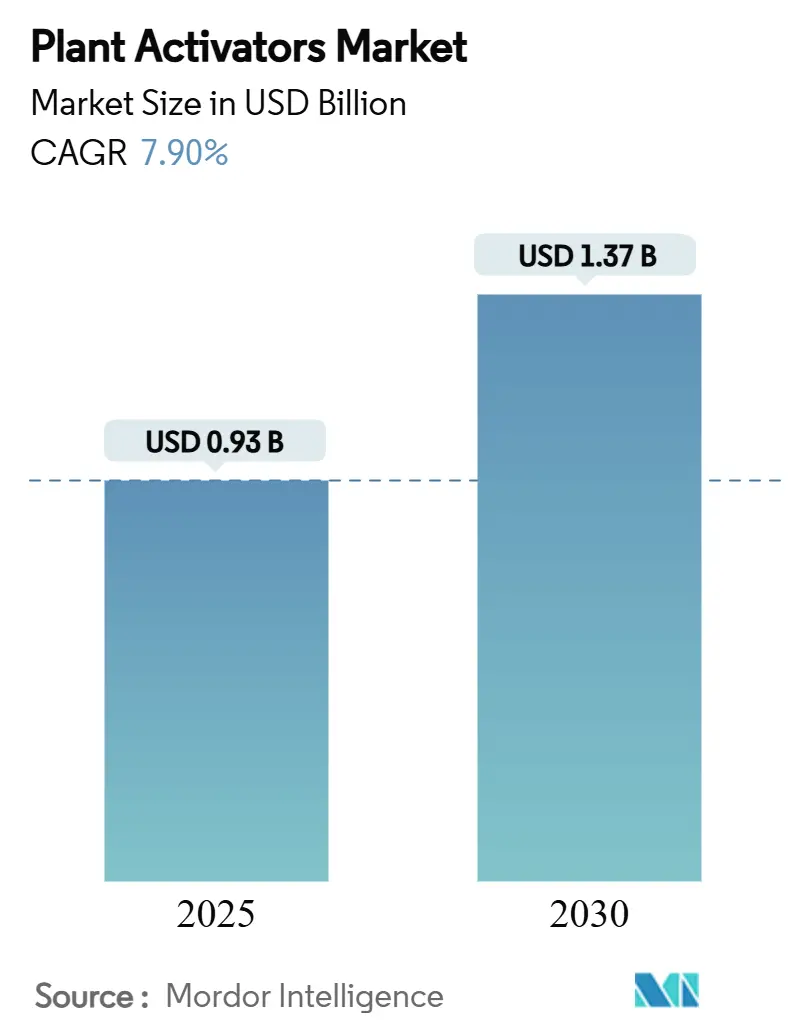
| Market Size (2025) | USD 0.93 Billion |
| Market Size (2030) | USD 1.37 Billion |
| Growth Rate (2025 - 2030) | 7.90% CAGR |
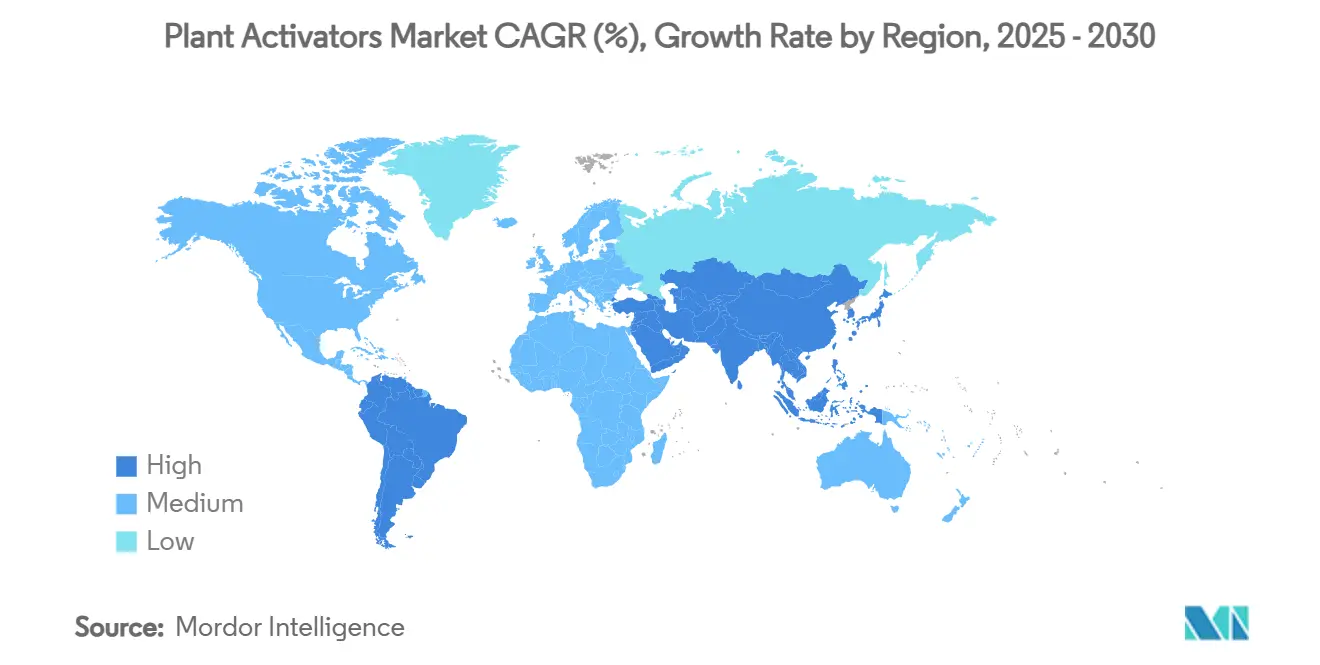
| Fastest Growing Market | Asia Pacific |
| Largest Market | Europe |
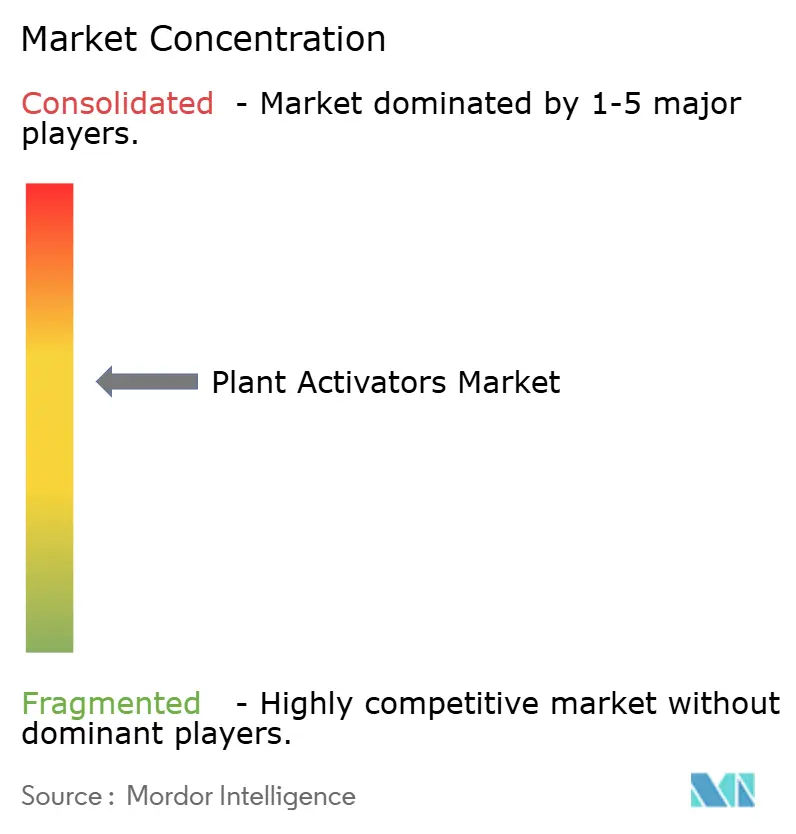
| Market Concentration | Medium |
Major Players
*Disclaimer: Major Players sorted in no particular order Image © Mordor Intelligence. Reuse requires attribution under CC BY 4.0. |
|
Plant Activators Market Analysis by Mordor Intelligence
The plant activators market size stands at USD 0.93 billion in 2025 and is forecast to advance to USD 1.37 billion by 2030, reflecting a 7.9% CAGR over the period. Growing zero-residue demands, regulatory momentum for biological inputs, and the embedding of activators into precision agriculture systems are the principal forces behind this trajectory. Europe maintains leadership as the European Union pushes a 50% cut in chemical pesticide use[1]Source: European Commission, "Farm to Fork Strategy," ec.europa.eu., while Asia-Pacific accelerates on the back of controlled-environment horticulture in China and India. Biological sources, liquid formulations, and foliar applications converge to form the dominant solution set adopted by large farms and greenhouse operators. Market leaders enhance portfolios through biotechnology partnerships, even as supply bottlenecks in specialty bio-actives and micro-climate efficacy gaps remain material challenges for growth.
Key Report Takeaways
- By product type, resistance inducers held 41% of the plant activators market share in 2024, while signaling molecules are set to grow at 11.8% CAGR through 2030.
- By source, biological solutions accounted for a 59% share of the plant activators market size in 2024 and are projected to expand at a 12.4% CAGR through 2030.
- By mode of application, foliar spray commanded a 62% share in 2024, while seed treatment is projected to post the fastest growth rate of 8.3% CAGR.
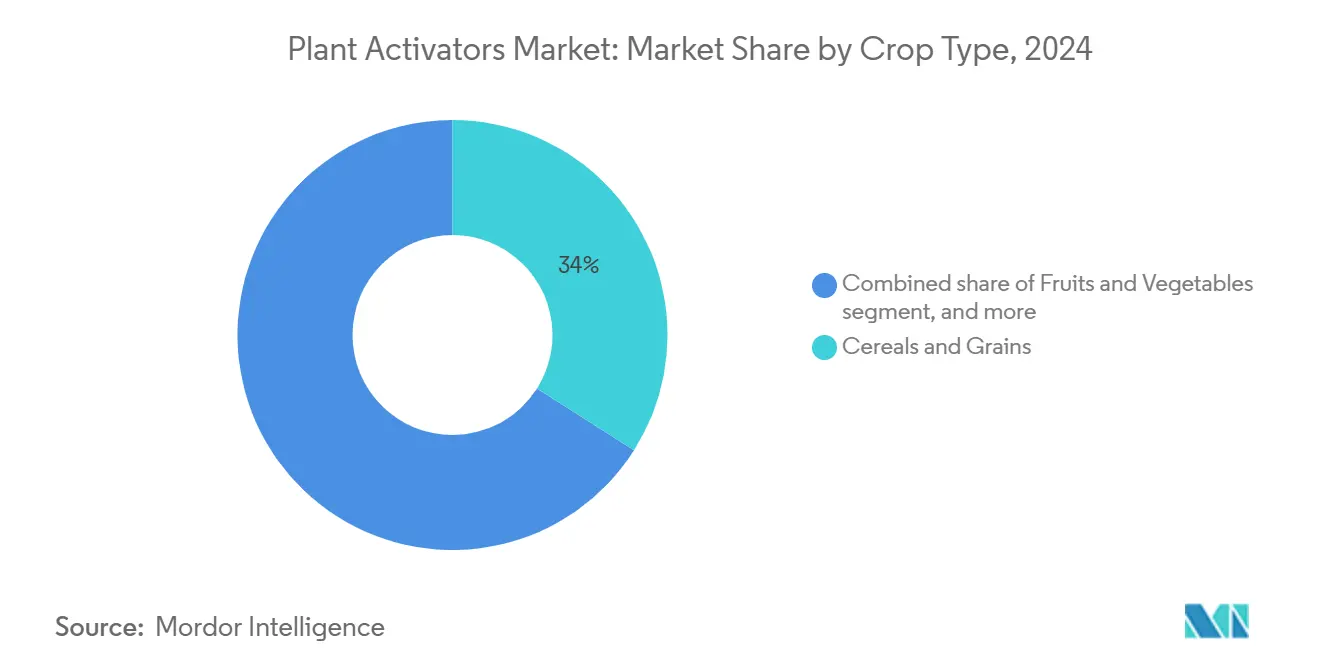
- By crop type, cereals and grains captured 34% of the plant activators market revenue in 2024, whereas fruits and vegetables are projected to rise at a 9.8% CAGR through 2030.
- By formulation, liquid products accounted for 68% of the plant activators market in 2024 and are forecast to grow at a 11.2% CAGR.
- By geography, Europe led with the largest regional share of 35% in 2024, and the Asia-Pacific region is anticipated to deliver a 9.8% CAGR, the highest among all regions.
- Syngenta Group, BASF SE, Bayer AG, UPL Limited, and Sumitomo Chemical Co., Ltd control 68% of the plant activators market. This indicates moderate market concentration due to the presence of these major global companies.
Global Plant Activators Market Trends and Insights
Drivers Impact Analysis*
| Driver | (~) % Impact on CAGR Forecast | Geographic Relevance | Impact Timeline |
|---|---|---|---|
| Surge in demand for residue-free produce | +2.10% | Global, with strongest impact in North America and Europe | Medium term (2-4 years) |
| Regulatory push for biological crop inputs | +1.80% | Europe and North America primarily, expanding to Asia-Pacific | Long term (≥ 4 years) |
| Adoption of integrated pest-management programs | +1.50% | Global, with early adoption in developed markets | Medium term (2-4 years) |
| Rapid expansion of greenhouse horticulture | +1.20% | Asia-Pacific core, spillover to Middle East and North America | Short term (≤ 2 years) |
| Emerging RNA-based plant immunity boosters | +0.80% | North America and Europe, with R&D spillover globally | Long term (≥ 4 years) |
| Carbon-credit monetization for reduced pesticide load | +0.50% | North America and South America, expanding to Europe | Medium term (2-4 years) |
| Source: Mordor Intelligence | |||
Surge in Demand for Residue-Free Produce
Supermarket chains now enforce zero-residue policies that make biological protection a procurement prerequisite. Retailers such as Walmart and Carrefour require suppliers to deliver produce free of detectable pesticide residues, prompting growers to switch to activators that trigger endogenous crop defenses. Premium market segments reward compliant growers with 15–25% price uplifts. Federal approvals of Bacillus subtilis strain BU1814 and Bacillus velezensis strain 11604 for tolerance exemptions underscore the regulatory rationale that favors residue-free inputs[2]Source: U.S. Environmental Protection Agency, "40 CFR 180.1348 -- Bacillus subtilis strain BU1814; exemption from the requirement of a tolerance," ecfr.gov.. The commercial incentive is amplified as retailers internalize reputational risk tied to residue violations.
Regulatory Push for Biological Crop Inputs
Government agencies streamline biological registrations while tightening restrictions on conventional pesticides. The United States Environmental Protection Agency (EPA) issued over 20 biological tolerance exemptions in 2024, including Brevibacillus laterosporus proteins and killed Myrothecium verrucaria applications[3]Source: U.S. Environmental Protection Agency, "Brevibacillus Laterosporus Mpp75Aa1.1 and Bacillus Thuringiensis Vpb4Da2 Proteins; Exemptions From the Requirement of a Tolerance," federalregister.gov.. In parallel, Europe’s twenty-third Adaptation to Technical Progress cuts approval timelines for qualifying biologicals from up to five years to roughly two. Such regulatory arbitrage lets suppliers accelerate product launches across multiple regions.
Adoption of Integrated Pest-Management Programs
United States Department of Agriculture (USDA) guidelines now incorporate plant activators as core IPM inputs, helping farms cut synthetic pesticide use by up to 40% while sustaining yields. Certification schemes including GlobalGAP and USDA Organic increasingly cite activators as preferred tools, opening market access for compliant growers. Insurance providers respond by lowering premiums for biological-lean portfolios, creating an economic feedback loop that moves activators from optional to standard practice.
Rapid Expansion of Greenhouse Horticulture
Controlled-environment agriculture expanded 12% in 2024, especially in China, Japan, and emerging Middle East complexes. Closed systems amplify humidity-driven pathogen pressure, driving demand for activators that work without jeopardizing the tight environmental controls greenhouses rely on. Automated fertigation systems deliver near-instant uptake, with application efficiency reaching 90% compared with open-field systems. Capital-intensive greenhouses, which generate revenues 10–15 times higher per square meter than field farms, justify premium biological inputs that protect high-value crops.
Restraints Impact Analysis*
| Restraint | (~) % Impact on CAGR Forecast | Geographic Relevance | Impact Timeline |
|---|---|---|---|
| Product-efficacy variability across micro-climates | -1.40% | Global, with highest impact in tropical and subtropical regions | Short term (≤ 2 years) |
| Limited farmer awareness in developing nations | -1.10% | Asia-Pacific, Africa, and South America primarily | Medium term (2-4 years) |
| Stringent multi-regional registration costs | -0.90% | Global, with highest barriers in Europe and North America | Long term (≥ 4 years) |
| Supply bottlenecks for specialty bio-actives | -0.60% | Global, with manufacturing concentrated in North America and Europe | Medium term (2-4 years) |
| Source: Mordor Intelligence | |||
Product-Efficacy Variability Across Micro-Climates
Field trials reveal that harpin proteins fluctuate in effectiveness by up to 60% under high humidity and ultraviolet stress, undermining farmer confidence. Tropical climates magnify this variability as temperatures and pH swing widely throughout the season. Manufacturers invest in protective coatings and protein engineering to stabilize actives, but such R&D increases costs. Until climate-adaptive formulations mature, adoption will lag in equatorial regions.
Limited Farmer Awareness in Developing Nations
Smallholders often lack technical knowledge on timing, dosage, and compatibility of activators with existing farm practices. Limited extension services and language barriers restrict training reach, while scant demonstration plots slow peer-to-peer diffusion. Although India’s 26 million-hectare organic farming target incorporates activator use, ground-level execution remains uneven, stalling uptake across vast rural markets.
*Our forecasts treat driver/restraint impacts as directional, not additive. The impact forecasts reflect baseline growth, mix effects, and variable interactions.
Segment Analysis
By Product Type: From Broad Resistance to Precision Signaling
Resistance inducers accounted for 41% of the plant activators market share in 2024, a position anchored by proven systemic acquired resistance pathways that guard against diverse pathogens. The segment benefits from decades of field validation across various crops, including cereals, fruits, and vegetables. Signaling molecules, however, are projected to register an 11.8% CAGR through 2030 as growers shift toward precision tools that trigger targeted defense with minimal energy drain on the crop.
The rapid uptake of signaling molecules reflects a shift among growers toward customized biological interventions. GreenLight Biosciences and similar firms demonstrate commercial viability for RNA-based products, channeling 25–30% of industry R&D budgets toward molecular signaling. These products integrate smoothly with soil microbiomes, preserving beneficial organisms that synthetic fungicides often harm. Field data show yield gains remain stable even as chemical inputs decline, reinforcing the economic appeal. Continuous regulatory support for molecular actives accelerates pipeline throughput, making signaling molecules the technology frontier that could redefine portfolio mixes in the plant activators market.


By Source: Biological Products Take Center Stage
Biological plant activators secured 59% market share in 2024 and are forecast to grow at a 12.4% CAGR, reflecting regulatory priority and consumer trust. Quicker approvals and lower residue concerns offer clear commercial advantages over synthetic counterparts, as they fulfill niche requirements in harsh environments.
Advances in precision fermentation now produce complex biological molecules at costs 60–70% below traditional extraction. Yet global fermenter capacity supports only a fraction of projected demand, requiring substantial investment. Partnerships between agrochemical majors and biotechnology specialists aim to scale facilities and alleviate bottlenecks. In parallel, synthetic products enhance stability and shelf life in extreme climates, preserving a market foothold where biological performance is compromised.
By Mode of Application: Foliar Spray Dominates, Seed Treatment Emerges
Foliar spray accounted for 62% of segment revenues in 2024, due to its seamless compatibility with existing boom sprayers and rapid plant uptake. Soil treatments are valued for sustained release but constrained by timing sensitivities. Seed treatment is projected to expand at the fastest rate, with an 8.3% CAGR through 2030, as coating technologies enable early-stage protection at lower overall input volumes.
The plant activators market evolves in tandem with precision agriculture tools that optimize placement and minimize waste. Seed treatments merge with high-accuracy planters, reducing field passes and drift. Soil applications gain from sensory data that pinpoint pathogen hotspots, while nano-delivery systems promise 40–50% higher uptake efficiencies. Each mode answers distinct agronomic and environmental goals, ensuring a diversified application mix.
By Crop Type: Staple Acres Lead, Specialty Crops Accelerate
Cereals and grains contributed 34% to the plant activators market size in 2024, driven by the vast acreage of wheat, corn, and rice. Programmed reductions in synthetic pesticides across staple crops cement a volume base for activators. Fruits and vegetables, while smaller in land footprint, will climb at 9.8% CAGR, buoyed by premium pricing for residue-free produce and the concentration of high-value crops in greenhouses. Turf and ornamentals remain niche yet lucrative segments that landscape managers pursue under strict environmental regulations.
Price premiums on organic strawberries or greenhouse tomatoes offset elevated biological input costs, lifting specialty adoption rates above staple averages. Conversely, broad-acre cereals push suppliers to engineer bulk formulations that deliver cost per hectare parity with chemicals. This dynamic shapes R&D agendas and marketing strategies across the plant activators market.
By Formulation: Liquids Rule but Dry Products Retain Niche
Liquid products dominated the market with a 68% share in 2024 and are projected to grow at a CAGR of 11.2%. This growth is attributed to their high bioavailability and compatibility with tank mixing systems. Stabilization advances now keep 90% activity for up to two years when stored correctly, significantly reducing waste. Dry products excel in terms of transport efficiency and long shelf life, but require on-farm mixing procedures that deter some growers. Concentrated suspensions close the logistics gap, delivering high active loads without sacrificing stability.
The surge in fertigation and drip irrigation systems further tips the scale toward liquids, as these infrastructures deliver precise doses directly to the rhizosphere. Yet arid regions with limited water availability still prefer dry granules that integrate with existing fertilizer flows. Both formats will coexist, each optimized for local agronomic realities.
Geography Analysis
Europe held the largest share of 35% of the plant activators market in 2024, driven by the European Union's Farm-to-Fork strategy, which requires a 50% reduction in chemical pesticide use by 2030. Germany, France, and Spain operate subsidy programs for biological inputs, which have led to increased adoption across row crops and vineyards.
The Asia-Pacific region is set to register the fastest 9.8% CAGR. China and India accelerate controlled-environment agriculture and export-driven horticulture, both of which rely on residue-free certification. Government extension networks promote biological adoption to safeguard water and soil health while meeting the rising expectations for domestic food safety. Fermentation capacity investments position the region to emerge as a manufacturing hub for activators, shortening supply chains and reducing imports.
North America advances at a steady growth. The United States Environmental Protection Agency maintains a transparent process for biological approvals, supporting the commercial rollout of these products. The United States Department of Agriculture's integrated pest-management guidelines formally include activators, directly influencing large corn and soybean growers. Canada’s updates to organic standards and specialty crop programs widen the market scope, especially in greenhouse vegetables and fruit orchards.

Competitive Landscape
The plant activators market shows moderate consolidation, with five major companies, including Syngenta Group, BASF SE, Bayer AG, UPL Limited, and Sumitomo Chemical Co., Ltd, holding a combined market share of 68%. These firms leverage global distribution, regulatory resources, and established farmer relationships to reinforce leadership positions. Strategic collaborations with biotechnology startups fill innovation gaps, as evidenced by Syngenta Group's alliances with Intrinsyx Bio and Lavie Bio aimed at accessing novel microbial actives.
Technology adoption emphasizes precision fermentation and synthetic biology. The Environmental Protection Agency's (EPA) 2024 tolerance exemptions for Bacillus subtilis and Brevibacillus laterosporus proteins validate these platforms and lower entry barriers for firms that can efficiently navigate the dossiers. Mid-tier players differentiate themselves through delivery innovations, such as nano-emulsions and seed-coating polymers, tailored to microclimates.
White-space opportunities persist in controlled-environment agriculture, organic acreage, and underserved emerging markets. Supply chain resilience and cost optimization remain crucial factors as fermentation capacity expands and competition intensifies, putting pressure on margins. Overall, the market presents scope for both consolidation and disruptive entry.
Plant Activators Industry Leaders
-
BASF SE
-
Bayer AG
-
UPL Limited
-
Sumitomo Chemical Co., Ltd
-
Syngenta Group
- *Disclaimer: Major Players sorted in no particular order

Recent Industry Developments
- April 2025: ICL Group Ltd. completed the acquisition of Lavie Bio Ltd.'s operations from Evogene Ltd., strengthening its biological solutions portfolio through plant microbiome technologies. This acquisition expanded ICL's capabilities in microbial-based solutions.
- February 2025: Acadian Plant Health launched its comprehensive Abiotic Stress Management portfolio, featuring advanced seaweed-derived plant activators designed for climate-resilient agriculture.
- December 2024: Bayer secured an exclusive license for bioinsecticide technology from AlphaBio Control, expanding its biological crop protection portfolio with novel insect control mechanisms. This licensing agreement demonstrates the company's commitment to building comprehensive biological solutions that complement its plant activator offerings.
- November 2024: Elicit Plant secured EUR 45 million (USD 48 million) in Series B funding to accelerate its United States market expansion and scale production of its plant immunity activator technology.


Global Plant Activators Market Report Scope
The Plant Activators Market Report is Segmented by Product Type (Resistance Inducers, and More), by Source (Biological and Synthetic), by Mode of Application (Foliar Spray, Soil Treatment and Seed Treatment), by Crop Type (Cereals and Grains, Fruits and Vegetables, and More), by Formulation (Liquid and Dry), and by Geography (North America, South America, Europe, and More). The Market Forecasts are Provided in Terms of Value (USD).
| Resistance Inducers |
| Signaling Molecules |
| Others |
| Biological |
| Synthetic |
| Foliar Spray |
| Soil Treatment |
| Seed Treatment |
| Cereals and Grains |
| Fruits and Vegetables |
| Oilseeds and Pulses |
| Turf and Ornamentals |
| Others |
| Liquid |
| Dry |
| North America | United States |
| Canada | |
| Mexico | |
| Rest of North America | |
| South America | Brazil |
| Argentina | |
| Rest of South America | |
| Europe | Germany |
| France | |
| Spain | |
| Russia | |
| Rest of Europe | |
| Asia-Pacific | China |
| India | |
| Japan | |
| Australia | |
| Rest of Asia-Pacific | |
| Middle East | Saudi Arabia |
| United Arab Emirates | |
| Rest of Middle East | |
| Africa | South Africa |
| Egypt | |
| Rest of Africa |
| By Product Type | Resistance Inducers | |
| Signaling Molecules | ||
| Others | ||
| By Source | Biological | |
| Synthetic | ||
| By Mode of Application | Foliar Spray | |
| Soil Treatment | ||
| Seed Treatment | ||
| By Crop Type | Cereals and Grains | |
| Fruits and Vegetables | ||
| Oilseeds and Pulses | ||
| Turf and Ornamentals | ||
| Others | ||
| By Formulation | Liquid | |
| Dry | ||
| By Geography | North America | United States |
| Canada | ||
| Mexico | ||
| Rest of North America | ||
| South America | Brazil | |
| Argentina | ||
| Rest of South America | ||
| Europe | Germany | |
| France | ||
| Spain | ||
| Russia | ||
| Rest of Europe | ||
| Asia-Pacific | China | |
| India | ||
| Japan | ||
| Australia | ||
| Rest of Asia-Pacific | ||
| Middle East | Saudi Arabia | |
| United Arab Emirates | ||
| Rest of Middle East | ||
| Africa | South Africa | |
| Egypt | ||
| Rest of Africa | ||


Key Questions Answered in the Report
What is the current value of the plant activators market?
The plant activators market size is USD 0.93 billion in 2025.
How fast will the market grow over the next five years?
The market is forecast to expand at a 7.9% CAGR and reach USD 1.37 billion by 2030.
Which product category shows the strongest growth potential?
Signaling molecules will grow at 11.8% CAGR, the fastest among product types.
Why are biological plant activators gaining preference over synthetic ones?
Expedited approvals, residue-free consumer demands, and compatibility with precision farming drive a 12.4% CAGR for biological solutions.
Page last updated on:


