Herbicide Market Size and Share
Market Overview
| Study Period | 2018 - 2031 |
|---|---|
| Market Size (2026) | USD 47.31 Billion |
| Market Size (2031) | USD 60.09 Billion |
| Growth Rate (2026 - 2031) | 4.90% CAGR |
| Fastest Growing Market | Asia Pacific |
| Largest Market | South America |
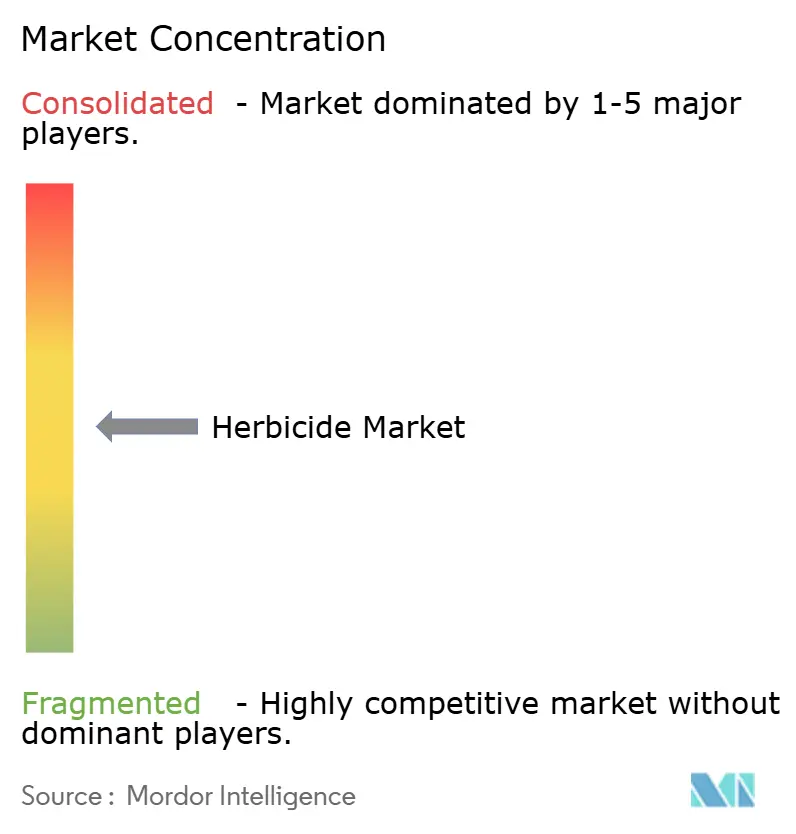
| Market Concentration | Medium |
Major Players *Disclaimer: Major Players sorted in no particular order Image © Mordor Intelligence. Reuse requires attribution under CC BY 4.0. | |
Herbicide Market Analysis by Mordor Intelligence
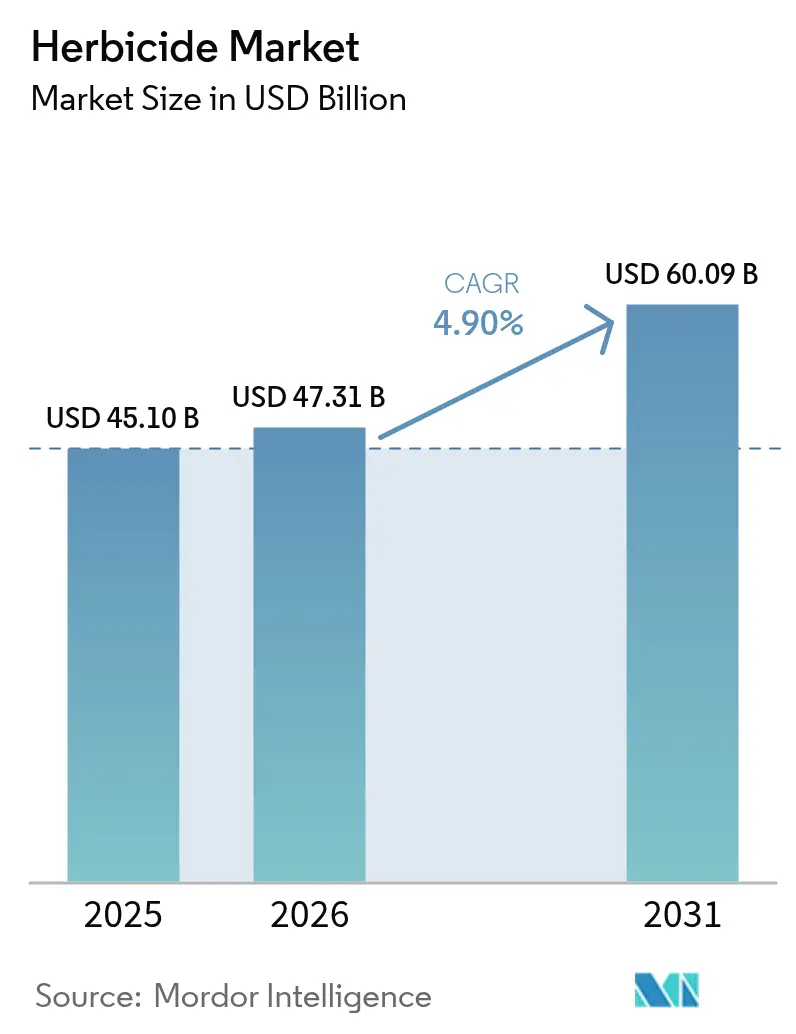
The herbicide market size is expected to grow from USD 45.10 billion in 2025 to USD 47.31 billion in 2026 and is forecast to reach USD 60.09 billion by 2031 at 4.90% CAGR over 2026-2031. The market expansion is propelled by the sustained demand for chemical weed control, as agricultural producers address a 50% increase in global food requirements by 2050 while managing constraints on available arable land. According to the United States Department of Agriculture, weeds can diminish crop yields by 20-40% without effective herbicide applications, underscoring the significance of advanced formulations and integrated application methods[1]Source: United States Department of Agriculture, “Crop Production Topics,” usda.gov. The market advancement is reinforced by the widespread adoption of herbicide-tolerant seed traits, conservation tillage practices, and regulatory approval of low-drift, nano-encapsulated products that minimize environmental impact. Industry consolidation has enhanced research and development capabilities, facilitating the innovation of new active ingredients while expanding the portfolio of herbicide-resistant molecules that complement conventional chemical herbicides.
Key Report Takeaways
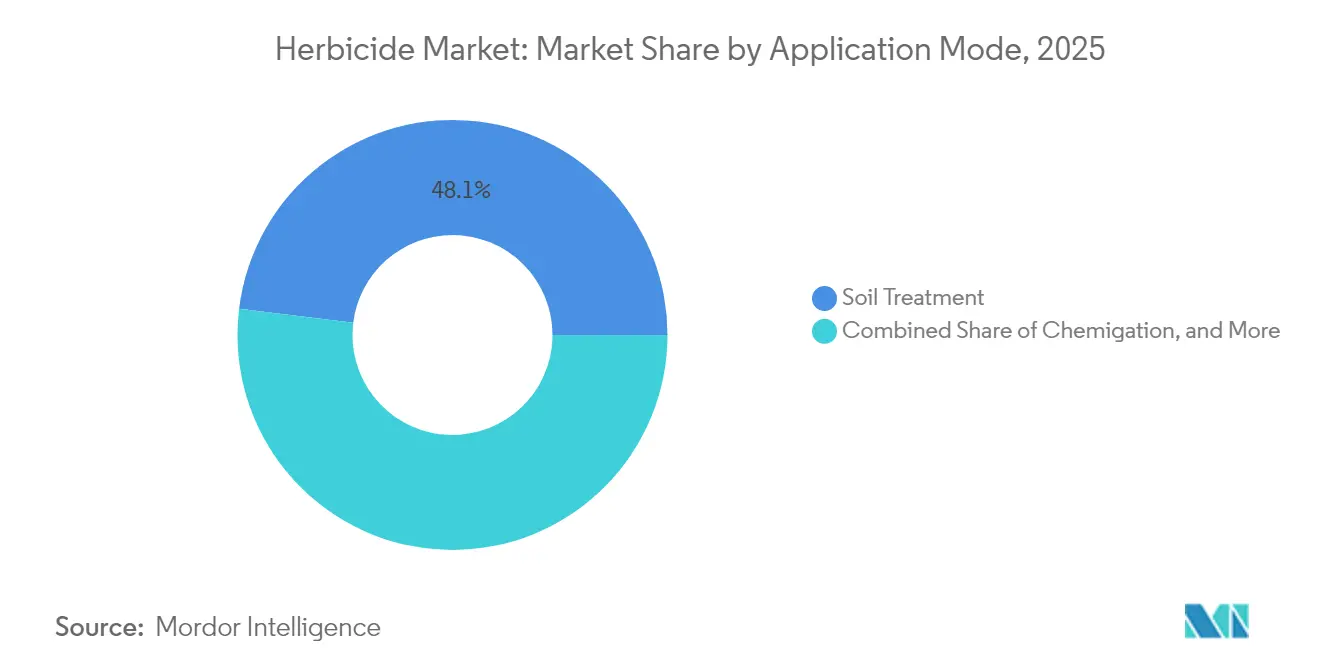
- By application mode, soil treatment led with 48.05% of herbicide market share in 2025 and is poised to expand at a 5.22% CAGR through 2031.
- By crop type, grains and cereals accounted for a 43.72% share of the herbicide market size in 2025 and are projected to advance at a 5.09% CAGR during the same period.
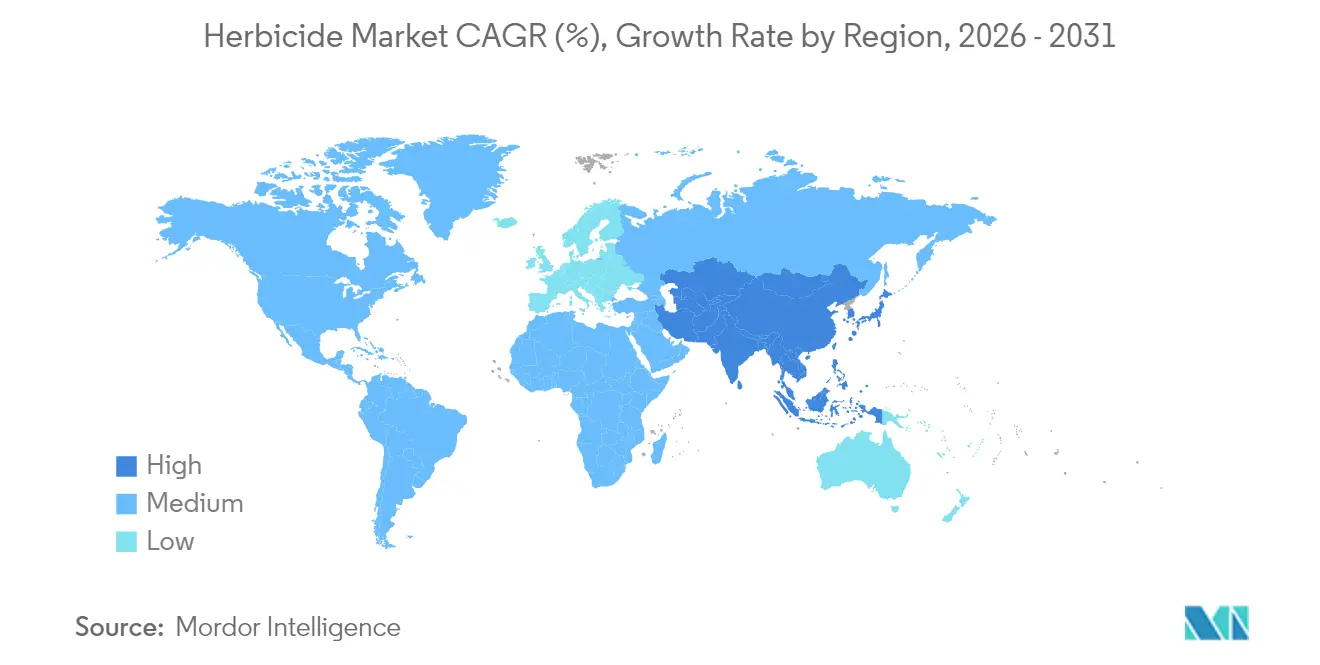
- By geography, South America accounted for 42.15% of the market revenue in 2025, while the Asia-Pacific region is forecast to grow at a CAGR of 5.85% through 2031.
Note: Market size and forecast figures in this report are generated using Mordor Intelligence’s proprietary estimation framework, updated with the latest available data and insights as of 2026.
Global Herbicide Market Trends and Insights
Drivers Impact Analysis*
| Driver | (~) % Impact on CAGR Forecast | Geographic Relevance | Impact Timeline |
|---|---|---|---|
| Growing global food demand and yield pressure | +1.0% | Global with highest impact in Asia-Pacific and Sub-Saharan Africa | Long term (≥ 4 years) |
| Drone-based precision spraying uptake | +0.7% | North America and Europe core, expanding to Asia-Pacific | Medium term (2-4 years) |
| Increasing weed pressure and evolving challenges | +0.6% | Global, most acute in grain belts | Short term (≤ 2 years) |
| Regulatory push for low-drift nano-formulations | +0.5% | North America and EU with spillover to emerging markets | Medium term (2-4 years) |
| Adoption of no-till and reduced-till systems | +0.4% | North America, South America, and Australia core | Long term (≥ 4 years) |
| Subscription-based weed-control service models | +0.2% | North America and Europe, early phase | Medium term (2-4 year |
| Source: Mordor Intelligence | |||


Growing Global Food Demand and Yield Pressure
The projected global population growth to 9.7 billion by 2050 is compelling agricultural producers to increase productivity from existing farmland, with herbicides remaining essential for large-scale mechanized farming operations[2]Source: United Nations Department of Economic and Social Affairs, “World Population Prospects 2019,” un.org. Governments across China, India, and various African countries are implementing input-subsidy programs and mechanization initiatives that integrate selective herbicides into their food security strategies. International grain purchasers implement strict quality standards that discourage weed contamination, encouraging farmers to use residual herbicide treatments. Additionally, seed companies integrate herbicide-tolerant traits with high-yield germplasm, linking chemical usage to seed advancements. The integration of precision agriculture systems, combining variable-rate application with remote monitoring, validates these adoption trends by demonstrating immediate economic benefits. These factors contribute to sustained herbicide market growth as agricultural producers work to meet both productivity requirements and environmental regulations.
Drone-Based Precision Spraying Uptake
Agricultural drone fleets increased from 1.2 million units in 2020 to 4.5 million units in 2024, driven by improvements in battery technology and relaxed beyond-visual-line-of-sight regulations in major markets[3]Source: Federal Aviation Administration, “Commercial Operators,” faa.gov. Drones reduced blanket spraying through precise weed mapping at the centimeter level, enabling decreased chemical usage while improving control effectiveness in specialty crops and fragmented fields. Chemical companies developed lower-volume, higher-concentration active ingredients compatible with drone payload capacities, creating a new premium segment in the herbicide market. Service providers offer fleet leasing to medium-sized farms through subscription packages that include agronomic support, herbicide supply, and performance guarantees. Initial users in vineyards, orchards, and horticultural operations report 10-20% reductions in input costs and measurable decreases in environmental impact, driving wider adoption in these regions. In the medium term, drone-compatible formulations are projected to maintain market value even as total application volumes stabilize.
Increasing Weed Pressure and Evolving Challenges
The number of herbicide-resistant weed biotypes worldwide has exceeded 500, representing a 15% increase since 2020, indicating increased selection pressure from single-mode herbicide use[4]Source: International Survey of Herbicide Resistant Weeds, “Herbicide Resistance Database,” weedscience.org. Climate change-induced longer growing seasons allow multiple generations of aggressive weeds to emerge, requiring farmers to combine residual herbicides, post-emergence treatments, and mechanical control methods. In regions with high resistance occurrence, such as the U.S. Corn Belt, Southern Brazil, and Western Australia, farmers now implement two to three different herbicide modes of action per growing season, increasing per-hectare costs. While seed companies are developing multi-herbicide-tolerant traits, regulatory requirements for stacked genes extend the development timeline. The increasing complexity of weed management continues to drive herbicide demand while shifting focus toward diverse chemical solutions.
Regulatory Push for Low-Drift Nano-Formulations
Environmental regulators are implementing stricter off-target drift thresholds, as demonstrated by the 2024 U.S. Environmental Protection Agency regulations limiting dicamba applications based on temperature and wind conditions. Nano-encapsulation technology stabilizes volatile active ingredients, reducing droplet diameter variation and decreasing drift by up to 80% in field trials[5]Source: Environmental Protection Agency, “Dicamba Registration,” epa.gov. Farmers benefit from extended spray windows, which eliminate the need for re-spraying and reduce labor and fuel expenses. While nano-formulated products have higher initial costs, their lower application volumes help maintain reasonable per-hectare expenses. Manufacturers are developing second-generation nano-platforms that integrate controlled release mechanisms with safeners to minimize crop damage and expand application across more crop varieties. The combination of regulatory support and enhanced performance positions nano-formulations as a significant growth driver in the herbicide market through 2030.
Restraints Impact Analysis*
| Restraint | (~) % Impact on CAGR Forecast | Geographic Relevance | Impact Timeline |
|---|---|---|---|
| Stringent residue and registration regulations | -0.7% | Global, most acute in EU and developed markets | Long term (≥ 4 years) |
| Volatility in raw-material prices | -0.5% | Global, heavily affecting generic manufacturers | Short term (≤ 2 years) |
| Accelerating shift to organic farming | -0.4% | Europe and North America core, expanding worldwide | Long term (≥ 4 years) |
| Climate-driven variability in weed pressure | -0.3% | Global with regional disparities | Medium term (2-4 years) |
| Source: Mordor Intelligence | |||
Stringent Residue and Registration Regulations
Regulatory agencies are increasing the cost requirements for new active-ingredient approvals, requiring extensive toxicology and environmental studies spanning up to ten years. Re-registration reviews of existing chemicals threaten established products, reducing their revenue potential before new alternatives become available. Registration costs exceed potential returns for smaller crop segments like minor fruits and spices, reducing available treatment options for farmers. The European Union's Farm to Fork strategy aims to reduce pesticide use by 50% by 2030, leading member states to implement strict maximum residue limits that exceed Codex standards. Large multinational companies can manage compliance costs through economies of scale and diverse product portfolios, while smaller regional suppliers withdraw from low-margin segments. This regulatory environment impacts the herbicide market by slowing innovation and eliminating older products faster than new alternatives can be developed.
Climate-Driven Variability in Weed Pressure
Climate change impacts, including temperature increases and irregular rainfall patterns, are disrupting traditional weed control timing. Wet seasons extend weed germination periods, requiring additional herbicide applications, while drought conditions reduce the effectiveness of soil-active herbicides. Weather extremes, such as flooding, prevent timely herbicide application, forcing farmers to use costlier post-emergence products that are less effective against mature weeds. These weather-related challenges complicate herbicide program planning and increase the risk of improper application rates. Herbicide manufacturers are responding by developing portfolios with fast-acting and drought-resistant products. Field-level variations make it difficult to accurately predict overall market demand. This climate-induced uncertainty creates demand volatility and reduces the herbicide market's compound annual growth rate.
*Our forecasts treat driver/restraint impacts as directional, not additive. The impact forecasts reflect baseline growth, mix effects, and variable interactions.
Segment Analysis
By Application Mode: Soil Treatment Dominance Reflects Conservation Agriculture
Soil treatment accounted for 48.05% of the herbicide market share in 2025 and is anticipated to grow at a 5.22% CAGR through 2031. This growth is driven by the increasing adoption of no-till and strip-till practices that require pre-emergence herbicides for comprehensive weed control. The market for soil-applied herbicides continues to expand as farmers seek season-long weed protection with minimal field operations. Manufacturers are developing advanced soil formulations incorporating micro-encapsulation, vapor-pressure suppressants, and root-uptake enhancers to optimize crop safety and efficacy. Additionally, soil treatments benefit from regulatory preferences due to their reduced drift potential compared to foliar sprays, particularly in areas with buffer zone restrictions. Farmers typically maintain consistent soil treatment programs for three to five years as part of their resistance management strategies, providing stable demand patterns.
Foliar application represents the second-largest segment by value, primarily serving scenarios requiring post-emergence weed control due to canopy structure or late-emerging weeds. The integration of optical weed sensors in precision spraying equipment has improved application accuracy and reduced wastage, increasing farmer adoption of contact herbicides. Chemigation shows steady growth in irrigated fruit orchards and drip irrigation systems, where existing water infrastructure facilitates the application of low-dose active ingredients. Fumigation maintains its significance in high-value horticultural operations targeting persistent weed seeds and nematodes, though cost factors and regulatory requirements limit growth. These alternative application methods contribute to a diverse herbicide market, while soil treatment remains the primary driver of market growth.


By Crop Type: Grains and Cereals Drive Market Leadership
Grains and cereals captured 43.72% of the herbicide market size in 2025, and represent the fastest-growing crop segment, forecast to advance at a 5.09% CAGR between 2026 and 2031. This growth is supported by extensive acreages of corn, soybeans, wheat, and rice that form the foundation of the global calorie supply. Herbicide programs in these crops rely on tolerance traits that simplify weed control, maintain clean harvest platforms, and preserve grade premiums in export channels. Rising feed demand from animal protein markets in Asia drives continuous double-cropping systems that require robust residuals and rapid post-emergence knockdowns, maintaining high chemical volumes. Input cooperatives report that herbicide spend per hectare in soybeans increased 12% between 2022 and 2024 as resistance-driven stacking of modes of action became standard.
Pulses and oilseeds expand with increasing plant-based protein demand and edible oil consumption in emerging economies. Herbicide regimes in these crops require stricter crop-safety tolerances, driving innovation in selective chemistry and pre-emergent options. Fruits and vegetables utilize premium selective herbicides and tailored drone applications, but represent a smaller market share due to limited acreage. Turf and ornamental markets provide consistent off-season demand, particularly in urbanizing regions with increasing disposable incomes. Across crops, integrated weed management principles require suppliers to develop season-spanning portfolios, strengthening brand loyalty and reducing revenue volatility in the herbicide market.

Geography Analysis
South America dominated with a 42.15% of the herbicide market share in 2025. Brazil's consumption reached 720,000 metric tons, while Argentina showed extensive adoption of herbicide-tolerant soybean and corn systems. Farm sizes exceeding 500 hectares enable efficient procurement, and Brazil's streamlined registration protocols reduce approval times for new active ingredients. Government credit programs supporting conservation tillage increase chemical usage through residual soil products in zero-till systems. Multinational companies position formulation facilities near Brazil's Cerrado grain corridor to reduce logistics costs and manage currency risks. Double-cropping practices in Mato Grosso and Rio Grande do Sul create multiple demand periods, increasing per-hectare herbicide application volumes.
Asia-Pacific emerges as the fastest-growing region with a projected 5.85% CAGR through 2031. This growth stems from increased mechanization in China and India, alongside policies promoting food self-sufficiency. Chinese land-consolidation programs combine small farms into cooperatives, enabling investment in precision sprayers and herbicide-based weed management. India's subsidies for farm equipment and digital soil testing encourage chemical usage as an alternative to manual weeding amid urbanization. Rice cultivation in Southeast Asia incorporates drone-applied selective herbicides to control weedy rice. Regional regulatory alignment with Codex standards facilitates product registrations for international suppliers.
North America and Europe represent established markets where environmental regulations drive premium segment expansion rather than volume growth. U.S. farmers combine herbicide programs with digital mapping and agronomic services, supporting higher-value product combinations. While volume growth stabilizes, increased unit prices and additional services maintain revenue growth. Agricultural extension services and advisors promote resistance management practices, encouraging diverse herbicide rotations that enhance market value despite regulatory constraints.

Competitive Landscape
The herbicide market remains moderately concentrated, with the top five companies - Bayer AG, Syngenta Group, Corteva Agriscience, BASF SE, and Nufarm Ltd. - accounting for a modest share of the market in 2024. Their scale enables significant investment in research and development, supporting the discovery of novel modes of action to address resistant weeds. These companies have developed integrated business models that combine herbicides with seed traits, digital farming platforms, and agronomic services, creating comprehensive solutions that increase customer retention. This integration also provides valuable data for product development and marketing optimization.
Major companies are focusing on manufacturing expansion, partnerships, and acquisitions to increase geographic presence and enhance production capabilities. Bayer's capacity expansion in North America and Europe in 2024 focuses on developing low-drift dicamba alternatives to meet stricter application requirements. In 2020, Syngenta introduced the Tymirium technology, representing the first new herbicide mode of action in decades. Smaller companies like FMC are establishing joint ventures with regional generic manufacturers in Asia to access growing markets cost-effectively.
New market entrants are developing RNA interference and (Clustered Regularly Interspaced Short Palindromic Repeats) CRISPR gene-editing technologies to create targeted herbicide mechanisms that address resistance issues. While venture capital supports initial development, regulatory requirements and manufacturing challenges limit immediate market impact. Established companies maintain competitive positions by investing in or licensing emerging technologies. Market success increasingly depends on companies' ability to provide integrated solutions that combine chemical products, data analytics, and equipment while meeting regulatory requirements and consumer demands.
Herbicide Industry Leaders
Bayer AG
Syngenta Group
Corteva Agriscience
BASF SE
Nufarm Ltd.
- *Disclaimer: Major Players sorted in no particular order

Recent Industry Developments
- October 2025: Bayer AG introduced Mateno More, a herbicide formulated to provide extended control against resistant wheat weeds affecting farmers across India. Mateno More is the first herbicide in India to combine three active ingredients, offering comprehensive weed management in wheat crops.
- June 2025: Syngenta Group launched its latest herbicide molecule, metproxybicyclone. The herbicide has been officially recognized by the Herbicide Resistance Action Committee (HRAC) and the Weed Science Society of America (WSSA) as a new chemical subclass within the ACCase-inhibitor family.
- February 2025: UPL Limited, a provider of agricultural solutions, received registration from the U.S. Environmental Protection Agency for INTRAVA DX herbicide, a pre-emergent weed control solution for corn. INTRAVA DX herbicide contains a new active ingredient that provides control and residual protection against resistant weeds.
- November 2024: Corteva Agriscience introduced Kyber Pro and Sonic Boom herbicides. These pre-emergence products provide multiple modes of action and extended residual control, helping soybean farmers increase yield potential while managing weed resistance.


Global Herbicide Market Report Scope
Chemigation, Foliar, Fumigation, Soil Treatment are covered as segments by Application Mode. Commercial Crops, Fruits & Vegetables, Grains & Cereals, Pulses & Oilseeds, Turf & Ornamental are covered as segments by Crop Type. Africa, Asia-Pacific, Europe, North America, South America are covered as segments by Region.| Chemigation |
| Foliar |
| Fumigation |
| Soil Treatment |
| Commercial Crops |
| Fruits and Vegetables |
| Grains and Cereals |
| Pulses and Oilseeds |
| Turf and Ornamental |
| North America | United States |
| Canada | |
| Mexico | |
| Rest of North America | |
| Europe | France |
| Germany | |
| Italy | |
| Netherlands | |
| Russia | |
| Spain | |
| Ukraine | |
| United Kingdom | |
| Rest of Europe | |
| Asia-Pacific | Australia |
| China | |
| India | |
| Indonesia | |
| Japan | |
| Myanmar | |
| Pakistan | |
| Philippines | |
| Thailand | |
| Vietnam | |
| Rest of Asia-Pacific | |
| South America | Brazil |
| Argentina | |
| Chile | |
| Rest of South America | |
| Africa | South Africa |
| Rest of Africa |
| By Application Mode | Chemigation | |
| Foliar | ||
| Fumigation | ||
| Soil Treatment | ||
| By Crop Type | Commercial Crops | |
| Fruits and Vegetables | ||
| Grains and Cereals | ||
| Pulses and Oilseeds | ||
| Turf and Ornamental | ||
| By Geography | North America | United States |
| Canada | ||
| Mexico | ||
| Rest of North America | ||
| Europe | France | |
| Germany | ||
| Italy | ||
| Netherlands | ||
| Russia | ||
| Spain | ||
| Ukraine | ||
| United Kingdom | ||
| Rest of Europe | ||
| Asia-Pacific | Australia | |
| China | ||
| India | ||
| Indonesia | ||
| Japan | ||
| Myanmar | ||
| Pakistan | ||
| Philippines | ||
| Thailand | ||
| Vietnam | ||
| Rest of Asia-Pacific | ||
| South America | Brazil | |
| Argentina | ||
| Chile | ||
| Rest of South America | ||
| Africa | South Africa | |
| Rest of Africa | ||


Market Definition
- Function - Herbicides are chemicals used to control or prevent weeds from preventing crop growth and yield loss.
- Application Mode - Foliar, Seed Treatment, Soil Treatment, Chemigation, and Fumigation are the different type of application modes through which crop protection chemicals are applied to the crops.
- Crop Type - This represents the consumption of crop protection chemicals by Cereals, Pulses, Oilseeds, Fruits, Vegetables, Turf, and Ornamental crops.
| Keyword | Definition |
|---|---|
| IWM | Integrated weed management (IWM) is an approach to incorporate multiple weed control techniques throughout the growing season to give producers the best opportunity to control problematic weeds. |
| Host | Hosts are the plants that form relationships with beneficial microorganisms and help them colonize. |
| Pathogen | A disease-causing organism. |
| Herbigation | Herbigation is an effective method of applying herbicides through irrigation systems. |
| Maximum residue levels (MRL) | Maximum Residue Limit (MRL) is the maximum allowed limit of pesticide residue in food or feed obtained from plants and animals. |
| IoT | The Internet of Things (IoT) is a network of interconnected devices that connect and exchange data with other IoT devices and the cloud. |
| Herbicide-tolerant varieties (HTVs) | Herbicide-tolerant varieties are plant species that have been genetically engineered to be resistant to herbicides used on crops. |
| Chemigation | Chemigation is a method of applying pesticides to crops through an irrigation system. |
| Crop Protection | Crop protection is a method of protecting crop yields from different pests, including insects, weeds, plant diseases, and others that cause damage to agricultural crops. |
| Seed Treatment | Seed treatment helps to disinfect seeds or seedlings from seed-borne or soil-borne pests. Crop protection chemicals, such as fungicides, insecticides, or nematicides, are commonly used for seed treatment. |
| Fumigation | Fumigation is the application of crop protection chemicals in gaseous form to control pests. |
| Bait | A bait is a food or other material used to lure a pest and kill it through various methods, including poisoning. |
| Contact Fungicide | Contact pesticides prevent crop contamination and combat fungal pathogens. They act on pests (fungi) only when they come in contact with the pests. |
| Systemic Fungicide | A systemic fungicide is a compound taken up by a plant and then translocated within the plant, thus protecting the plant from attack by pathogens. |
| Mass Drug Administration (MDA) | Mass drug administration is the strategy to control or eliminate many neglected tropical diseases. |
| Mollusks | Mollusks are pests that feed on crops, causing crop damage and yield loss. Mollusks include octopi, squid, snails, and slugs. |
| Pre-emergence Herbicide | Preemergence herbicides are a form of chemical weed control that prevents germinated weed seedlings from becoming established. |
| Post-emergence Herbicide | Postemergence herbicides are applied to the agricultural field to control weeds after emergence (germination) of seeds or seedlings. |
| Active Ingredients | Active ingredients are the chemicals in pesticide products that kill, control, or repel pests. |
| United States Department of Agriculture (USDA) | The Department of Agriculture provides leadership on food, agriculture, natural resources, and related issues. |
| Weed Science Society of America (WSSA) | The WSSA, a non-profit professional society, promotes research, education, and extension outreach activities related to weeds. |
| Suspension concentrate | Suspension concentrate (SC) is one of the formulations of crop protection chemicals with solid active ingredients dispersed in water. |
| Wettable powder | A wettable powder (WP) is a powder formulation that forms a suspension when mixed with water prior to spraying. |
| Emulsifiable concentrate | Emulsifiable concentrate (EC) is a concentrated liquid formulation of pesticide that needs to be diluted with water to create a spray solution. |
| Plant-parasitic nematodes | Parasitic Nematodes feed on the roots of crops, causing damage to the roots. These damages allow for easy plant infestation by soil-borne pathogens, which results in crop or yield loss. |
| Australian Weeds Strategy (AWS) | The Australian Weeds Strategy, owned by the Environment and Invasives Committee, provides national guidance on weed management. |
| Weed Science Society of Japan (WSSJ) | WSSJ aims to contribute to the prevention of weed damage and the utilization of weed value by providing the chance for research presentation and information exchange. |


Research Methodology
Mordor Intelligence follows a four-step methodology in all our reports.
- Step-1: Identify Key Variables: In order to build a robust forecasting methodology, the variables and factors identified in Step-1 are tested against available historical market numbers. Through an iterative process, the variables required for market forecast are set and the model is built on the basis of these variables.
- Step-2: Build a Market Model: Market-size estimations for the forecast years are in nominal terms. Inflation is not a part of the pricing, and the average selling price (ASP) is kept constant throughout the forecast period.
- Step-3: Validate and Finalize: In this important step, all market numbers, variables and analyst calls are validated through an extensive network of primary research experts from the market studied. The respondents are selected across levels and functions to generate a holistic picture of the market studied.
- Step-4: Research Outputs: Syndicated Reports, Custom Consulting Assignments, Databases & Subscription Platforms


