Biofortification Market Size and Share
Market Overview
| Study Period | 2021 - 2031 |
|---|---|
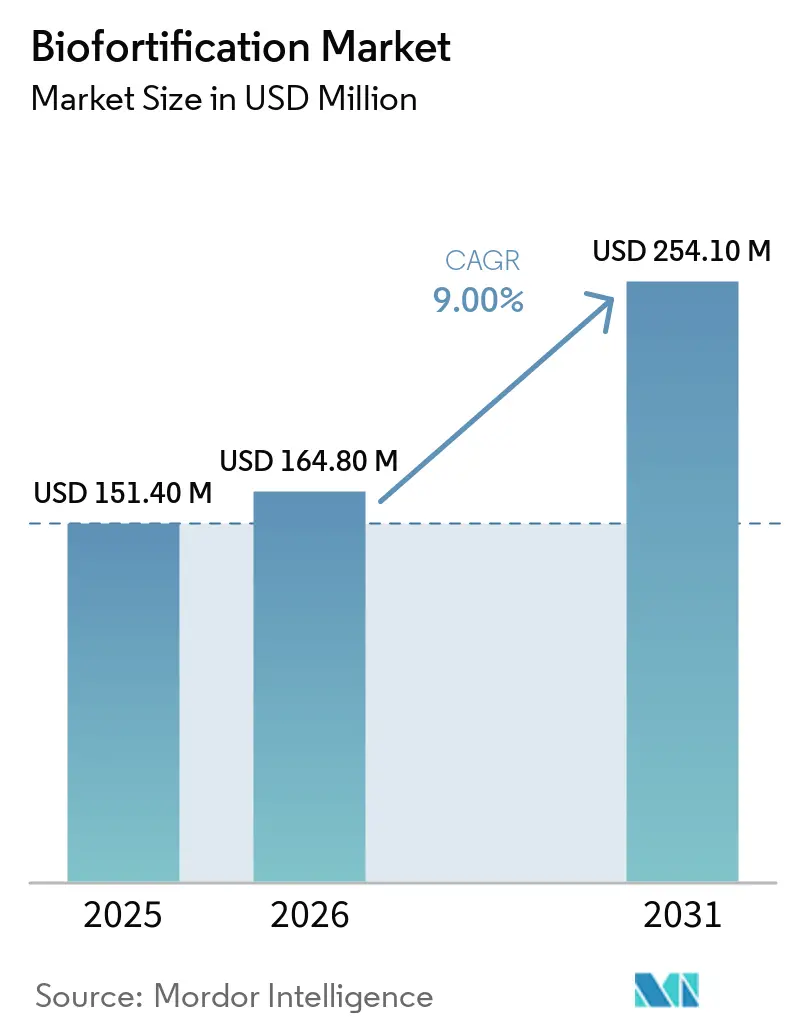
| Market Size (2026) | USD 164.80 Million |
| Market Size (2031) | USD 254.10 Million |
| Growth Rate (2026 - 2031) | 9.00% CAGR |
| Fastest Growing Market | Asia-Pacific |
| Largest Market | Asia-Pacific |
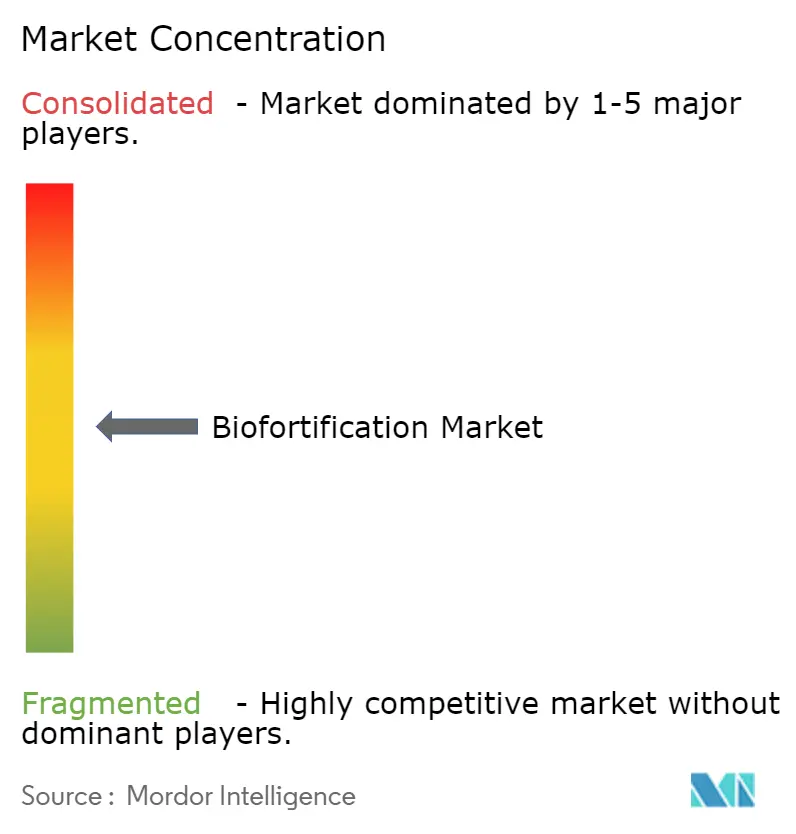
| Market Concentration | Medium |
Major Players *Disclaimer: Major Players sorted in no particular order Image © Mordor Intelligence. Reuse requires attribution under CC BY 4.0. | |
Biofortification Market Analysis by Mordor Intelligence
The biofortification market size was valued at USD 151.4 million in 2025 and is projected to grow from USD 164.8 million in 2026 to USD 254.1 million by 2031, at a CAGR of 9.0% during the forecast period (2026-2031). The market's growth is driven by the persistent issue of micronutrient deficiencies affecting a significant portion of the global population, keeping nutrition-focused crop improvement a priority on public policy agendas. According to HarvestPlus, every USD 1 invested in biofortification generates USD 17 in benefits through reduced disease burden, which sustains donor and development finance interest. Governments in nutrient-deficient regions are incorporating biofortified staples into food and nutrition programs, as this approach leverages existing crop and seed systems rather than relying solely on recurring tablet distribution. The market also benefits from the expansion of zinc wheat and zinc rice programs across South Asia, where staple crops dominate calorie consumption, and public procurement systems facilitate large-scale distribution. Competitive dynamics in the biofortification market remain fragmented, as value creation is distributed among public breeders, regional seed multipliers, cooperatives, crop nutrition firms, and last-mile enterprises, rather than being concentrated within a few global seed companies.
Key Report Takeaways
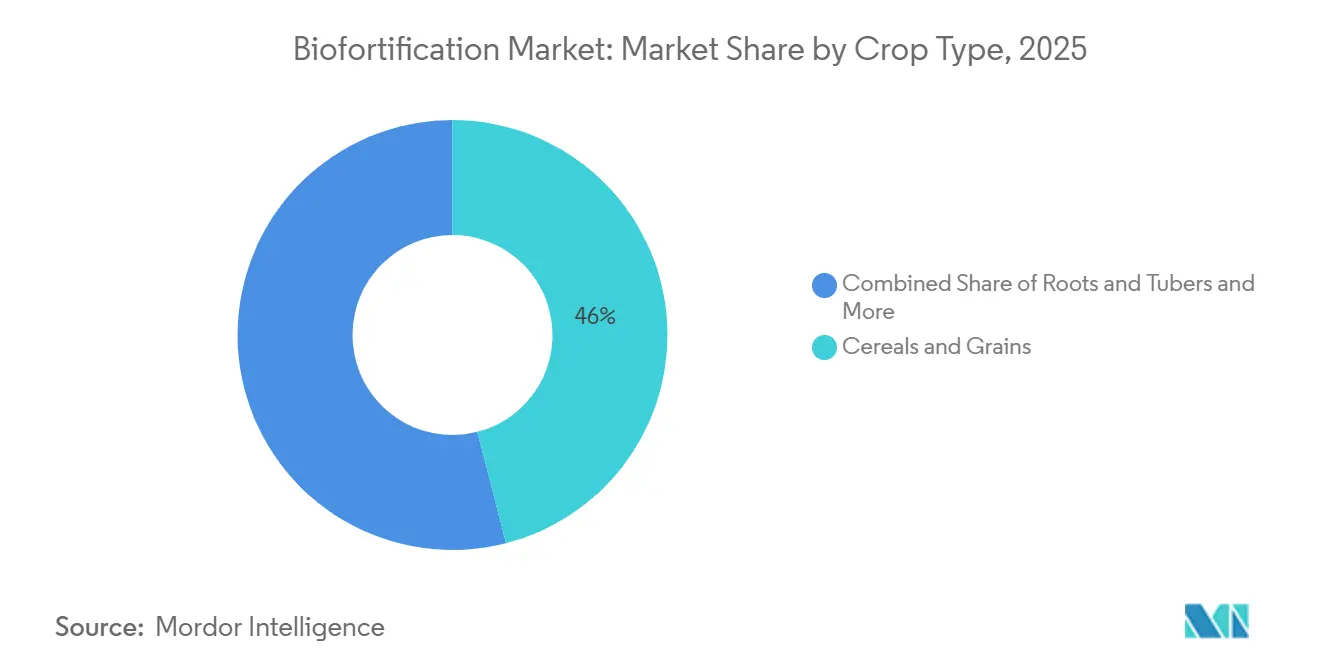
- By crop type, the biofortification market share for the cereals and grains segment accounted for the largest 46.0% in 2025, while the biofortification market size for the pulses and legumes segment is projected to grow at the fastest CAGR at 10.8% from 2026 to 2031.
- By target nutrient, the biofortification market share of provitamin A held the largest 38.0% in 2025, while the biofortification market size for zinc-enriched crops posted the fastest CAGR at 11.9% from 2026 to 2031.
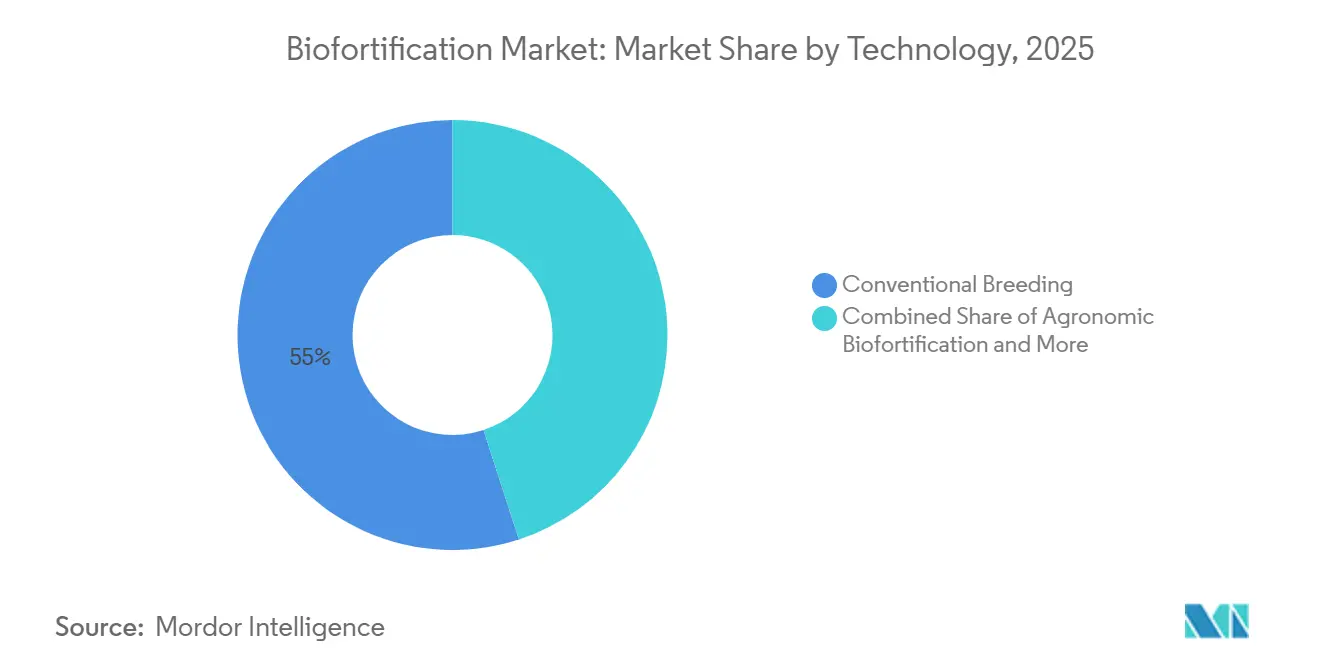
- By technology, the biofortification market share for conventional breeding accounted for the largest 55.0% in 2025, while the biofortification market size for genetic engineering recorded the fastest CAGR at 12.3% from 2026 to 2031.
- By end-use application, the biofortification market share commercial farming captured the largest 65.0% in 2025, while the biofortification market size for government and NGO seed procurement is projected to grow at the fastest 7.2% CAGR from 2026 to 2031.
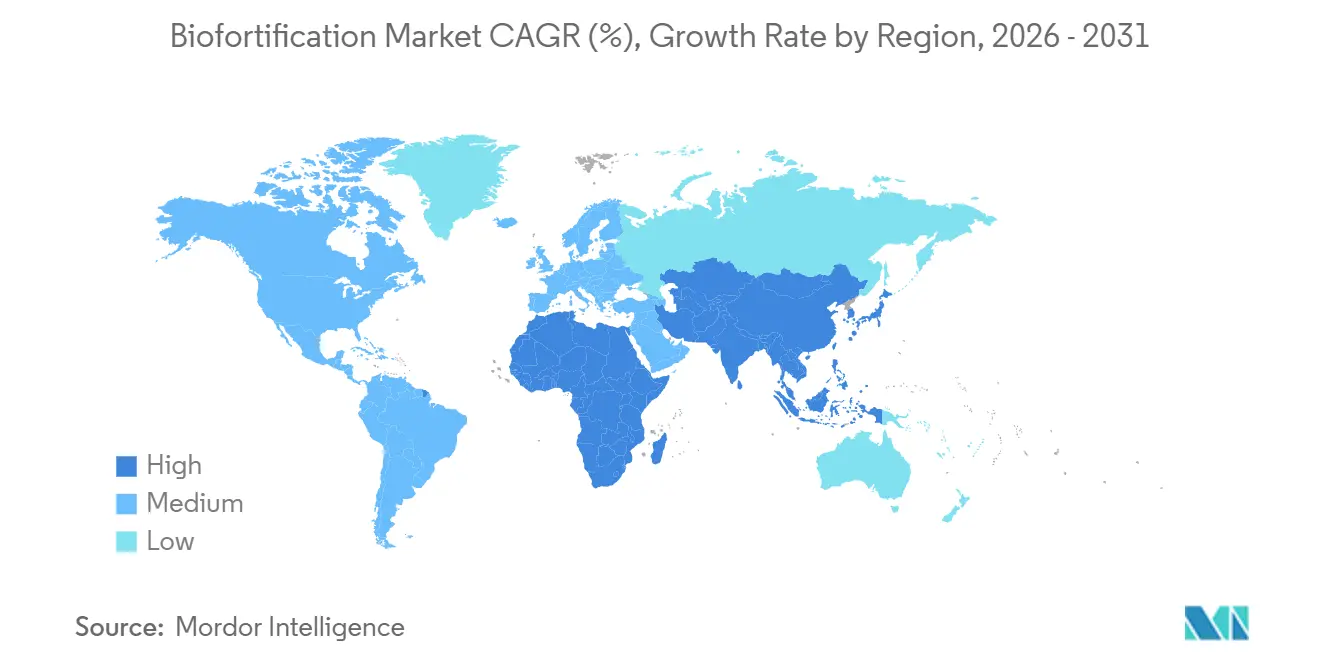
- By geography, the biofortification market share for Asia-Pacific held the largest 28.0% in 2025 and also recorded the fastest CAGR at 9.8% from 2026 to 2031.
Note: Market size and forecast figures in this report are generated using Mordor Intelligence’s proprietary estimation framework, updated with the latest available data and insights as of January 2026.
Global Biofortification Market Trends and Insights
Drivers Impact Analysis*
| Driver | (~) % Impact on CAGR Forecast | Geographic Relevance | Impact Timeline |
|---|---|---|---|
| Government procurement of biofortified staples in public nutrition programs | +1.8% | Global, concentrated in South Asia and Sub-Saharan Africa | Medium term (2-4 years) |
| Persistent hidden hunger and micronutrient deficiency burden | +1.6% | Asia-Pacific, Africa, and South America | Long term (≥ 4 years) |
| Cost-effective nutrition delivery versus supplementation and industrial fortification | +1.2% | Global, particularly low- and middle-income countries | Medium term (2-4 years) |
| Advances in breeding, genome editing, and agronomic micronutrient delivery | +1.8% | Global, with research and development hubs in North America, Europe, and South Asia | Medium term (2-4 years) |
| Climate-resilient biofortified varieties attracting blended and impact finance | +1.3% | Africa, South Asia, spillover to South America | Long term (≥ 4 years) |
| Standards, traceability, and nutrient-logo demand from processors and retailers | +0.8% | North America, Europe, and urban Asian markets | Short term (≤ 2 years) |
| Source: Mordor Intelligence | |||
Government Procurement of Biofortified Staples in Public Nutrition Programs
The biofortification market sees consistent demand growth primarily when governments procure biofortified staples for public nutrition programs. This approach transitions demand from project-based distribution to regular procurement. Furthermore, school feeding programs and social protection initiatives are emerging as viable commercial channels. For instance, the USD 3 million NutriHarvest and Cargill, Incorporated joint project in 2024 supports the supply of iron-pearl millet and zinc wheat to institutional buyers in India, Kenya, Tanzania, and Guatemala[1]Source: Cargill, “HarvestPlus and Cargill Launch NutriHarvest Project,” cargill.com. In Nigeria, the adoption of minimum standards for vitamin A maize and iron pearl millet seeds launched by HarvestPlus in 2025 has strengthened compliance requirements within formal seed distribution systems. Notably, the highest levels of farmer adoption are observed in regions with active procurement systems, emphasizing the critical role of demand organization alongside agronomic performance.
Persistent Hidden Hunger and Micronutrient Deficiency Burden
The biofortification market is experiencing growth due to the persistent issue of micronutrient malnutrition among populations reliant on staple foods. Broad food-based interventions remain essential in addressing this challenge. According to data published in the Journal of Health, Population and Nutrition in 2024, approximately 67% of children aged 6 to 59 months in India were anemic, while over 40% of children under the age of 5 in Pakistan were stunted, highlighting the significant need for intervention[2]Source: National Center for Biotechnology Information, “Biofortification as a Sustainable Strategy to Improve Nutritional Quality of Crops,” ncbi.nlm.nih.gov. This burden is particularly pronounced in regions where daily calorie intake is heavily dependent on a single staple food. Enhancing the nutritional quality of such staples can improve health outcomes without necessitating substantial changes in dietary habits. Additionally, funding gaps exacerbate the issue, as interruptions in breeding and release cycles can weaken the development of new varieties before they achieve widespread adoption.
Cost-Effective Nutrition Delivery Versus Supplementation and Industrial Fortification
The biofortification market offers a cost-effective alternative to supplementation and industrial fortification, particularly in staple-based diets prevalent in rural and lower-income areas. While governments with industrial fortification programs address nutritional deficiencies, they often encounter limited processed food coverage in rural regions. This gap provides an opportunity for biofortified staples to reach households outside formal food processing systems. As the production of biofortified grains expands, the reliance on post-harvest premixes in staple-heavy diets may decrease, leading to a slight shift in the long-term dynamics of the broader nutrition delivery chain. Additionally, the biofortification market appeals to investors favoring upfront development expenditures and long-term social benefits, as seed adoption eliminates the need for recurring nutrient costs per unit sold.
Advances in Breeding, Genome Editing, and Agronomic Micronutrient Delivery
Advancements in breeding techniques, genome editing, and agronomic micronutrient delivery are driving growth in the biofortification market by reducing the time between nutrient discovery and the commercial deployment of crops. Enhanced breeding technologies and precision nutrient-delivery systems are improving the efficiency of nutrient-enriched crops while supporting better crop performance and micronutrient absorption under diverse field conditions. Genome-editing tools are also facilitating the faster development of crops with higher nutrient density and improved bioavailability. These scientific developments are increasing the commercial viability of biofortified crops within staple food systems. However, regulatory approvals, seed certification processes, and distribution infrastructure in many developing agricultural economies are advancing at a slower pace compared to the progress in technology.
Restraints Impact Analysis*
| Restraint | (~) % Impact on CAGR Forecast | Geographic Relevance | Impact Timeline |
|---|---|---|---|
| Regulatory delays for transgenic and gene-edited crop approvals | -0.9% | Africa, South Asia, and parts of Europe | Medium term (2-4 years) |
| Consumer skepticism toward engineered nutrition claims | -0.7% | Global, concentrated in developed and urban markets | Short term (≤ 2 years) |
| Fragmented last-mile seed multiplication and distribution | -0.8% | Sub-Saharan Africa, South Asia, and rural South America | Medium term (2-4 years) |
| Weak farmgate premiums in bulk commodity channels | -0.6% | Sub-Saharan Africa and South Asia | Long term (≥ 4 years) |
| Source: Mordor Intelligence | |||
Regulatory Delays for Transgenic and Gene-Edited Crop Approvals
Regulatory delays in the approval of transgenic and gene-edited crops continue to hinder growth in the biofortification market. Advanced breeding technologies face inconsistent biosafety and commercialization frameworks across various agricultural regions. According to the International Service for the Acquisition of Agri-biotech Applications, by 2024, only a few out of 54 African countries had approved the cultivation of genetically modified crops, restricting the wider adoption of advanced biofortified crop technologies in nutrient-deficient areas[3]Source: International Service for the Acquisition of Agri-biotech Applications, “Global Status of Genetically Modified Crop Approvals in Africa,” isaaa.org. While some countries are gradually adopting more flexible policies for gene-edited crops, regulatory harmonization across Africa and Southeast Asia remains limited. Consequently, companies are maintaining both conventional and genetically engineered biofortification pipelines to navigate these mixed regulatory environments.
Consumer Skepticism Toward Engineered Nutrition Claims
Consumer skepticism regarding engineered nutrition claims continues to hinder the growth of the biofortification market, as trust in nutrient-enhanced crops often lags behind scientific validation and regulatory advancements. According to the researcher from Hohenheim University, noted in 2025 that, consumers in sub-Saharan Africa often struggle to differentiate biofortified crops from conventional varieties based solely on appearance. This challenge increases the likelihood of product mixing and undermines opportunities for premium pricing within local trade channels. The lack of visual differentiation also diminishes confidence in certification and traceability systems among buyers and traders. Consequently, adoption increasingly relies on localized awareness programs, transparent labeling, and enhanced nutrition-focused communication strategies.
*Our forecasts treat driver/restraint impacts as directional, not additive. The impact forecasts reflect baseline growth, mix effects, and variable interactions.
Segment Analysis
By Crop Type: Cereals Anchor Revenue as Pulses and Legumes Accelerate
The biofortification market share for the cereals and grains segment accounted for the largest 46.0% in 2025. This dominance is attributed to the role of rice, wheat, and maize as staple foods in micronutrient-deficient regions across Asia and Africa. Large-scale public breeding programs and national seed-distribution systems prioritize these staple crops due to their ability to reach a broader population compared to specialty crops. Zinc-enriched wheat and provitamin A maize are commercially significant as they combine nutritional benefits with scalable production economics. Additionally, the segment benefits from robust institutional procurement, established value chains, and compatibility with existing farming systems in major agricultural economies worldwide.
The biofortification market size for the pulses and legumes segment is projected to grow at the fastest CAGR at 10.8% from 2026 to 2031. This growth is driven by rising demand for iron-rich beans, lentils, and pulse crops in Africa and South Asia, where anemia and protein deficiency are prevalent nutritional challenges. Pulses are gaining commercial importance due to their nutrient density, soil-health benefits, and climate resilience. Iron-enriched beans and nutrient-enhanced legumes are increasingly supported by institutional initiatives, including school-feeding and food-security programs. Furthermore, the development of aggregation systems and regional seed multiplication networks is facilitating the transition of nutrient-enriched pulse crops from pilot-scale projects to broader commercial agricultural distribution channels globally.


By Target Nutrient: Provitamin A Leads, Zinc-Enriched Crops Drive Fastest Growth
The biofortification market share for the provitamin A segment held the largest 38.0% in 2025. This segment leads the market due to the persistent challenge of vitamin A deficiency in several low-income agricultural economies. Crops such as provitamin A maize, cassava, and orange-fleshed sweet potato have benefited from long-term institutional support, awareness campaigns, and public-sector distribution initiatives. Commercial adoption has increased as these crops integrate seamlessly into existing farming systems without requiring significant operational changes for growers. Additionally, growing acceptance among governments, donor agencies, and nutrition-focused procurement programs continues to drive demand for provitamin A crop varieties, particularly within global food security and rural agricultural development initiatives.
The biofortification market size for zinc-enriched crops posted the fastest CAGR at 11.9% from 2026 to 2031. The demand for these crops is closely tied to wheat and rice systems in South Asia and Southeast Asia, where zinc deficiency remains prevalent in staple-based diets. Zinc-focused breeding programs are receiving increased policy support due to their potential to deliver scalable nutritional improvements through widely consumed staple crops. Iron also remains a significant nutrient category, supported by ongoing investments in anemia-reduction programs across Africa and Asia. Furthermore, researchers are advancing work on folate, selenium, and multi-nutrient crop varieties through gene-editing and advanced breeding techniques. Nutrient-specific certification standards continue to influence commercialization pathways and institutional adoption across various agricultural markets globally.
By Technology: Conventional Breeding Dominates, Genetic Engineering Accelerates
The biofortification market share for conventional breeding accounted for the largest 55.0% in 2025. This method remains dominant as it avoids many biosafety restrictions associated with genetically modified crops while enabling scalable nutrient enhancement in staple crops. Public agricultural research systems and international crop-improvement programs continue to drive the large-scale release of nutrient-enriched crop varieties through traditional breeding methods. This approach facilitates broader adoption in developing agricultural economies, where regulatory approval systems for advanced biotechnology are limited. Additionally, agronomic biofortification complements conventional breeding by enhancing micronutrient delivery through fertilizer and foliar application programs integrated into existing crop-management practices in commercial farming systems globally.
The biofortification market size for genetic engineering recorded the fastest CAGR at 12.3% from 2026 to 2031. This growth is driven by advancements in genome editing, nutrient stacking, and improved micronutrient bioavailability technologies, which conventional breeding cannot always achieve efficiently. Gene-editing approaches are increasingly favored as they enable faster nutrient enhancement and trait optimization in staple crops. However, regulatory complexity remains a significant commercial challenge, particularly in Africa and Southeast Asia, where biosafety approval systems vary widely between countries. As a result, the technology landscape is becoming increasingly divided, with conventional biofortification programs dominating in regions with stricter regulations, while advanced engineered crop platforms gain traction in markets with more permissive regulatory frameworks and stronger biotechnology infrastructure.
By End-Use Application: Commercial Farming Anchors Revenue, Government Procurement Accelerates
The biofortification market share for commercial farming captured the largest 65.0% revenue share in 2025. Commercial growers are increasingly adopting nutrient-enhanced crop varieties due to their combination of agronomic performance and access to institutional procurement and nutrition-linked premium markets. Seed multiplication networks and distribution systems have expanded from demonstration projects to broader commercial agricultural production systems. Nutrient-enriched varieties of wheat, maize, and beans are becoming standard choices in planting decisions across several developing agricultural economies. This adoption is further supported by the alignment of food-security objectives with farm profitability, enabling growers to engage in nutrition-focused supply chains while maintaining productivity in conventional agricultural production environments globally.
The biofortification market size for government and NGO seed procurement is projected to grow at the fastest 7.2% CAGR from 2026 to 2031. Public-sector procurement programs are transitioning from pilot seed distribution initiatives to structured institutional grain purchasing for schools, hospitals, and social welfare systems. This shift is enhancing long-term demand stability for nutrient-enhanced crop varieties, as procurement contracts provide greater market certainty for growers and seed suppliers. Governments and development agencies are increasingly emphasizing traceability, nutrient verification, and certification standards within nutrition-sensitive agricultural procurement systems. The growth in institutional demand is driving investments in testing infrastructure, supply chain transparency, and quality assurance systems across global nutrient-enhanced agricultural production and distribution networks.
Geography Analysis
The biofortification market share for Asia-Pacific accounted for the largest market share of 28.0% in 2025, and the market size for Asia-Pacific is projected to grow at the fastest CAGR of 9.8% from 2026 to 2031. The region's leadership is attributed to the combined presence of large micronutrient-deficient populations in countries such as India, Pakistan, Bangladesh, China, and Indonesia, along with robust public agricultural programs and high staple-crop consumption. Governments in the region are increasingly supporting the distribution of zinc wheat, iron pearl millet, and provitamin A crops through state-backed seed systems and nutrition initiatives, aiding the region's growth.
Africa remains a structurally significant growth region due to widespread nutritional deficiencies and climate-sensitive farming systems, which create strong long-term demand for nutrient-enhanced crops. Iron beans, zinc maize, and biofortified pearl millet are increasingly incorporated into regional food security and agricultural development programs, particularly in East and Southern Africa. Several African governments are gradually integrating micronutrient standards into seed release frameworks, thereby enhancing the commercial legitimacy of nutrient-enhanced crop varieties. Distribution systems led by regional aggregators and seed multipliers are strengthening adoption beyond donor-supported pilot programs.
North America held a mature position in the biofortification market, with activities primarily focused on innovation, premium specialty products, and agronomic input systems rather than large-scale public nutrition initiatives. South America exhibited a diverse mix of activities, with country-level efforts spanning grain, rice, and root crop pathways. The region also demonstrated a significant role for public research partnerships in advancing biofortification initiatives. Europe's contribution to the biofortification market is primarily through its research capacity and micronutrient input portfolios, rather than large-scale staple-feeding programs.

Competitive Landscape
The competitive landscape remains moderately fragmented due to variations in nutrient targets, crop types, public-sector priorities, and agricultural systems across regions. Key players such as Bayer AG, Corteva, Inc., Syngenta AG, BASF SE, and UPL Limited operate alongside public-sector breeding systems and regional seed multipliers. Competitive positioning increasingly relies on seed-distribution capabilities, local agronomic support, nutrient verification systems, and relationships with public procurement programs. Regional seed companies maintain significant influence, as local networks are essential for accessing smallholder farming systems in developing agricultural economies.
Competition is shifting toward integrated value-chain coordination rather than focusing solely on seed genetics and breeding capabilities. Companies and development partners are increasing investments in traceability, certification, and nutrient-verification systems to enhance buyer confidence and procurement eligibility. Strategic partnerships are aligning seed multiplication, institutional purchasing, agronomic advisory support, and nutrition-focused distribution channels within coordinated frameworks. Agronomic input suppliers and seed developers operate under distinct commercial models, with recurring fertilizer and micronutrient input sales differing from seed-scale expansion strategies.
The competitive environment increasingly favors companies that combine seed development, institutional partnerships, and nutrient-certification systems across multiple agricultural regions. According to HarvestPlus, the company introduced the Neutral Mark authentication symbol in August 2025 to enhance the identification and verification of certified nutrient-enhanced products within commercial supply chains. Regional companies such as Maharashtra Hybrid Seeds Company Private Limited and Seed Co Limited are also strengthening their competitive positions through localized seed-distribution networks and commercial expansion in developing agricultural markets. Traceability, certification, and alignment with institutional procurement programs are becoming critical competitive differentiators on a global scale.
Biofortification Industry Leaders
Bayer AG
Syngenta AG
BASF SE
Corteva, Inc.
UPL Limited
- *Disclaimer: Major Players sorted in no particular order

Recent Industry Developments
- February 2026: The Iringa Farmers' Cooperative Union in Tanzania, with support from HarvestPlus and Cargill's NutriHarvest project, achieved the production of 20 metric tons of certified iron bean seed by the end of 2025. This output was four times the initial production target and was accompanied by a 100% repayment rate under the credit model provided to participating farmers. This outcome demonstrates the commercial viability of the cooperative-led biofortified seed multiplication model for replication across East Africa.
- December 2025: The International Crops Research Institute for the Semi-Arid Tropics introduced the first biofortified pearl millet varieties, Iniadi Composite 1501 and ICMP 177003. These varieties combine high iron and zinc density with drought tolerance derived from the Iniadi genetic background, specifically developed for Zimbabwe and the broader Eastern and Southern Africa region.
- April 2024: HarvestPlus and the International Food Policy Research Institute initiated a biofortification project in Bangladesh and Uganda to promote the cultivation of zinc rice, vitamin A maize, vitamin A sweet potato, and iron beans. The project targets 38,000 farmers in Bangladesh and 20,000 farmers in Uganda through the distribution of biofortified seeds and training programs on climate-smart agriculture practices.


Global Biofortification Market Report Scope
Biofortification involves enhancing the nutritional content of food crops by increasing levels of micronutrients such as zinc, iron, and provitamin A through breeding, agronomic methods, or biotechnology. This process aims to address malnutrition and micronutrient deficiencies while improving the nutritional quality of widely consumed staple crops. The biofortification market report is segmented by crop type (cereals and grains, roots and tubers, pulses and legumes, and oilseeds), by target nutrient (provitamin A, iron, zinc, folate, amino acids and protein, and target nutrients), by technology (conventional breeding, genetic engineering and genome editing, and agronomic biofortification), by end-use application (commercial farming, animal feed raw material, government and NGO seed procurement, and food processing and branded biofortified foods), and by geography (North America, South America, Europe, Asia-Pacific, Middle East, and Africa). The market forecasts are provided in terms of value (USD).
| Cereals and Grains | Rice |
| Wheat | |
| Maize | |
| Pearl Millet | |
| Roots and Tubers | |
| Pulses and Legumes | |
| Oilseeds |
| Provitamin A |
| Iron |
| Zinc |
| Folate |
| Others |
| Conventional Breeding |
| Genetic Engineering |
| Agronomic Biofortification |
| Commercial Farming |
| Animal Feed Raw Material |
| Government and NGO Seed Procurement |
| North America | United States |
| Canada | |
| Mexico | |
| Rest of North America | |
| South America | Brazil |
| Argentina | |
| Rest of South America | |
| Europe | Germany |
| United Kingdom | |
| France | |
| Italy | |
| Spain | |
| Russia | |
| Rest of Europe | |
| Asia-Pacific | China |
| India | |
| Japan | |
| Australia | |
| South Korea | |
| Rest of Asia-Pacific | |
| Middle East | Saudi Arabia |
| United Arab Emirates | |
| Rest of Middle East | |
| Africa | Nigeria |
| South Africa | |
| Rest of Africa |
| By Crop Type | Cereals and Grains | Rice |
| Wheat | ||
| Maize | ||
| Pearl Millet | ||
| Roots and Tubers | ||
| Pulses and Legumes | ||
| Oilseeds | ||
| By Target Nutrient | Provitamin A | |
| Iron | ||
| Zinc | ||
| Folate | ||
| Others | ||
| By Technology | Conventional Breeding | |
| Genetic Engineering | ||
| Agronomic Biofortification | ||
| By End-Use Application | Commercial Farming | |
| Animal Feed Raw Material | ||
| Government and NGO Seed Procurement | ||
| By Geography | North America | United States |
| Canada | ||
| Mexico | ||
| Rest of North America | ||
| South America | Brazil | |
| Argentina | ||
| Rest of South America | ||
| Europe | Germany | |
| United Kingdom | ||
| France | ||
| Italy | ||
| Spain | ||
| Russia | ||
| Rest of Europe | ||
| Asia-Pacific | China | |
| India | ||
| Japan | ||
| Australia | ||
| South Korea | ||
| Rest of Asia-Pacific | ||
| Middle East | Saudi Arabia | |
| United Arab Emirates | ||
| Rest of Middle East | ||
| Africa | Nigeria | |
| South Africa | ||
| Rest of Africa | ||


Key Questions Answered in the Report
What is the current size of biofortification business worldwide?
Biofortification market size is valued at USD 164.8 million in 2026.
Which region leads revenue generation for nutrient-enriched staple crops?
Asia-Pacific region leads with the largest 28.0% market share in 2025.
Which crop group contributes the most revenue?
Cereals and grains segment held the largest 46.0% share in 2025.
Which nutrient category is growing the fastest?
Zinc-enriched crops are projected to expand at the fastest 11.9% CAGR from 206 to 2031.
Page last updated on:


