
Tomato Market Analysis by Mordor Intelligence
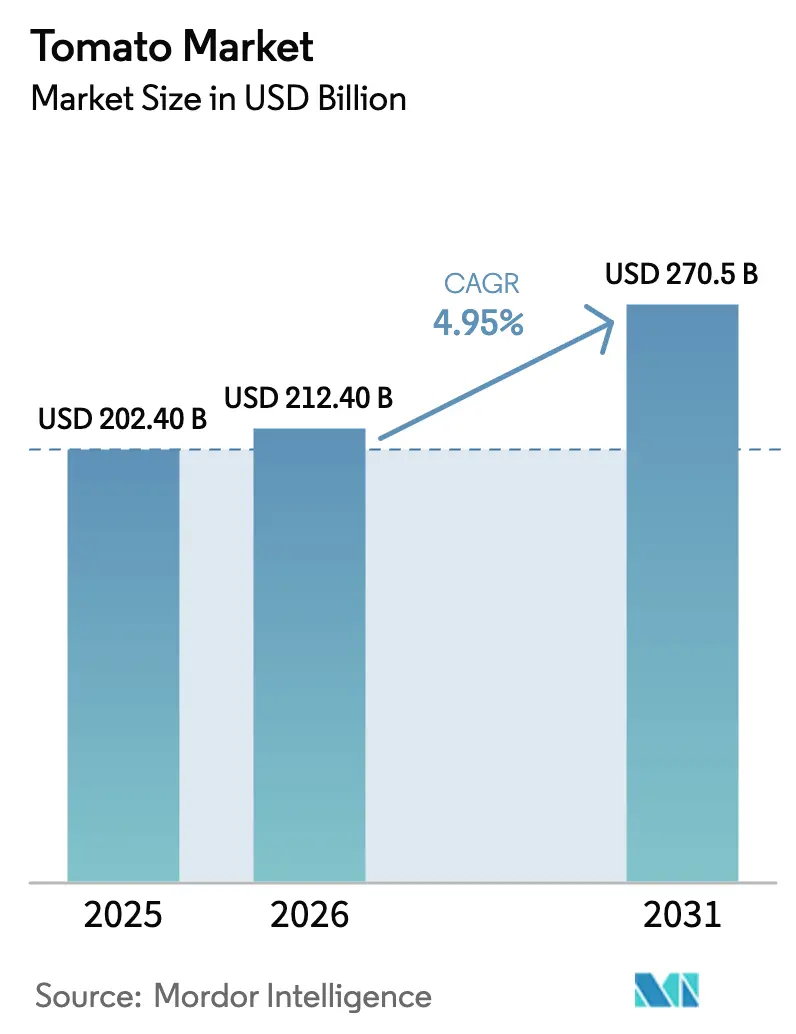
The tomato market value is projected to expand from USD 202.4 billion in 2025 and USD 212.4 billion in 2026 to USD 270.5 billion by 2031, registering a CAGR of 4.95% between 2026 to 2031. Surging demand for paste in quick-service restaurants, rapid adoption of greenhouse technology, and steady urban population growth are the primary drivers shaping the tomato commodity market. Producers in water-scarce regions are investing in drip irrigation while import-dependent nations are scaling domestic processing to curb trade deficits. Technology-led greenhouse clusters in the Netherlands, Mexico, and Japan now deliver yields that are two to three times higher than open-field benchmarks, thereby tightening global competition. At the same time, climate volatility, carbon-footprint scrutiny, and price swings of up to 60% per season continue to pressure margins across the supply chain.
Key Report Takeaways
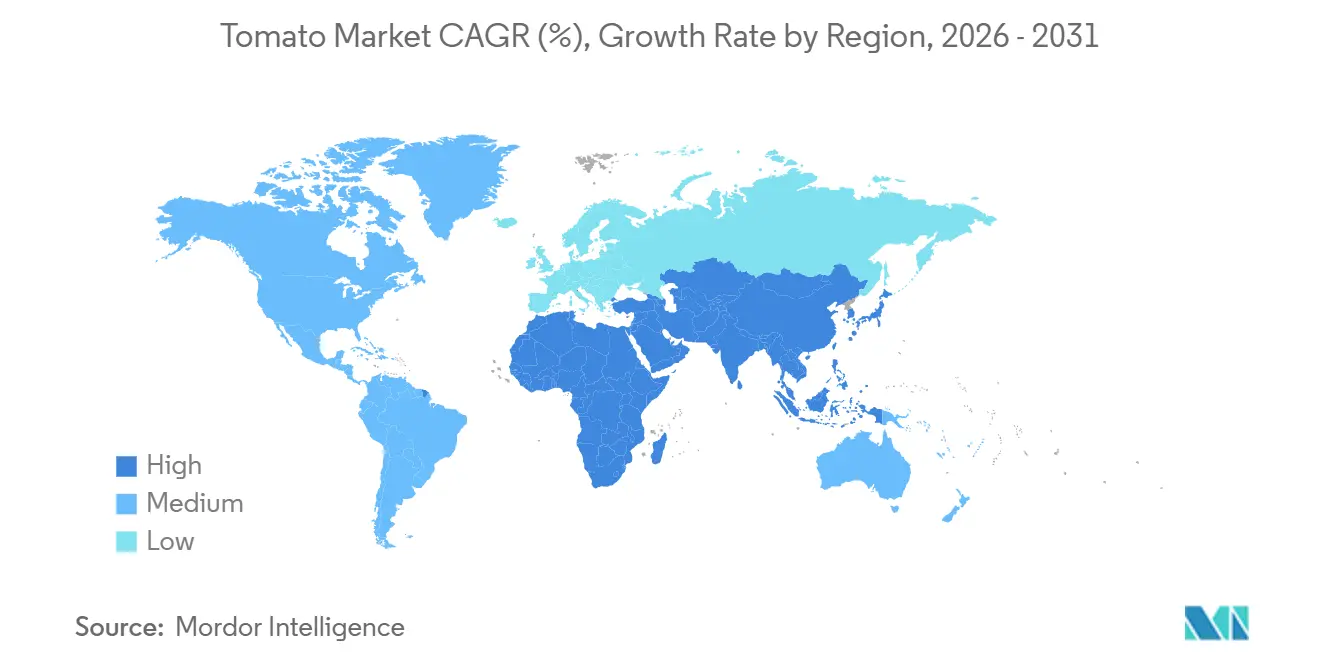
- By geography, Asia-Pacific dominated the tomato market with a 47.0% share in 2025, while Africa is anticipated to grow at the highest CAGR of 4.8% during 2026-2031.
Note: Market size and forecast figures in this report are generated using Mordor Intelligence’s proprietary estimation framework, updated with the latest available data and insights as of January 2026.
Global Tomato Market Trends and Insights
Drivers Impact Analysis*
| Driver | (~) % Impact on CAGR Forecast | Geographic Relevance | Impact Timeline |
|---|---|---|---|
| Rising demand for processed tomato products | 1.2% | Global, with concentration in North America, Europe, and Asia-Pacific QSR markets | Medium term (2-4 years) |
| Expansion of greenhouse and protected cultivation | 1.0% | Europe (Spain, Netherlands, Italy), Asia-Pacific (Japan, China), Middle East (Turkey, UAE) | Long term (≥ 4 years) |
| Government incentives for high-value horticulture | 0.9% | Asia-Pacific (India, China), Africa (Egypt, Nigeria), South America (Brazil) | Medium term (2-4 years) |
| Health and nutrition-driven fresh tomato uptake | 0.7% | Global, with premium segments in North America and Europe | Short term (≤ 2 years) |
| Premiumization via zero-residue hydroponic tomatoes | 0.5% | North America (urban centers), Europe (Netherlands, UK), Asia-Pacific (Japan, Singapore) | Medium term (2-4 years) |
| AI-driven optimization of high-tech greenhouses | 0.4% | Europe (Netherlands, Spain), North America (California, Canada), Asia-Pacific (Japan) | Long term (≥ 4 years) |
| Source: Mordor Intelligence | |||
Rising Demand for Processed Tomato Products
Multi-year supply contracts from quick-service restaurants and ready-meal brands continue to tighten spot availability of paste and diced tomatoes. China’s paste consumption is rising at 7% CAGR, outpacing its 1.5 million metric tons capacity and gradually eroding the country’s export surplus. Italy processed 5.2 million metric tons in 2024, and branded sauce, with a 6% CAGR, is diverting volumes from export channels. Nigeria spends USD 360 million on paste imports each year, encouraging local processors to integrate backward with growers and close raw material gaps[1]Source: Mutti S.p.A., “Annual Report 2024,” mutti-parma.com.
Expansion of Greenhouse and Protected Cultivation
Energy-efficient greenhouses enable year-round production, mitigate weather risk, and support premium pricing. The Netherlands exported USD 1.89 billion (EUR 1.8 billion) in greenhouse tomatoes in 2024, while reducing natural gas use by 30% through the use of LED lighting and advanced climate control algorithms. Mexico’s Sinaloa operations achieved a yield of 70 metric tons per acre, double California’s open-field yield, by coupling fertigation with precise nutrient delivery.
Government Incentives for High-Value Horticulture
Capital subsidies and soft loans are steering acreage toward tomatoes in emerging economies. India’s Production Linked Incentive Scheme has earmarked USD 1.31 billion (INR 109 billion) for processing expansion, while offering 50% support on greenhouse construction. Egypt expanded its use of drip irrigation to 120,000 hectares in 2024, resulting in a production increase to 6.7 million metric tons and a boost in exports to European and Middle Eastern buyers. Nigeria’s central bank provides concessional credit to processors, yet utilization lags because raw fruit supply remains erratic.
Health and Nutrition-Driven Fresh Tomato Uptake
Consumer awareness of lycopene and clean-label attributes is driving up demand for fresh tomatoes in high-income markets. In 2024, organic tomatoes not only saw a 4.7% uptick in sales but also commanded prices that were 111.6% higher than their conventional counterparts, according to the Organic Produce Network (OPN) and the Organic Trade Association (OTA). This surge outpaced the broader growth of organic produce, underscoring a clear consumer shift towards healthier, cleaner choices. Japan’s shoppers pay a 25% premium for zero-residue hydroponic produce, which encourages the development of urban vertical farms. The new European Union labeling, which mandates pesticide-residue disclosure from 2025, is already polarizing the shelf into certified and non-certified tiers, with a 15% price gap.
Restraints Impact Analysis*
| Restraint | (~) % Impact on CAGR Forecast | Geographic Relevance | Impact Timeline |
|---|---|---|---|
| Post-harvest losses and pest-driven spoilage | -0.8% | Africa, South Asia, other developing markets | Medium term (2-4 years) |
| Water stress and adverse climate volatility | -1.0% | Mediterranean Basin, California, other traditional growing regions | Long term (≥ 4 years) |
| Carbon-footprint scrutiny of energy-intensive greenhouses | -0.5% | Europe, North America | Medium term (2-4 years) |
| Price volatility in tomato market | -0.7% | Global, strongest in import-dependent regions | Short term (≤ 2 years) |
| Source: Mordor Intelligence | |||
Post-Harvest Losses and Pest-Driven Spoilage
Up to 20% of harvested tomatoes in developing regions never reach consumers because refrigerated transport and storage are scarce. India still loses 11.61% of its crop despite Operation Greens' cold-chain subsidies. Nigeria’s 18% spoilage rate inflates a USD 360 million paste import bill, and the invasive moth Tuta absoluta cuts yields by 30% across East Africa in 2024. These gaps invite investment in integrated cold-chain logistics and pest-management service firms.
Water Stress and Adverse Climate Volatility
Central Valley aquifers are depleting at a rate of 2% per year, prompting California to consider a 10% reduction in acreage by 2027. Spain’s Andalusia region suffered a 15% yield loss in 2024 amid a multi-year drought, prompting growers to adopt deficit irrigation, which reduces fruit size. Turkey’s Antalya greenhouses lost 12.56% of output during the 2022-2023 drought, while China’s Xinjiang faces rising capital outlays for drip irrigation to sustain processing farms. A Nature Food model predicts a 6% decline in global tomato production by 2050 under high-emission scenarios [2]Source: Nature Food, “Climate Scenarios for Global Tomato Yield,” nature.com.
*Our forecasts treat driver/restraint impacts as directional, not additive. The impact forecasts reflect baseline growth, mix effects, and variable interactions.
Geography Analysis
The Asia-Pacific region accounted for 47.0% of the global tomato production market share in 2025, yet disparities widened between water-stressed inland provinces and coastal greenhouse hubs. China’s Xinjiang region produced 90% of the country's processed tomatoes and shipped 1.5 million metric tons of paste, but rising irrigation costs are eroding its price competitiveness. India’s Karnataka, Maharashtra, and Andhra Pradesh states offer subsidies for processing plants, although post-harvest losses of 11.6% still plague growers. Japan’s hydroponic complexes triple open-field yields and supply premium retailers, underscoring the role of technology in countering land scarcity.
Africa is the fastest-growing region, with a 4.8% CAGR, anchored by Egypt’s 6.7 million-ton drip-irrigated harvest and Nigeria’s policy push to substitute USD 360 million in paste imports. South Africa and Cameroon meet domestic demand, yet they lack the cold-chain depth to capture off-season premiums. Strategic investment in storage and logistics could unlock latent demand across the continent, where per capita intake stays under 5 kilograms.
North America also held a significant share in 2025, with mature open-field systems in California complemented by rapid greenhouse expansion in Mexico and Canada. California delivered 11 million metric tons of processing tomatoes but faces a 10% acreage cut by 2027 due to aquifer depletion. Mexico’s Sinaloa and Baja California greenhouses reached 70 metric tons per acre and exported 1.8 million metric tons valued at USD 2.7 billion to the United States. Canada’s carbon tax lifted heating costs by 12% in 2024, pushing some growers to adopt geothermal heat or exit the market [3]Source: California Department of Water Resources, “Central Valley Aquifer Allocation Cuts,” water.ca.gov.


Regulatory Landscape
Trade and plant-health compliance remain key for cross-border tomato flows. In the United States, fresh tomato imports during the October through June window must meet grade, size, quality, and maturity requirements under Marketing Order No. 966 (7 CFR Part 980, including 7 CFR 980.212). The Department of Commerce also continued cash-deposit requirements on fresh tomato imports from Mexico after a five-year sunset review for entries on or after July 14, 2025.
Phytosanitary and border-control scrutiny tightened across major importing blocs. USDA APHIS amended its Tomato brown rugose fruit virus (ToBRFV) Federal Order effective June 17, 2024, maintaining strict requirements for tomato propagative material while rescinding certain requirements for fresh fruit for consumption. In the European Union, Commission Implementing Regulation (EU) 2026/194 applied from January 2026 to temporarily increase official controls for specific commodities, including tomatoes, at border entry points due to pesticide residue risks. Implementing Regulation (EU) 2024/2970 also set ToBRFV-related requirements for tomato and pepper plants for planting through December 31, 2026.
Value Chain Analysis
The tomato value chain runs from seed and input suppliers (hybrids, fertilizers, crop protection, and irrigation hardware) to growers in both open-field and protected cultivation. It then moves through aggregators and packers, cold-chain logistics, and primary processing for paste, diced tomatoes, and puree, before reaching retail, foodservice, and industrial buyers. Volatility at the processing node continues to swing overall market outcomes: global processed tomato output moved from 45.85 million metric tons in 2024 to 40.29 million metric tons in 2025. California’s processing volume was 10.65 million tons in 2025 (+6.5% year over year), while China fell to 4.90 million metric tons in 2025 (down sharply from 2024).
Trade and policy frictions also affect routing and contracting. Concentrated tomato puree trade (HS 200290) totaled 3.89 million tonnes from May 2024 to April 2025, underscoring how ports, storage, and container availability influence processors and blenders. In North America, anti-dumping measures on Mexican tomatoes (linked to July 2025 actions) added compliance and cost layers that cascade back to growers and packers, pushing buyers toward diversified sourcing and tighter specifications and increasing reliance on contracted volumes over spot procurement.
Competitive Landscape
The market consists of a diverse range of participants, including vertically integrated processors, advanced greenhouse operators, and regional grower cooperatives. Campbell Soup Company purchased a 49% stake in La Regina for USD 286 million in December 2025 to secure supply for its Rao’s brand and reduce exposure to spot-market swings. In March 2025, Morning Star’s acquisition of Del Monte’s Hanford plant adds 500,000 metric tons of annual throughput and cements its leadership position in North American paste supply. Kraft Heinz and Conesa Group opened a USD 15.7 million facility in Portugal in September 2025, which combines farming contracts with branded distribution across Europe.
Strategic moves increasingly center on energy efficiency and emissions targets. Dutch greenhouse operators are investing in geothermal loops and combined heat and power systems to meet a mandated 50% reduction in emissions by 2030. Mexican growers are adopting artificial intelligence-guided fertigation to increase yields to 70 metric tons per acre while reducing water use by 40%. Japanese producers utilize computer vision grading, which enhances export-grade yields and minimizes waste.
Regional policy also shapes rivalry between exporters. India’s USD 1.3 billion (INR 109 billion) incentive program and Egypt’s 120,000-hectare drip network attract private capital into new processing hubs. Carbon taxes in Canada and the European Union emissions levies tilt the cost curve away from gas-heated glasshouses toward sites with abundant renewable energy. The United States antidumping probes into Mexican tomatoes inject further uncertainty and encourage suppliers to diversify markets beyond North America.
Market Opportunities and Future Outlook
Investment and integration around processing and supply assurance are creating room for import-dependent and quality-sensitive markets. Nigeria continues to spend about USD 360 million annually on paste imports (as cited in the report context), and recent financing activity points to capacity building locally. Tomato Jos Farming and Processing Limited secured a USD 2 million impact-linked debt facility from Sabou Capital (May 2026) to expand its smallholder network and processing capacity in Kaduna State. In India, policy support for processing expansion (Production Linked Incentive Scheme earmark of INR 109 billion in the report context) is being reinforced by private infrastructure commitments. ITC allocated INR 8 crore (July 2026) for climate-controlled facilities in a tomato-focused fruits and vegetables cluster in Kuppam, Andhra Pradesh, built around 10,000 tonnes of production.
In established processing hubs, corporate moves are pointing toward tighter coordination between farms, factories, and distribution, which supports demand for contract farming platforms, quality testing services, and energy-efficient processing upgrades. Mutti announced a EUR 42.5 million investment for 2026 within a five-year plan focused on plant upgrades and AI-driven supply chain management, and De Cecco signed a binding agreement (June 2026) to acquire 100% of RossoGargano with a multi-year investment plan. This supports requirements for traceability, consistent raw tomato quality, and logistics reliability. At the same time, production variability highlighted by WPTC estimates for 2026 processing tomatoes near 40.1 million tonnes and a California 2026 forecast around 9 million tonnes reinforces the commercial value of water-efficient cultivation, cold-chain buildout to reduce losses (up to 20% in developing regions in the report context), and disease-resilient seed adoption, including ToBRFV-focused planting material controls in the EU and the United States.
Recent Industry Developments
- July 2026: La Doria signed an agreement to acquire 100% of the Solana Group, including Solana Societa Agricola and subsidiaries Suncan and Desco, to strengthen tomato processing capacity. The move expands access to industrial and foodservice supply channels and supports tighter control over raw material sourcing and throughput planning.
- May 2026: The Campbell Company completed its acquisition of a 49% interest in La Regina di San Marzano di Antonio Romano S.p.A. and La Regina Atlantica, LLC, producers linked to Rao's Homemade tomato-based sauces. The transaction deepens supply alignment for branded tomato-based products and reduces exposure to spot-market availability and price swings for key inputs.
- October 2024: American Chemical Society researchers demonstrated that larger-droplet overhead irrigation can trigger immune responses that improve pest tolerance in tomato plants. The work points to a non-chemical crop management pathway that can lower pest-driven losses and reduce reliance on crop protection interventions in both open-field and protected systems.


Research Methodology Framework and Report Scope
Market Definition and Coverage
For this methodology, the tomato market covers the farm-gate value created when tomatoes are harvested for table use or processing use, including open-field and protected cultivation, across key producing and consuming regions.
Scope exclusions: We exclude downstream processed tomato products (such as sauces, ketchup, powders, and concentrates) and exclude tomato seed trade.
Segmentation Overview
- By Geography
- North America
- United States
- Production Analysis (Area Harvested, Yield, and Production Volume)
- Consumption Analysis (Consumption Value and Volume)
- Import Market Analysis (Import Value, Volume, and Key Supplying Markets)
- Export Market Analysis (Export Value, Volume, and Key Destination Markets)
- Wholesale Price Trend Analysis and Forecast
- Regulatory Framework
- List of Key Players
- Logistics and Infrastructure
- Seasonality Analysis
- Canada
- Production Analysis (Area Harvested, Yield, and Production Volume)
- Consumption Analysis (Consumption Value and Volume)
- Import Market Analysis (Import Value, Volume, and Key Supplying Markets)
- Export Market Analysis (Export Value, Volume, and Key Destination Markets)
- Wholesale Price Trend Analysis and Forecast
- Regulatory Framework
- List of Key Players
- Logistics and Infrastructure
- Seasonality Analysis
- Mexico
- Production Analysis (Area Harvested, Yield, and Production Volume)
- Consumption Analysis (Consumption Value and Volume)
- Import Market Analysis (Import Value, Volume, and Key Supplying Markets)
- Export Market Analysis (Export Value, Volume, and Key Destination Markets)
- Wholesale Price Trend Analysis and Forecast
- Regulatory Framework
- List of Key Players
- Logistics and Infrastructure
- Seasonality Analysis
- United States
- Europe
- Spain
- Production Analysis (Area Harvested, Yield, and Production Volume)
- Consumption Analysis (Consumption Value and Volume)
- Import Market Analysis (Import Value, Volume, and Key Supplying Markets)
- Export Market Analysis (Export Value, Volume, and Key Destination Markets)
- Wholesale Price Trend Analysis and Forecast
- Regulatory Framework
- List of Key Players
- Logistics and Infrastructure
- Seasonality Analysis
- Netherlands
- Production Analysis (Area Harvested, Yield, and Production Volume)
- Consumption Analysis (Consumption Value and Volume)
- Import Market Analysis (Import Value, Volume, and Key Supplying Markets)
- Export Market Analysis (Export Value, Volume, and Key Destination Markets)
- Wholesale Price Trend Analysis and Forecast
- Regulatory Framework
- List of Key Players
- Logistics and Infrastructure
- Seasonality Analysis
- Germany
- Production Analysis (Area Harvested, Yield, and Production Volume)
- Consumption Analysis (Consumption Value and Volume)
- Import Market Analysis (Import Value, Volume, and Key Supplying Markets)
- Export Market Analysis (Export Value, Volume, and Key Destination Markets)
- Wholesale Price Trend Analysis and Forecast
- Regulatory Framework
- List of Key Players
- Logistics and Infrastructure
- Seasonality Analysis
- Italy
- Production Analysis (Area Harvested, Yield, and Production Volume)
- Consumption Analysis (Consumption Value and Volume)
- Import Market Analysis (Import Value, Volume, and Key Supplying Markets)
- Export Market Analysis (Export Value, Volume, and Key Destination Markets)
- Wholesale Price Trend Analysis and Forecast
- Regulatory Framework
- List of Key Players
- Logistics and Infrastructure
- Seasonality Analysis
- Poland
- Production Analysis (Area Harvested, Yield, and Production Volume)
- Consumption Analysis (Consumption Value and Volume)
- Import Market Analysis (Import Value, Volume, and Key Supplying Markets)
- Export Market Analysis (Export Value, Volume, and Key Destination Markets)
- Wholesale Price Trend Analysis and Forecast
- Regulatory Framework
- List of Key Players
- Logistics and Infrastructure
- Seasonality Analysis
- Spain
- Asia-Pacific
- China
- Production Analysis (Area Harvested, Yield, and Production Volume)
- Consumption Analysis (Consumption Value and Volume)
- Import Market Analysis (Import Value, Volume, and Key Supplying Markets)
- Export Market Analysis (Export Value, Volume, and Key Destination Markets)
- Wholesale Price Trend Analysis and Forecast
- Regulatory Framework
- List of Key Players
- Logistics and Infrastructure
- Seasonality Analysis
- India
- Production Analysis (Area Harvested, Yield, and Production Volume)
- Consumption Analysis (Consumption Value and Volume)
- Import Market Analysis (Import Value, Volume, and Key Supplying Markets)
- Export Market Analysis (Export Value, Volume, and Key Destination Markets)
- Wholesale Price Trend Analysis and Forecast
- Regulatory Framework
- List of Key Players
- Logistics and Infrastructure
- Seasonality Analysis
- Japan
- Production Analysis (Area Harvested, Yield, and Production Volume)
- Consumption Analysis (Consumption Value and Volume)
- Import Market Analysis (Import Value, Volume, and Key Supplying Markets)
- Export Market Analysis (Export Value, Volume, and Key Destination Markets)
- Wholesale Price Trend Analysis and Forecast
- Regulatory Framework
- List of Key Players
- Logistics and Infrastructure
- Seasonality Analysis
- China
- South America
- Brazil
- Production Analysis (Area Harvested, Yield, and Production Volume)
- Consumption Analysis (Consumption Value and Volume)
- Import Market Analysis (Import Value, Volume, and Key Supplying Markets)
- Export Market Analysis (Export Value, Volume, and Key Destination Markets)
- Wholesale Price Trend Analysis and Forecast
- Regulatory Framework
- List of Key Players
- Logistics and Infrastructure
- Seasonality Analysis
- Argentina
- Production Analysis (Area Harvested, Yield, and Production Volume)
- Consumption Analysis (Consumption Value and Volume)
- Import Market Analysis (Import Value, Volume, and Key Supplying Markets)
- Export Market Analysis (Export Value, Volume, and Key Destination Markets)
- Wholesale Price Trend Analysis and Forecast
- Regulatory Framework
- List of Key Players
- Logistics and Infrastructure
- Seasonality Analysis
- Chile
- Production Analysis (Area Harvested, Yield, and Production Volume)
- Consumption Analysis (Consumption Value and Volume)
- Import Market Analysis (Import Value, Volume, and Key Supplying Markets)
- Export Market Analysis (Export Value, Volume, and Key Destination Markets)
- Wholesale Price Trend Analysis and Forecast
- Regulatory Framework
- List of Key Players
- Logistics and Infrastructure
- Seasonality Analysis
- Brazil
- Middle East
- Turkey
- Production Analysis (Area Harvested, Yield, and Production Volume)
- Consumption Analysis (Consumption Value and Volume)
- Import Market Analysis (Import Value, Volume, and Key Supplying Markets)
- Export Market Analysis (Export Value, Volume, and Key Destination Markets)
- Wholesale Price Trend Analysis and Forecast
- Regulatory Framework
- List of Key Players
- Logistics and Infrastructure
- Seasonality Analysis
- Saudi Arabia
- Production Analysis (Area Harvested, Yield, and Production Volume)
- Consumption Analysis (Consumption Value and Volume)
- Import Market Analysis (Import Value, Volume, and Key Supplying Markets)
- Export Market Analysis (Export Value, Volume, and Key Destination Markets)
- Wholesale Price Trend Analysis and Forecast
- Regulatory Framework
- List of Key Players
- Logistics and Infrastructure
- Seasonality Analysis
- Iran
- Production Analysis (Area Harvested, Yield, and Production Volume)
- Consumption Analysis (Consumption Value and Volume)
- Import Market Analysis (Import Value, Volume, and Key Supplying Markets)
- Export Market Analysis (Export Value, Volume, and Key Destination Markets)
- Wholesale Price Trend Analysis and Forecast
- Regulatory Framework
- List of Key Players
- Logistics and Infrastructure
- Seasonality Analysis
- Turkey
- Africa
- Egypt
- Production Analysis (Area Harvested, Yield, and Production Volume)
- Consumption Analysis (Consumption Value and Volume)
- Import Market Analysis (Import Value, Volume, and Key Supplying Markets)
- Export Market Analysis (Export Value, Volume, and Key Destination Markets)
- Wholesale Price Trend Analysis and Forecast
- Regulatory Framework
- List of Key Players
- Logistics and Infrastructure
- Seasonality Analysis
- South Africa
- Production Analysis (Area Harvested, Yield, and Production Volume)
- Consumption Analysis (Consumption Value and Volume)
- Import Market Analysis (Import Value, Volume, and Key Supplying Markets)
- Export Market Analysis (Export Value, Volume, and Key Destination Markets)
- Wholesale Price Trend Analysis and Forecast
- Regulatory Framework
- List of Key Players
- Logistics and Infrastructure
- Seasonality Analysis
- Nigeria
- Production Analysis (Area Harvested, Yield, and Production Volume)
- Consumption Analysis (Consumption Value and Volume)
- Import Market Analysis (Import Value, Volume, and Key Supplying Markets)
- Export Market Analysis (Export Value, Volume, and Key Destination Markets)
- Wholesale Price Trend Analysis and Forecast
- Regulatory Framework
- List of Key Players
- Logistics and Infrastructure
- Seasonality Analysis
- Egypt
- North America
Data Sources, Market Sizing, and Validation
Desk Research
We start by mapping supply, demand, and trade signals that can be checked from public data, and then we align those series to the farm-gate scope. Sources used for this include official agricultural production statistics and acreage reporting, such as FAOSTAT, USDA, Eurostat, and national agriculture ministries, which help anchor harvested area, yield, and production volumes.
Trade and price context is then added using sources such as UN Comtrade, ITC Trade Map, and wholesale price bulletins where available, followed by association updates and reputable press coverage on cropping cycles and greenhouse capacity additions. We also use paid subscriptions for company financials and intelligence, patent databases, and shipment-level trade data to fill gaps where public datasets are late or too aggregated for cross-checking. The desk sources listed here are illustrative only, and many other public and paid references were used for data collection, validation, and clarification.
Primary Interviews and Surveys
We validate the desk view through expert interviews and short surveys with growers, exporters, wholesalers, procurement teams, and agronomy specialists, so that key assumptions match what is happening on the ground. For a global market like tomatoes, input use and output patterns are checked across major production belts and import destinations, and then the model is adjusted where pricing, losses, or seasonality patterns differ by region.
Distribution of primary research fieldwork respondents
| Company type | Respondent position | Region |
|---|---|---|
| Top tier: 26% | CXOs: 12% | APAC: 43% |
| Mid tier: 60% | Functional/Unit leaders: 29% | EMEA: 34% |
| Smaller Players: 14% | Managers: 59% | Americas: 23% |
Market-Sizing & Forecasting
The sizing starts with a top-down build where harvested area and yield trends are used to reconstruct regional production, which is then tied to farm-gate pricing to arrive at value. To keep the totals realistic, we corroborate them with selective bottom-up checks, such as sampled farm-gate price ranges by season, channel checks with wholesale buyers, and a limited roll-up of country totals where official production series are strong.
A few key inputs that influence the model include harvested area shifts between open-field and protected cultivation, yield improvements, seasonal supply peaks, post-harvest loss assumptions, exportable surplus versus local consumption pull, and farm-gate price movement driven by inflation and weather shocks. Where data breaks exist, gaps are handled through interpolation anchored to nearby seasons and peer-country yield patterns, followed by re-checks during interviews.
For forecasting, we use scenario analysis supported by short time-series smoothing on production and price indicators, and then we align the forward view with expert expectations on greenhouse expansion, water constraints, and expected demand from processors and fresh channels. The final outlook is kept traceable so an analyst can explain each driver without needing hard-to-access data.
Data Validation & Update Cycle
We run multiple checks before sign-off, including cross-validating value outputs against independent production series, trade flows, and observed price bands, and then reviewing any country or region that swings outside expected ranges. When anomalies appear, we re-check the input series, revisit conversion factors and price timing, and re-contact select respondents to confirm whether the shift reflects a real market change or a data artifact.
The work is reviewed in steps, starting with an internal peer review of assumptions and followed by a final analyst pass that checks math consistency and scope alignment. Reports are refreshed annually, and interim updates are made when material events occur (for example, major weather events or policy changes). Before delivery, we do a fresh data pass so clients receive the most current view available.
Mordor Intelligence's Tomato Market Size Measured Against Other Published Estimates
Published tomato market values often differ because groups do not always count the same thing, even when they use similar labels. The largest gaps usually come from whether the estimate sticks to farm-gate tomatoes only, how regional prices are averaged across seasons, and how quickly new production and pricing signals get folded into the model.
Some published figures also mix farm-gate tomatoes with processed tomato products or use retail-level pricing, which can lift the headline value even if volumes are similar. Another common driver is forecast posture, where some numbers assume aggressive price escalation or unusually strong greenhouse yield gains, and those assumptions are not always validated with grower and buyer feedback. A clear separation of fresh harvested value from downstream processing economics is what keeps our total comparable across regions, a choice applied by Mordor Intelligence.
Benchmark comparison
| Source | Market Size | Gaps in Research Methodology |
|---|---|---|
| Mordor Intelligence | USD 212.40 B (2026) | |
| Industry Publisher A | USD 178.65 B (2023) | Uses an earlier base year and appears to be built from broad industry totals, where price timing and regional farm-gate assumptions are not clearly stated, which can compress value in high-price seasons. |
| Independent Research Portal B | USD 230.50 B (2025) | Likely blends fresh tomatoes with adjacent processed categories and applies higher average pricing, which increases the value total even without a matching change in harvested volumes. |
The spread across these figures mainly comes from scope and pricing treatment, followed by how often assumptions are refreshed as harvest outcomes and prices move. By keeping the calculation tied to harvested tomatoes at farm-gate prices and then cross-checking it with production and trade signals, the resulting market size stays easier to reproduce and explain for planning use cases.


Key Questions Answered in the Report
What is the current size of the global tomato market?
The tomato market stands at USD 212.4 billion in 2026 and is projected to reach USD 270.5 billion by 2031 at a 4.95% CAGR.
Which region holds the largest share of the tomato market?
Asia-Pacific leads with a 47.0% tomato market share in 2025, driven by China’s production scale and India’s expanding greenhouse acreage.
Why are greenhouse tomatoes gaining prominence?
Yields are up to 6.4 times higher than field crops, quality is more consistent, and protected systems mitigate climate risks, fueling rapid adoption.
What are the main challenges facing tomato producers?
Key constraints include water stress, post-harvest losses, pest infestations such as Tuta absoluta, and scrutiny of greenhouse carbon footprints.
How is AI influencing tomato cultivation?
AI-guided greenhouse platforms optimize temperature, humidity, and lighting, providing 10.1% higher yields and almost doubling profits in trials.
Page last updated on:


 Your data is secure and never sold or shared.


