Cruise Tourism Market Size and Share
Market Overview
| Study Period | 2020 - 2031 |
|---|---|
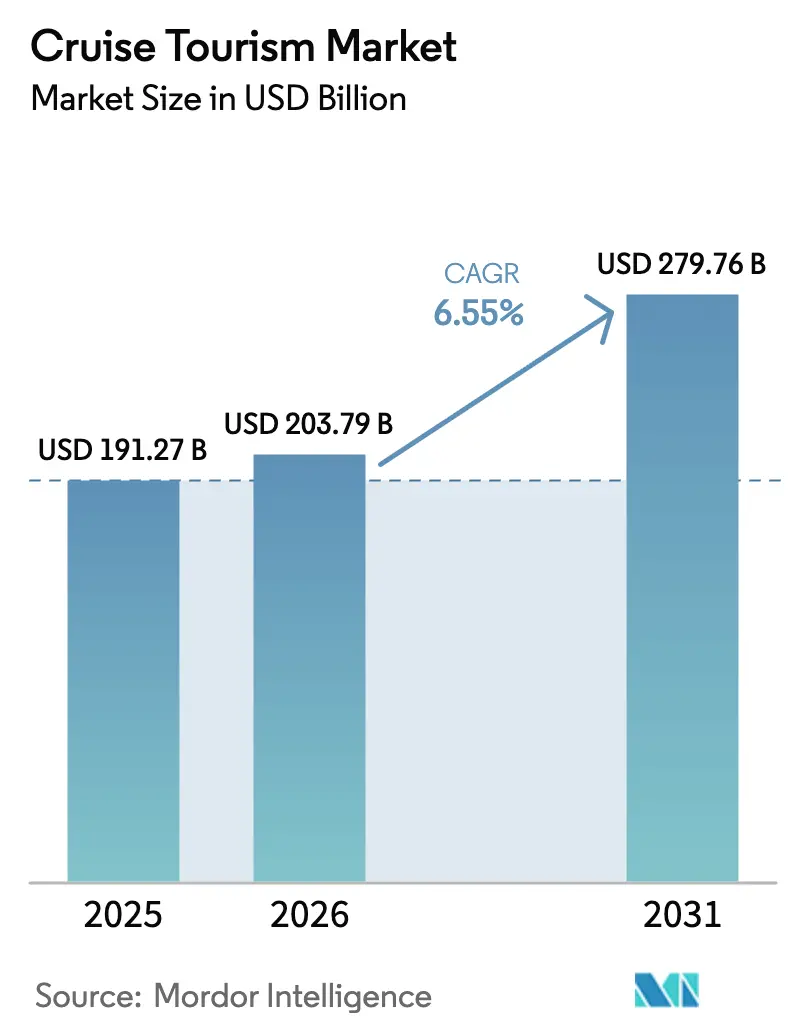
| Market Size (2026) | USD 203.79 Billion |
| Market Size (2031) | USD 279.76 Billion |
| Growth Rate (2026 - 2031) | 6.55% CAGR |
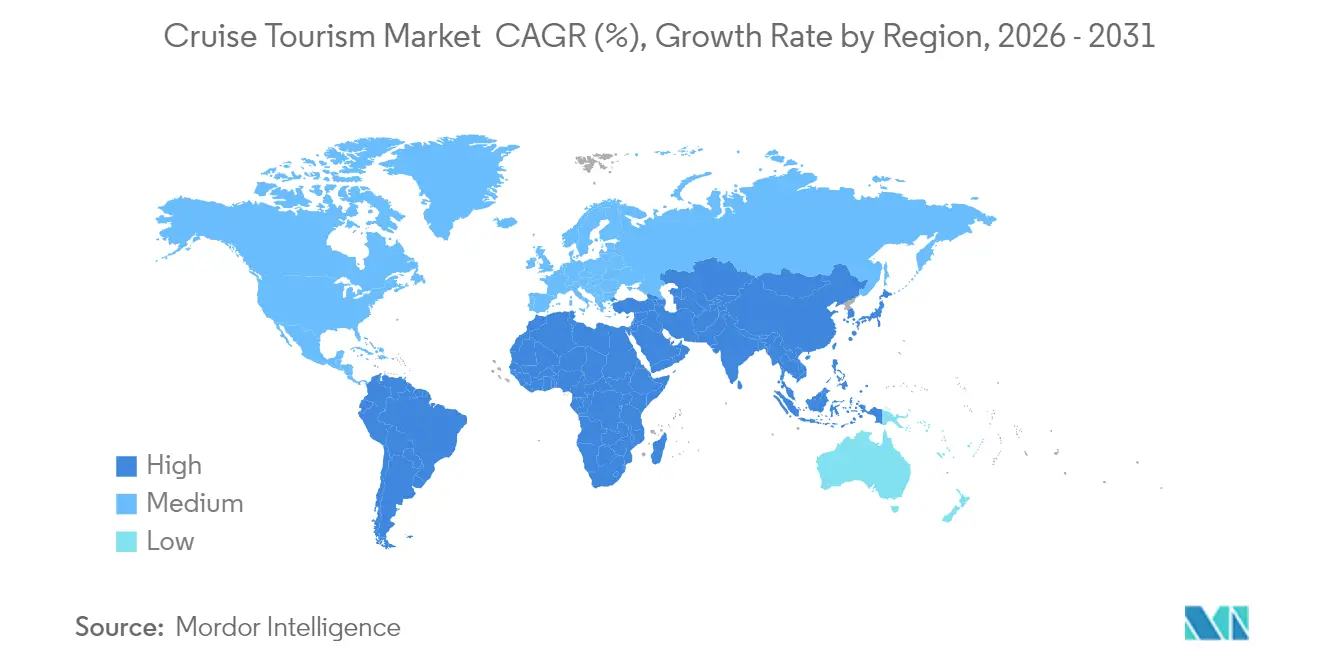
| Fastest Growing Market | Asia Pacific |
| Largest Market | North America |
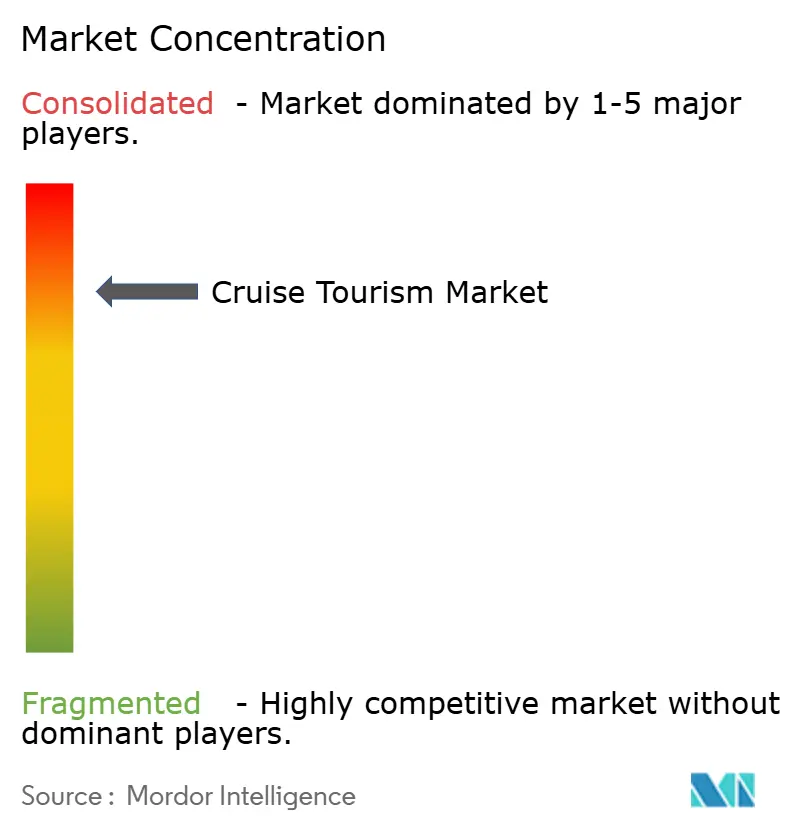
| Market Concentration | High |
Major Players *Disclaimer: Major Players sorted in no particular order Image © Mordor Intelligence. Reuse requires attribution under CC BY 4.0. | |
Cruise Tourism Market Analysis by Mordor Intelligence
The cruise tourism market size is expected to grow from USD 191.27 billion in 2025 to USD 203.79 billion in 2026 and is forecast to reach USD 279.76 billion by 2031 at 6.55% CAGR over 2026-2031. Buoyed by post-pandemic travel resurgence, the market benefits from pent-up demand, mega-ship deployments, and rapid expansion into emerging regions. Operators leverage larger vessels to lower per-berth costs while channeling savings into digital guest-experience upgrades. Expedition itineraries outperform mainstream segments as climate-induced polar route access widens and affluent adventure travelers willingly pay premium fares. Meanwhile, environmental regulations and macroeconomic uncertainty temper profit margins, forcing fleets to accelerate efficiency investments and diversify itinerary portfolios.
Key Report Takeaways
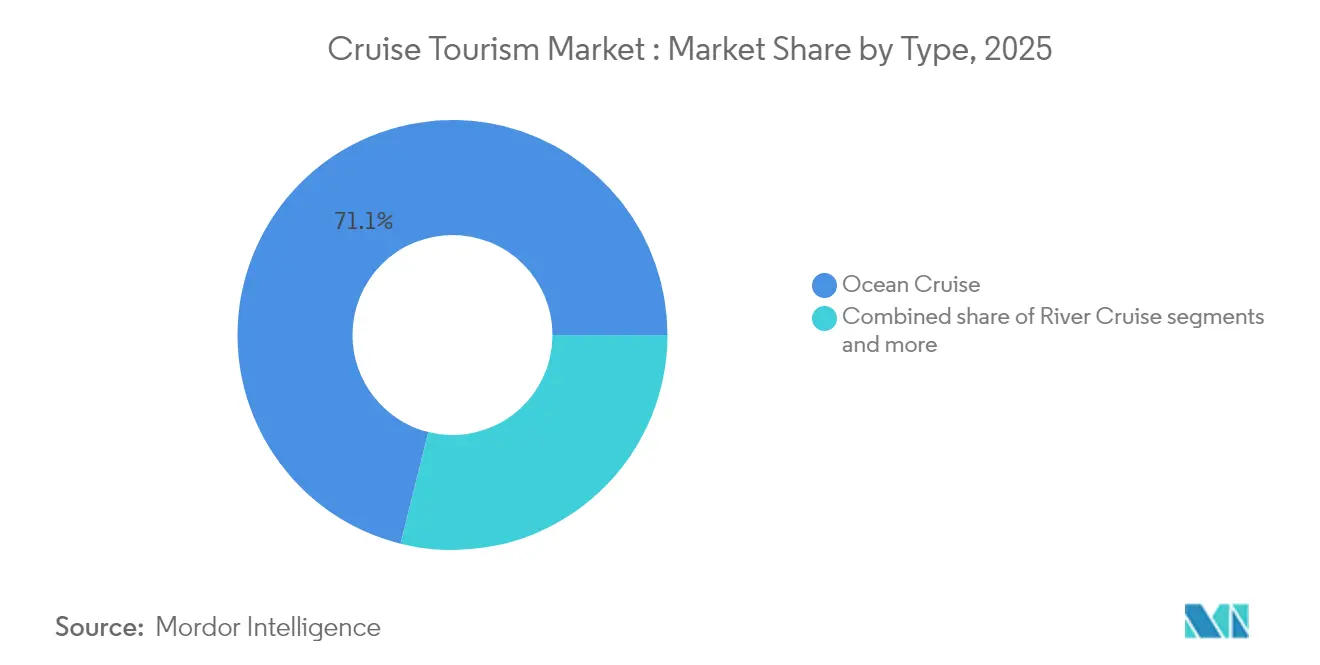
- By type, ocean cruises led with 71.12% of the cruise tourism market share in 2025; expedition cruises are forecast to expand at a 10.12% CAGR through 2031.
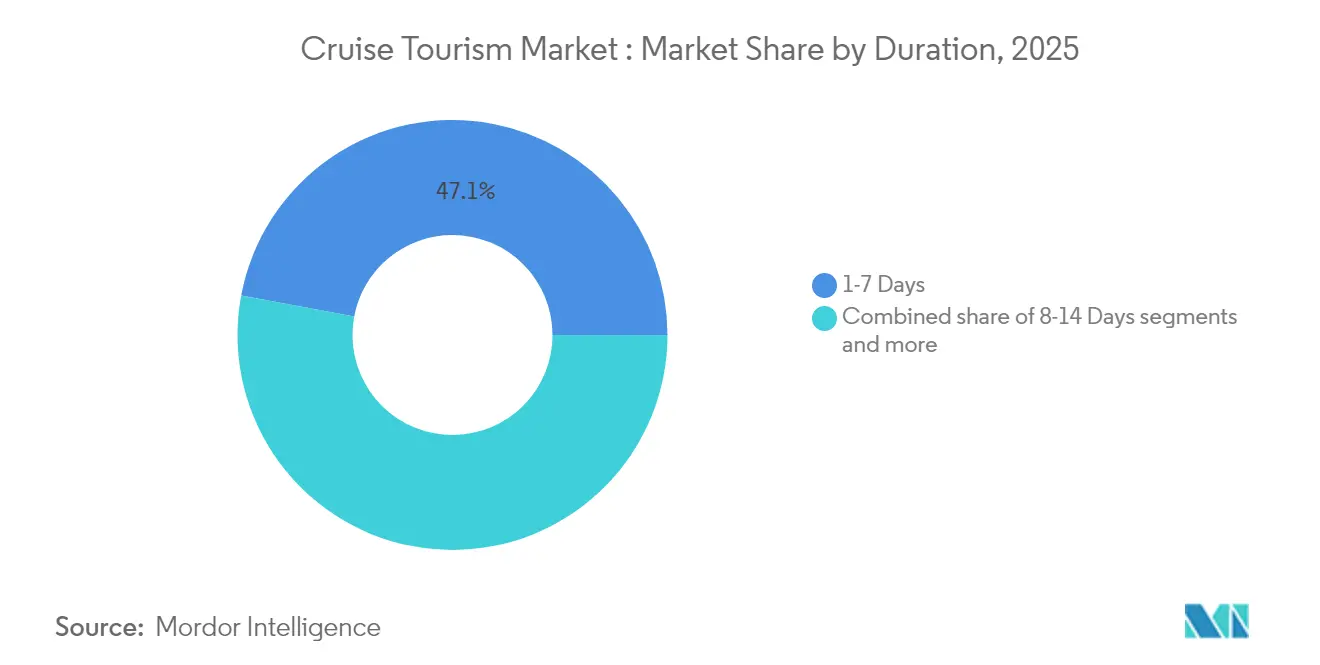
- By duration, 1-7 day voyages accounted for 47.05% of the cruise tourism market share in 2025, while 8-14 day cruises are poised to grow at an 8.05% CAGR to 2031.
- By passenger age, the 40-59 segment held 39.15% share of the cruise tourism market size in 2025, whereas the 20-39 cohort is advancing at a 9.52% CAGR.
- By geography, North America commanded 52.20% of the cruise tourism market share in 2025, but Asia-Pacific is projected to post an 10.78% CAGR through 2031.
Note: Market size and forecast figures in this report are generated using Mordor Intelligence’s proprietary estimation framework, updated with the latest available data and insights as of 2026.
Global Cruise Tourism Market Trends and Insights
Drivers Impact Analysis*
| Driver | (~) % Impact on CAGR Forecast | Geographic Relevance | Impact Timeline |
|---|---|---|---|
| Growing middle-class disposable income in emerging markets | 1.8% | APAC core, spill-over to MEA and South America | Medium term (2-4 years) |
| Rapid expansion of new-build ocean vessels & mega-ships | 1.2% | Global, with concentration in North America & Europe | Long term (≥ 4 years) |
| Strong post-COVID pent-up demand for experiential travel | 0.9% | Global, strongest in North America & Europe | Short term (≤ 2 years) |
| Surge in retiree wealth fueling longer cruise vacations | 0.7% | North America & Europe primarily | Medium term (2-4 years) |
| Opening of previously restricted polar waterways | 0.3% | Arctic/Antarctic routes, benefiting global operators | Long term (≥ 4 years) |
| Government-backed port infrastructure upgrades | 0.4% | APAC, MEA, and South America emerging markets | Medium term (2-4 years) |
| Source: Mordor Intelligence | |||
Growing Middle-Class Income Expansion Reshapes Passenger Demographics
Emerging market prosperity fundamentally alters cruise accessibility, with China's middle-class households earning above USD 10,000 annually projected to reach 550 million by 2030. This demographic expansion drives first-time cruiser adoption rates exceeding 15% annually across ASEAN markets, where multi-generational family bookings now represent 35% of regional demand. The shift enables operators to deploy larger vessels on Asia-Pacific itineraries, with average ship capacity increasing 23% since 2024 as lines chase economies of scale. Pricing strategies adapt accordingly, with premium operators launching mid-market brands specifically targeting emerging market consumers who prioritize value over luxury amenities.
Mega-Ship Economics Transform Capacity Deployment Strategies
Twenty-five ships ordered in 2024 add 6,000-plus berths each and cut per-capita operating expenses by up to 22% thanks to fuel-efficient hulls [1]Cruise Industry News, “Cruise Industry News Annual Report 2024,” cruiseindustrynews.com. . Larger vessels enable older tonnage redeployment into secondary markets without diluting premium route pricing. Balance-sheet risk rises, however, if demand misaligns with supply in mature corridors. Operators mitigate exposure by aligning delivery schedules with forward bookings and by forging favorable long-term financing at today’s relatively low borrowing costs. Airports and ports race to expand infrastructure that accommodates ships exceeding 250,000 gross tons.
Post-Pandemic Experiential Travel Demand Sustains Premium Pricing
Global cruise bookings in 2024 eclipsed 2019 levels by 12% even as average fares rose 8-15% [2]Royal Caribbean Group, “2024 Annual Report,” royalcaribbeangroup.com.. Consumers prioritize unique experiences such as Antarctic landings, leading to expedition booking surges of 71%. Lines redesign stateroom-mix strategies, swapping low-yield inside cabins for balcony and suite categories that capture higher onboard spend averaging USD 65-80 daily. While revenge-travel momentum is strongest in North America and Europe, emerging markets display parallel enthusiasm, signaling a durable pivot from possession-based to experience-based discretionary spending.
Retiree Wealth Concentration Drives Extended Voyage Demand
Affluent retirees propel demand for itineraries surpassing 21 days that command USD 400-600 daily rates [3]Cruise Lines International Association, “2024 Cruise Industry Outlook,” CLIA.org. . Operators retrofit ships with residential-style suites and expanded medical centers to support long-haul comfort. High onboard revenue capture offsets elongated voyage duration by reducing port fees as a share of total costs. Luxury lines reap disproportionate gains because service quality and destination enrichment products resonate with this demographic. Continued growth hinges on financial-market stability that safeguards seniors’ investment income streams.
Restraints Impact Analysis*
| Restraint | (~) % Impact on CAGR Forecast | Geographic Relevance | Impact Timeline |
|---|---|---|---|
| Macroeconomic shocks elevating travel-cost sensitivity | 0.8% | Global, strongest impact in emerging markets | Short term (≤ 2 years) |
| Environmental regulations raising operating costs | 0.6% | Global, with EU leading regulatory implementation | Medium term (2-4 years) |
| Limited berth capacity at marquee ports | 0.4% | Caribbean, Mediterranean, Alaska primary routes | Medium term (2-4 years) |
| Rising geopolitical instability along key corridors | 0.3% | Middle East, Eastern Mediterranean, Arctic routes | Short term (≤ 2 years) |
| Source: Mordor Intelligence | |||
Economic Volatility Pressures Discretionary Travel Budgets
Inflationary pressures and recession fears create headwinds for cruise demand, particularly among price-sensitive emerging market consumers who represent the industry's primary growth engine. Central bank monetary tightening cycles reduce household disposable income, with cruise bookings showing a 0.7-0.9 correlation to consumer confidence indices across major source markets. Operators respond through dynamic pricing strategies and flexible payment plans, yet sustained economic weakness could force capacity reductions or aggressive discounting that erodes profitability. The challenge intensifies in markets like China and India, where nascent cruise cultures lack the loyalty patterns that sustain demand during downturns.
Environmental Compliance Costs Strain Operating Margins
IMO 2030 emission reduction targets and expanding the EU Emissions Trading System coverage impose significant retrofit and operational costs across global fleets. Compliance investments average USD 15-25 million per vessel for scrubber installations and fuel system modifications, while alternative fuel premiums add USD 50-80 per passenger to voyage costs. FuelEU Maritime regulations further complicate operations by mandating renewable fuel blending quotas that exceed current supply capacity. These regulatory pressures disproportionately impact older vessels, accelerating fleet renewal cycles and creating competitive advantages for operators with newer, more efficient ships.
*Our forecasts treat driver/restraint impacts as directional, not additive. The impact forecasts reflect baseline growth, mix effects, and variable interactions.
Segment Analysis
By Type: Expedition Cruises Capitalize on Climate-Driven Route Access
Expedition vessels generate a 10.12% CAGR, even though ocean cruises retain 71.12 of % 2025 revenue dominance. The cruise tourism market size for expedition itineraries is set to climb from USD 7.9 billion in 2025 to USD 14.1 billion by 2031, benefiting from per-passenger yields exceeding USD 1,000 daily. Operators invest in ice-class hulls, zodiac fleets, and science partnerships to differentiate, yet must balance growth against fragile polar ecosystems. River cruises, theme voyages, and adventure sailings broaden customer choice but face port-infrastructure and seasonality constraints that slow expansion.
Passengers' appetite for authenticity drives niche-segment proliferation. Smaller ships access restricted bays and remote villages, fostering cultural exchange and sustainable tourism narratives. However, polar-region restrictions could cap capacity if environmental thresholds tighten further. High ticket prices insulate margins but expose demand to macroeconomic swings. Strategic collaboration with local authorities ensures controlled visitor volumes while preserving itinerary appeal.


By Duration: Mid-Length Voyages Gain Traction Among Working Professionals
The 8-14 day bracket grows 8.05% annually as remote-work flexibility enables travelers to merge vacation and telecommuting. The cruise Tourism market share held by short cruises drops gradually as consumers seek multi-country routes without exceeding two-week leave entitlements. Mid-length voyages optimize port costs across itinerary chains and unlock incremental onboard spend opportunities.
Lines tailors entertainment schedules and connectivity packages to lure professionals who demand stable broadband. Longer 15-20 day trips cater mainly to affluent retirees, while world cruises remain niche yet profitable. By designing voyages that start on weekends, operators minimize vacation-day usage, further boosting appeal to time-constrained travelers.
By Passenger Age: Younger Demographics Drive Digital Innovation Adoption
The 20-39 cohort is projected to expand at 9.52% CAGR, lifting its revenue slice from 29.00% in 2025 to 34.20% by 2031. That growth elevates the cruise Tourism market size for the age group to USD 95.7 billion by 2031 . Millennials and Gen Z exhibit onboard spend of USD 85-110 daily, materially higher than older guests. Operators introduce contactless payments, mobile ordering, and social-media-optimized spaces to meet expectations.
Marketing pivots toward influencer partnerships and gamified loyalty apps that convert first-time cruisers into repeat customers. Yet price sensitivity remains acute, demanding value-oriented fare tiers and flexible cancellation policies. For the 13-19 bracket, school calendars restrict travel windows, compelling lines to stage youth-centric programming during holiday peaks.
Geography Analysis
North America retains 52.20% revenue share, anchored by Caribbean and Alaska routes supported by extensive port networks and favorable regulatory frameworks. Environmental restrictions in Alaska tighten itinerary windows, but Canada’s Arctic infrastructure upgrades unlock new summer options. Mexico’s Caribbean investments expand embarkation alternatives, reducing reliance on U.S. ports.
Asia-Pacific’s 10.78% CAGR crowns it the fastest-growing region. Governments allocate more than USD 15 billion to port facilities, customs modernization, and cruise-specific marketing. China’s state-backed shipbuilding accelerates domestic capacity, and Singapore leverages Changi Airport connectivity to capture fly-cruise traffic. Australia benefits from southern-hemisphere seasonality that fills berths during the Northern Hemisphere winter.
Europe enjoys mature but modest growth as Mediterranean and Baltic voyages capitalize on UNESCO-rich ports. However, the EU ETS raises operating expenses and may redirect older tonnage to less-regulated waters. Eastern European terminals emerge as cost-efficient alternatives, while Brexit complicates itinerary planning between the UK and continental ports.

Competitive Landscape
The cruise industry is dominated by a small number of major operators, with the top five companies holding the majority of global passenger capacity. This concentration creates high barriers to entry, enabling major players to exercise pricing discipline and coordinate capacity deployment effectively. Strategic partnerships and shared technology initiatives are common, exemplified by Royal Caribbean’s use of AI to boost guest engagement by 35%, and Princess Cruises’ comprehensive digital transformation programs. Rather than competing solely on capacity, cruise lines are increasingly differentiating through unique onboard experiences, exclusive destination access, and strong sustainability credentials. The industry avoids destructive price wars, recognizing the high capital intensity and long-term risks associated with such competition.
Technology adoption has emerged as a key differentiator, with top operators investing between USD 200–500 million annually in digital infrastructure. These investments support AI-driven guest services, IoT-enabled ship operations, and automation to enhance both operational efficiency and customer satisfaction. Enhancing the passenger experience through personalized services and seamless connectivity has become a strategic priority. At the same time, technology helps reduce operating costs and supports compliance with growing environmental regulations. As a result, innovation remains central to maintaining competitiveness and brand loyalty in the sector.
New market entrants tend to focus on niche segments such as ultra-luxury travel or expedition cruising, while established players reinforce their dominance through brand portfolio expansion and strategic acquisitions. Opportunities still exist in underserved geographic markets and underrepresented demographics, but the high capital requirements and regulatory complexities present significant obstacles. Consolidation remains a defining trend as smaller operators struggle to keep pace with environmental mandates and capacity competition from larger vessels. Mega-ship deployments by major brands further pressure independent cruise lines, accelerating industry concentration.
Cruise Tourism Industry Leaders
Carnival Corporation & plc
Royal Caribbean Group
Norwegian Cruise Line Holdings
MSC Cruises
Disney Cruise Line
- *Disclaimer: Major Players sorted in no particular order

Recent Industry Developments
- March 2025: MSC Cruises introduced MSC World America with air-lubrication technology that lowers fuel burn 12%.
- January 2025: Royal Caribbean Group posted record Q1 2025 revenues, propelled by Icon-class vessels operating at 132% occupancy.
- September 2024: Virgin Voyages deployed Resilient Lady in Australia to tap adult-only demand.
- February 2024: Carnival Corporation launched a USD 2.5 billion fleet-modernization plan through 2027, targeting 40% emission reductions.


Global Cruise Tourism Market Report Scope
Cruise tourism refers to holidays that are entirely or partly based on a cruise ship.
The cruise tourism market is segmented by type which includes a river cruise, ocean cruise, expedition cruise, theme cruise, adventure cruise, and other types, by duration, including 1- 7 days, 8-14 days, 15-20 days, and more than 21 days, by passenger age includes less than 12 Years, 13-19 years, 20-39 years, 40-59 years, and above 60 years, and by geography includes Asia-pacific, Europe, North America, South America, and the Middle East.
The report offers market size and forecasts for the cruise tourism market in terms of revenue (USD) for all the above segments.
| River Cruise |
| Ocean Cruise |
| Expedition Cruise |
| Theme Cruise |
| Adventure Cruise |
| Others |
| 1-7 Days |
| 8-14 Days |
| 15-20 Days |
| More than 21 Days |
| Less than 12 Years |
| 13-19 Years |
| 20-39 Years |
| 40-59 Years |
| Above 60 Years |
| North America | Canada |
| United States | |
| Mexico | |
| South America | Brazil |
| Peru | |
| Chile | |
| Argentina | |
| Rest of South America | |
| Europe | United Kingdom |
| Germany | |
| France | |
| Spain | |
| Italy | |
| BENELUX (Belgium, Netherlands, and Luxembourg) | |
| NORDICS (Denmark, Finland, Iceland, Norway, and Sweden) | |
| Rest of Europe | |
| Asia-Pacific | India |
| China | |
| Japan | |
| Australia | |
| South Korea | |
| South East Asia (Singapore, Malaysia, Thailand, Indonesia, Vietnam, and Philippines) | |
| Rest of Asia-Pacific | |
| Middle East and Africa | United Arab Emirates |
| Saudi Arabia | |
| South Africa | |
| Nigeria | |
| Rest of Middle East and Africa |
| By Type | River Cruise | |
| Ocean Cruise | ||
| Expedition Cruise | ||
| Theme Cruise | ||
| Adventure Cruise | ||
| Others | ||
| By Duration | 1-7 Days | |
| 8-14 Days | ||
| 15-20 Days | ||
| More than 21 Days | ||
| By Passenger Age | Less than 12 Years | |
| 13-19 Years | ||
| 20-39 Years | ||
| 40-59 Years | ||
| Above 60 Years | ||
| By Geography | North America | Canada |
| United States | ||
| Mexico | ||
| South America | Brazil | |
| Peru | ||
| Chile | ||
| Argentina | ||
| Rest of South America | ||
| Europe | United Kingdom | |
| Germany | ||
| France | ||
| Spain | ||
| Italy | ||
| BENELUX (Belgium, Netherlands, and Luxembourg) | ||
| NORDICS (Denmark, Finland, Iceland, Norway, and Sweden) | ||
| Rest of Europe | ||
| Asia-Pacific | India | |
| China | ||
| Japan | ||
| Australia | ||
| South Korea | ||
| South East Asia (Singapore, Malaysia, Thailand, Indonesia, Vietnam, and Philippines) | ||
| Rest of Asia-Pacific | ||
| Middle East and Africa | United Arab Emirates | |
| Saudi Arabia | ||
| South Africa | ||
| Nigeria | ||
| Rest of Middle East and Africa | ||


Key Questions Answered in the Report
How large is the Cruise Tourism market in 2026?
It is valued at USD 203.79 billion in 2026, with a forecast to reach USD 279.76 billion by 2031.
What is the expected growth rate for cruise tourism through 2031?
The market is projected to expand at a 6.55% CAGR from 2026 to 2031.
Which cruise segment is growing the fastest?
Expedition cruises are forecast to grow at a 10.12% CAGR, making them the fastest-expanding segment.
Why is Asia-Pacific important for cruise operators?
Asia-Pacific is projected to post an 10.78% CAGR due to middle-class expansion and large-scale port investments, making it the primary growth engine.
How are environmental regulations affecting cruise lines?
IMO 2030 and EU ETS rules are adding retrofit costs of USD 15-25 million per ship and raising fuel expenses, pressuring operating margins.
What technological trends are shaping passenger experience?
Investments in AI-enhanced services, wearable devices, and high-speed Wi-Fi are elevating personalization and onboard spending.
Page last updated on:


