Canada Travel And Tourism Market Size and Share
Market Overview
| Study Period | 2021 - 2031 |
|---|---|
| Forecast Data Period | 2026 - 2031 |
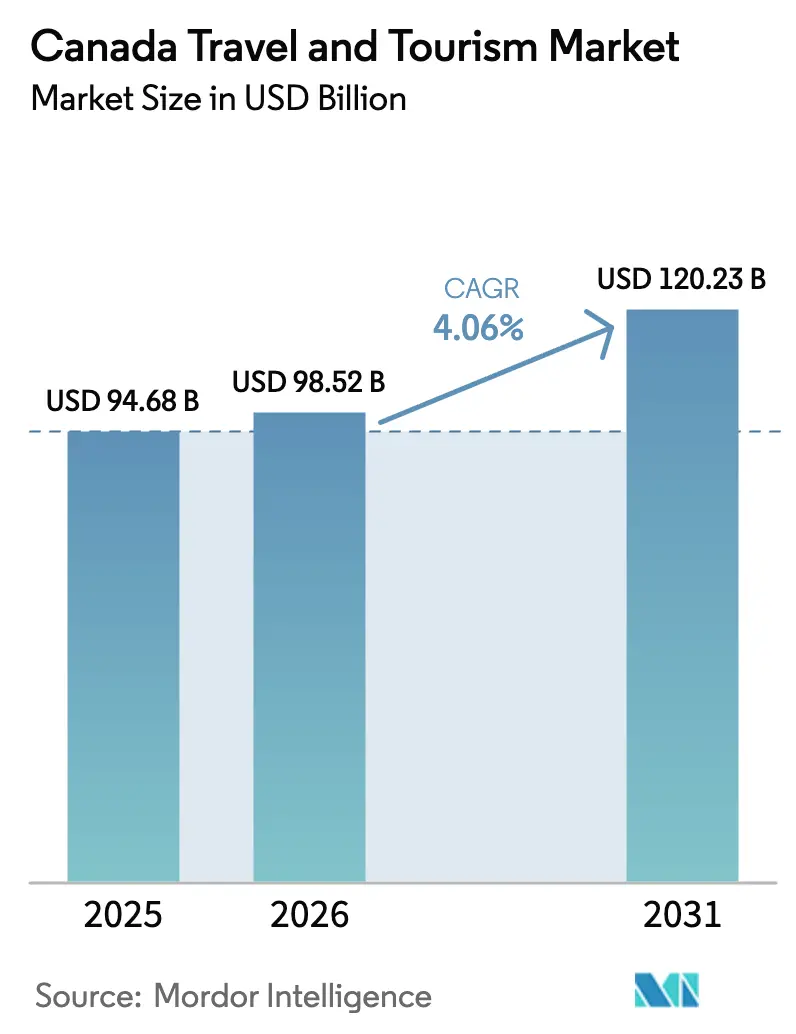
| Base Year Market Size (2025) | USD 94.68 Billion |
| Market Size (2026) | USD 98.52 Billion |
| Market Size (2031) | USD 120.23 Billion |
| Growth Rate (2026 - 2031) | 4.06% CAGR |
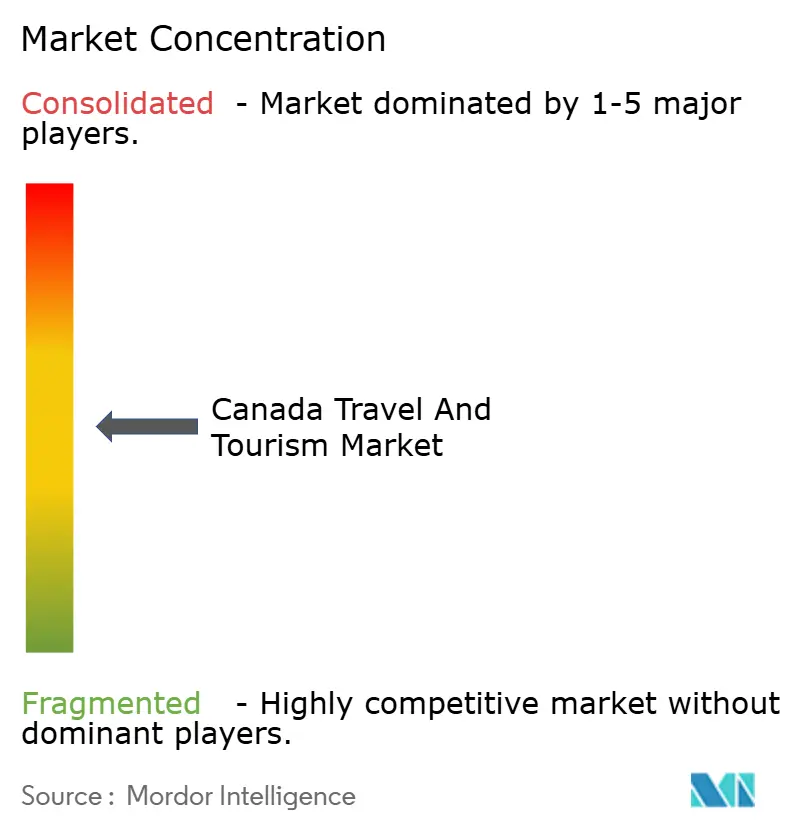
| Market Concentration | Medium |
Major Players *Disclaimer: Major Players sorted in no particular order Image © Mordor Intelligence. Reuse requires attribution under CC BY 4.0. | |
Canada Travel And Tourism Market Analysis by Mordor Intelligence
The Canada Travel and Tourism Market size is expected to grow from USD 94.68 billion in 2025 to USD 98.52 billion in 2026 and is forecast to reach USD 120.23 billion by 2031 at a 4.06% CAGR over 2026-2031. Growth is supported by the federal Tourism Growth Strategy 2030, which commits USD 108 million through 2028 to regional infrastructure, workforce skills, and destination development, including an allocation for Indigenous-led initiatives[1]Innovation, Science and Economic Development Canada, “Canada 365, Welcoming the World Every Day,” Government of Canada, ised-isde.canada.ca. Entry streamlining via the eTA policy update in March 2025 reduces friction for vetted long-haul visitors, providing near-term uplift to international arrivals. Capacity constraints at major hubs persist and can moderate upside in the near term, since slot allocation at congested airports remains a barrier for new carriers and limits incremental seats even when demand is strong.
Key Report Takeaways
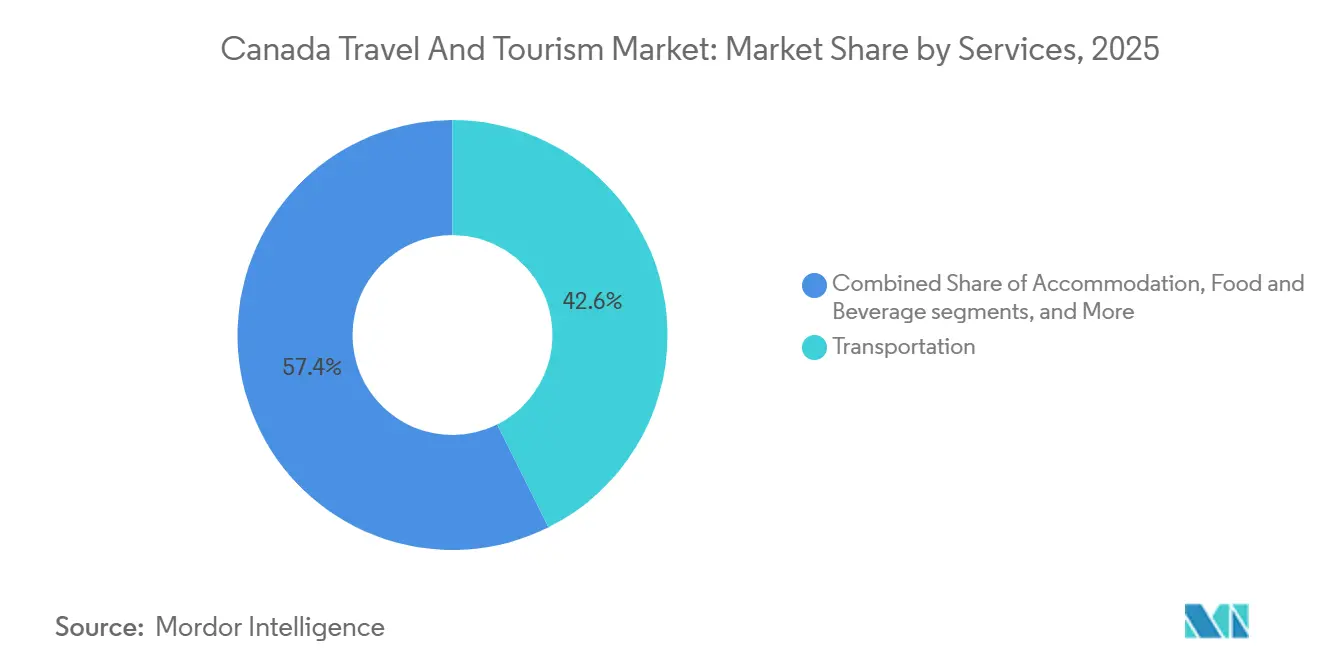
- By services, Transportation led with 42.63% of Canada travel and tourism market in 2025, while Others expanded at a 5.10% CAGR through 2031.
- By type, Holiday and Leisure held 45.27% of Canada travel and tourism market in 2025, while Adventure and Eco-Tourism recorded a 5.37% CAGR through 2031.
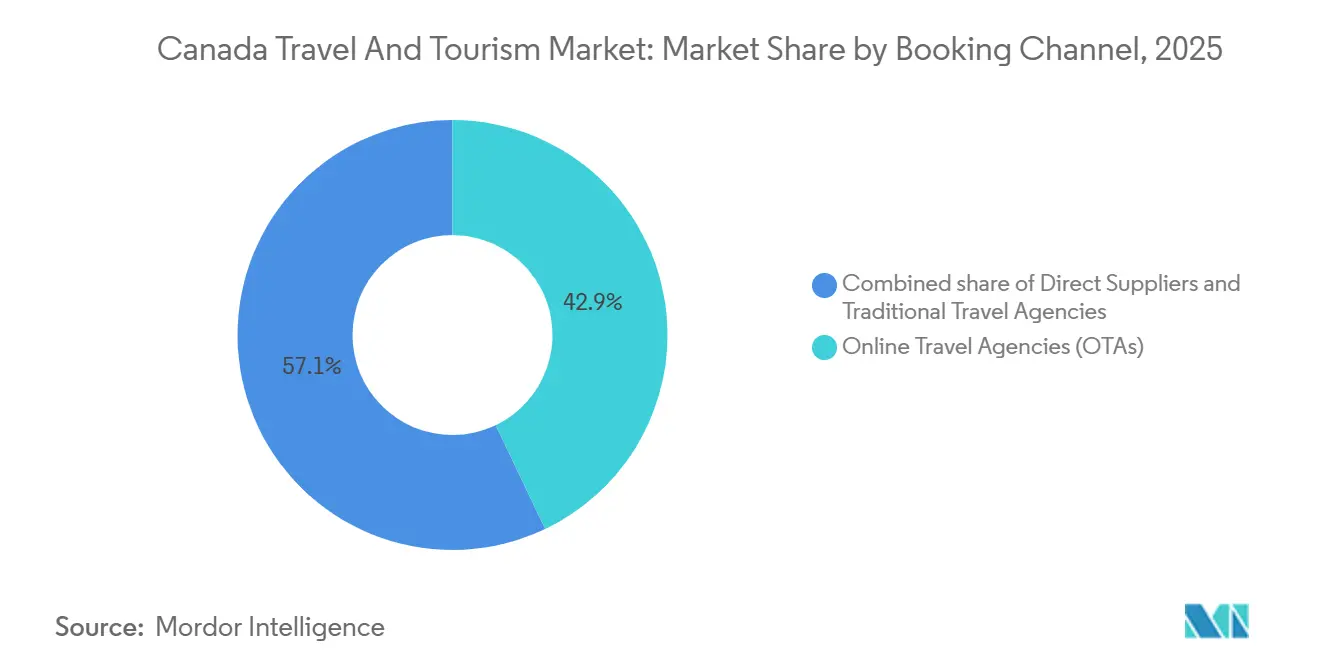
- By booking channel, Online Travel Agencies accounted for 42.95% of Canada travel and tourism market in 2025 and grew at a 5.01% CAGR through 2031.
- By tourist origin, Domestic Residents represented 76.07% of Canada travel and tourism market in 2025, while International Arrivals advanced at a 5.13% CAGR through 2031.
- By geography, Ontario held 43.40% of Canada travel and tourism market in 2025, while British Columbia recorded a 5.17% CAGR through 2031.
Note: Market size and forecast figures in this report are generated using Mordor Intelligence’s proprietary estimation framework, updated with the latest available data and insights as of January 2026.
Canada Travel And Tourism Market Trends and Insights
Drivers Impact Analysis*
| Driver | (~) % Impact on CAGR Forecast | Geographic Relevance | Impact Timeline |
|---|---|---|---|
| E-visa and eTA expansion boosting long-haul arrivals | +0.3% | National, with early gains in Vancouver, Toronto, Montreal | Short term (≤ 2 years) |
| Weaker Canadian currency attracting United States and European tourists | +0.2% | National, border regions, major cities | Short term (≤ 2 years) |
| Federal Tourism Growth Strategy 2030 capital investments | +0.2% | National, rural, Indigenous communities | Medium term (2-4 years) |
| Rise of Indigenous-led experiential tourism | +0.2% | Northern Canada, BC, Alberta, Quebec | Medium term (2-4 years) |
| Growth of the luxury remote-lodge segment | +0.1% | Northern Canada, BC, Quebec wilderness areas | Long term (≥ 4 years) |
| Airline-rail intermodal partnerships facilitating multi-city itineraries | +0.1% | Quebec-Toronto corridor, major hubs | Short term (≤ 2 years) |
| Source: Mordor Intelligence | |||
E-Visa and eTA Expansion Boosting Long-Haul Arrivals
Canada removed the eTA requirement on March 15, 2025, for low-risk travelers who held a Canadian visa in the last decade or possess a valid United States non-immigrant visa, eliminating what the government identified as a barrier to travel that deterred last-minute bookings and created frustration. This exemption applies to an estimated 200,000 to 300,000 visitors annually and is projected to generate USD 1.6 billion in new tourism revenue over ten years by simplifying entry for markets with established security credentials. Faster front-end processing on established channels also supports higher conversion from last-minute intent to confirmed bookings for long-haul trips[2]“Regulations Amending the Immigration and Refugee Protection Regulations,” Canada Gazette, gazette.gc.ca. The change aligns with an industry focus on attracting premium travelers who favor streamlined document checks and predictable arrivals. The policy move pairs with airline capacity redeployments toward overseas markets, which together lift the Canada travel and tourism market by improving the throughput from high-propensity origin countries.
Weaker Canadian Dollar Attracting United States and European Tourists
A weaker Canadian dollar improves inbound price attractiveness for United States and European visitors, which supports recovery in long-haul traffic and leisure spend. Monthly data for late 2025 indicates momentum in international air arrivals, suggesting currency tailwinds that enhance hotel and dining value propositions for foreign guests. Airlines are leaning into this demand mix by adding transatlantic and transpacific routes, which extend choice and raise seat capacity on high-yield corridors. Destination marketing efforts use this window to position Canada as a strong value destination while emphasizing responsible travel and community outcomes. As macro conditions stabilize, the currency channel remains a near-term driver for the Canada travel and tourism market since it compresses effective costs and encourages longer stays by international visitors.
Federal Tourism Growth Strategy 2030 Capital Investments
The Tourism Growth Strategy channels USD 108 million across 2025 to 2028 into infrastructure, workforce training, and destination development with a reserve for Indigenous-led projects, which increases supply quality and disperses demand beyond major hubs. Regional agencies such as PacifiCan are focusing on outdoor recreation and season extension products to spread visitor flows more evenly and strengthen tourism in smaller communities. Quebec's parallel Stratégie de croissance durable du tourisme 2025-2030 earmarks USD 138 million over five years, including USD 80 million for festivals and events to boost international visibility and USD 24 million for tourist attractions, complementing federal outlays[3]“Sustainable Tourism Growth Strategy 2025–2030,” Gouvernement du Québec, tourismeoutaouais.com. Ontario’s Forward Motion playbook targets 4% yearly growth in visitor spending through 2030 by improving transport links, boosting talent pipelines, and attracting investment to destination assets. Transport Canada initiatives on intermodal facilitation and border technologies, along with progress on the Toronto–Montreal corridor, aim to smooth transit experiences and support multicity itineraries in the Canada travel and tourism market.
Rise of Indigenous-Led Experiential Tourism
Indigenous tourism generated USD 1.7 billion in GDP in 2022, yet the sector's 2023 contribution slipped to USD 1.3 billion, below 2014 levels, due to slow pandemic recovery and United States tariff pressures, exposing a decade of lost momentum despite high global demand for authentic cultural experiences. Sustained federal investment and national-level coordination are rebuilding Indigenous tourism, with a landmark seven-year commitment of USD 24.33 million (CAD 35 million) per year that funds market development, workforce measures, and quality accreditation[4]Indigenous Tourism Association of Canada, “2025–26 Operational Plan,” indigenoustourism.ca. The Original Original accreditation program receives dedicated support to expand the roster of certified experiences, which sets trusted standards and enables premium pricing for authentic cultural offerings. Provincial initiatives and targeted grants complement national funding by backing entrepreneurs, facilities, and business capacity in communities with strong visitor potential. Alberta’s organization-led partnerships, programming, and training point to a scalable path where Indigenous operators meet demand for low-impact, high-value experiences. Expanded marketing and distribution will support higher utilization of existing assets and expand inventory in remote regions, which reinforces diversity in the Canada travel and tourism market offering.
Restraints Impact Analysis*
| Restraint | (~) % Impact on CAGR Forecast | Geographic Relevance | Impact Timeline |
|---|---|---|---|
| Chronic hospitality labor shortages | -0.4% | National, acute in resort communities and major cities | Short term (≤ 2 years) |
| Airport slot and runway capacity limits at YYZ and YVR | -0.2% | Toronto, Vancouver, national spillover | Medium term (2-4 years) |
| The rising carbon tax is increasing domestic airfare | -0.1% | National, higher impact on long-distance domestic routes | Short term (≤ 2 years) |
| Overtourism caps in Banff and Niagara | -0.1% | Banff National Park, Niagara Falls region | Medium term (2-4 years) |
| Source: Mordor Intelligence | |||
Chronic Hospitality Labor Shortages
Accommodations and food services continue to report persistent hiring gaps, which compress operating hours and service levels during peak travel periods. Operators respond with automation in front-office workflows and simplified service models, yet these fixes do not fully offset occupancy or wage pressures. Financial strain remains visible in food service, where a large share of establishments operate at slim margins or losses under elevated input and payroll costs. Provincial hotel associations also report soft sentiment for the near term, with many properties planning for steady rather than stronger performance. The labor bottleneck, therefore, caps throughput during demand surges and weighs on the realized growth path for the Canada travel and tourism market.
Airport Slot and Runway Capacity Limits at YYZ and YVR
Slot allocation at Canada’s busiest airports limits entry by new carriers and constrains competitive frequency increases on high-demand routes. Market concentration on key domestic corridors reduces fare competition, and analysis indicates that the addition of a competitor on a route can lower fares, which signals latent demand in constrained markets. User-pay charges such as airport improvement fees and navigation fees are a notable portion of airline cost structures and challenge route economics, especially for new or low-fare entries. Incremental infrastructure upgrades improve safety and operations but do not immediately expand peak slot capacity, so supply growth trails demand growth at major hubs. The effect is a measurable headwind for the Canada travel and tourism market when the appetite for international travel is robust.
*Our forecasts treat driver/restraint impacts as directional, not additive. The impact forecasts reflect baseline growth, mix effects, and variable interactions.
Segment Analysis
By Services: Experiential Spending Outpaces Transportation
Transportation commanded 42.63% of the Canada travel and tourism market share in 2025 as airlines broadened networks and restored long-haul connectivity across transatlantic and transpacific corridors. Air Canada expanded to 126 global destinations for Summer 2026, including new routes from Montreal and Toronto that increase direct access for European and leisure markets. WestJet announced new services from Toronto and Halifax to multiple European capitals that leverage the range of newer narrowbodies for transatlantic operations. These moves lift seat supply on long-haul routes and support broader dispersion of visitors beyond gateway cities. At the same time, the Others category, which includes recreation, entertainment, shopping, and convention fees, is the fastest-growing service line with a 5.10% CAGR through 2031, signaling a steady shift toward experience-led spending in the Canada travel and tourism market.
Accommodation and food services reflect mixed conditions that are improving with targeted programs. Destination British Columbia reports strong sector contributions and job growth, supported by coordinated marketing and product development across regions. Enforcement funding for short-term rentals seeks to rebalance supply toward regulated operators and communities, which is expected to lift compliance and improve market transparency. Food service margins remain under pressure, which influences hours and menu strategies as operators adjust to costs and labor conditions. Passenger rail recovery continues despite weather and labor disruptions, and intermodal programs are expanding the accessible network for visitors. The net effect is a healthier mix that supports the Canada travel and tourism market as experience spending grows faster than pure transport outlays.


By Type: Adventure and Eco-Tourism Surges on Indigenous Momentum
Holiday and leisure travel held 45.27% of the type segmentation in 2025, while Adventure and Eco-Tourism posted the fastest growth at a 5.37% CAGR through 2031. National programs elevate culturally authentic and low-impact itineraries, and the Original Original accreditation helps buyers identify high-quality Indigenous-led products. Provincial strategies fund festivals, attractions, and season extension, which sustain demand outside summer peaks and boost resilience. Business events receive added focus with national funds for convention attraction and venue upgrades in major cities. This blend of leisure and high-yield segments strengthens the Canada travel and tourism market as products evolve toward deeper engagement and responsible travel.
Visiting Friends and Relatives and business travel benefit from demographic and policy tailwinds, including destination marketing and global connectivity. Convention infrastructure projects in key markets unlock capacity for large events and create spillovers to lodging, dining, and attractions. Indigenous tourism organizations prioritize training, accreditation, and market linkages so that community-led offerings scale sustainably. Destination-level coordination supports balanced growth across seasons and geography, which stabilizes yields in a more diverse product mix. Together, these elements support rising share for experience-led travel within the Canada travel and tourism industry while maintaining the core leisure base.
By Booking Channel: OTAs Sustain Digital Dominance
Online Travel Agencies held 42.90% of 2025 bookings and are growing at a 5.01% CAGR, reflecting strong consumer use of aggregators for search, price discovery, and last-minute planning. OTA usage is reinforced by mobile adoption and bundled features that simplify comparison and payment, while suppliers invest in direct channels using loyalty and onboard product improvements. Air Canada enhanced its direct offering in 2025 by upgrading onboard amenities and rolling out fast Wi-Fi in North America to increase differentiation and reinforce direct bookings. Traditional travel agencies maintain a valuable role in complex itineraries and corporate travel where duty-of-care, visa coordination, and negotiated fares matter. The channel mix, therefore, balances aggregator reach with supplier-led experiences, which supports a healthy distribution stack in the Canada travel and tourism market.
Suppliers deploy direct-booking incentives and service guarantees to lift conversion from research to purchase on owned channels. OTAs continue to invest in app experiences and flexible policies that capture short-notice demand and work-cation use cases. Corporate travel revives with a focus on meetings and conventions, raising the importance of agency support and tailored content for planners. The broad adoption of digital tools by small operators is aided by public programs and supplier partnerships that reduce onboarding friction. Combined, these forces keep the Canada travel and tourism industry’s distribution channels dynamic and competitive.
By Tourist Origin: Domestic Resilience Offsets United States Volatility
Domestic Residents accounted for 76.07% of market volume in 2025, underscoring the stabilizing role of intra-provincial and inter-provincial travel. International Arrivals posted the fastest growth at a 5.13% CAGR, buoyed by eTA streamlining and a favorable currency for inbound spend. Monthly data from late 2025 indicates healthy momentum in air arrivals from European and Asian markets, reinforcing the long-haul recovery. United States travel exhibits periodic softness amid broader economic and sentiment factors, while non-United States source markets show more consistent growth. The diversified origin mix supports resilience for the Canada travel and tourism market across economic cycles.
Regional tourism organizations and carriers shape demand by focusing capacity and marketing where recovery is strongest. Distribution strategies and visa policy coordination help convert intent among long-haul travelers, especially those seeking culturally rich and nature-forward itineraries. Targeted investments in regional assets and events improve conversion and length of stay in secondary destinations. The near-term outlook benefits from policy alignment and expanded connectivity that channel global demand into specific Canadian regions. This positioning enhances sustainability in the Canada travel and tourism market as it returns to a steady growth path.
Geography Analysis
Ontario accounted for 43.40% of the Canada travel and tourism market size in 2025, anchored by Toronto’s role in finance, culture, and air connectivity. The province’s Forward Motion strategy targets stronger transport links, talent pipelines, and destination competitiveness to achieve 4% annual growth in visitor spending through 2030. British Columbia is forecast to outpace peers with a 5.17% CAGR through 2031 as investments favor responsible travel and season extension in diverse regions, including the Southern Gulf Islands and Boundary Country. Quebec recorded a strong 2025 with higher visitor spending in the Quebec City region and strong performance from domestic and rest-of-Canada travelers. Provincial plans emphasize culture-led differentiation and coordinated promotion in priority international markets.
Northern Canada is smaller by volume but strategic due to aurora tourism, wildlife expeditions, and Indigenous partnerships supported by federal funding pathways that can reach up to USD 6 million per project. Luxury ecolodges in remote areas leverage safety records and exclusive access to justify premium pricing, which attracts high-yield guests from global markets. Atlantic Canada benefits from domestic travel shifts and cruise activity that extend the season beyond summer, supported by regional marketing and port infrastructure. Federal and provincial strategies converge on dispersing demand, which reduces pressure at saturated sites and spreads economic impact. The geography mix, therefore, underpins risk-balanced growth in the Canada travel and tourism market.
A comparison of pre- and post-recovery dynamics shows a gradual rebalancing toward western and northern growth corridors as policy and capital investments align with community goals. Ontario and Quebec continue to anchor total volumes due to hubs and venue scale, while British Columbia and Northern Canada deliver faster rates under newer product pipelines. This pattern enhances resilience by diversifying seasonality and origin markets across provinces. The Canada travel and tourism market benefits from broader access created by new international routes and intermodal connectivity that reduce total journey time. The policy framework supports balanced development that aligns with environmental stewardship and community priorities.
Competitive Landscape
The Canada travel and tourism market features moderate concentration at the platform and airline layers, with fragmentation across lodging and tours. Air Canada and WestJet continue to anchor domestic capacity while broadening international networks that expand access and choice for inbound travelers. Air Canada’s 2026 network includes new nonstop routes across Europe, which support dispersion beyond major hubs and strengthen access to secondary Canadian destinations. WestJet’s Summer 2026 additions through Toronto and Halifax focus on price-sensitive transatlantic leisure flows, leveraging efficient narrowbodies. Premium hotel brands invest in growth corridors with new signings and redevelopments that add keys and elevate product diversity.
Partnerships and alliances sustain reach and improve the service proposition across customer journeys. Intermodal and codeshare initiatives increase effective connectivity to secondary cities without requiring new airport slots. Venue expansions and business events funding support higher-value travel in major markets and catalyze upgrades in adjacent segments. Operators deploy data-driven pricing and loyalty benefits to protect share and encourage direct booking, while OTAs continue to scale mobile and app-led experiences. These moves keep the Canada travel and tourism market competitive while widening consumer choice.
Investment activity targets mixed-use hospitality and convention-linked assets that drive sustained visitation. IHG’s introduction of voco hotels in Canada adds a premium soft brand that fits urban downtown redevelopment and suburban demand nodes. Air Transat continues to refine long-haul leisure capacity with new routes that connect Quebec travelers to new destinations. Regional connectivity strengthens through extended commercial agreements that deploy efficient turboprops across Eastern Canada and Quebec. Continued alignment between aviation, lodging, and destination marketing supports a path for steady share gains in the Canada travel and tourism market.
Indigenous enterprises gain visibility through preferential procurement provisions and dedicated marketing budgets, complicating traditional competitive hierarchies. Grants for cultural experience development underwrite new entrants, thereby enriching the product mix inside the Canada travel and tourism market. Transport Canada’s supply-chain investments tilt advantage toward carriers that can interline rail and air segments, while hotel groups exploit loyalty ecosystems to capture direct bookings. Despite selective consolidation waves, independent operators remain influential, ensuring a balanced structure within the Canada travel and tourism market.
Canada Travel And Tourism Industry Leaders
Air Canada
Expedia Group
Marriott International
WestJet Airlines Ltd
Accor SA
- *Disclaimer: Major Players sorted in no particular order

Recent Industry Developments
- January 2026: Air Canada and PAL Airlines extended and expanded their regional partnership: Air Canada extended its commercial agreement with PAL Airlines to 2032, increasing the number of Dash 8-400 aircraft to eleven to enhance services in Eastern Canada and Québec.
- January 2026: Choice Hotels International expanded its Canadian footprint with six new Ascend Collection properties: Choice Hotels International announced six new Ascend Collection properties in Québec, increasing the brand’s presence in the region by around 20% with openings planned for early 2026.
- November 2025: Air Transat announced a nonstop Montreal–Agadir service for summer 2026. This made it the only North American airline offering direct flights to Agadir and increased frequencies on several transatlantic routes.
- December 2025: Air Transat announced a new direct weekly service between Toronto (YYZ) and Tirana, Albania, marking the first direct connection between North America and Albania in its summer 2026 program.


Research Methodology Framework and Report Scope
Market Definitions and Key Coverage
Our study defines the Canadian travel and tourism market as all domestic and inbound visitor spending on passenger transport, commercial lodging, food and beverage consumed away from home, recreation and attraction tickets, and commissions retained by online or offline travel intermediaries, expressed in constant 2024 USD. We include leisure, business, VFR, and niche segments such as adventure or wellness trips.
Scope exclusion: figures do not cover duty-free retail sales or tourism-linked real-estate transactions.
Segmentation Overview
- Market Size and Growth Rates By Services
- Transport
- By Mode of Transport
- Air
- Road
- Rail
- Water (Cruise and Ferries)
- By Mode of Transport
- Accommodation
- Hotels and Motels
- Vacation Rentals and Home-Sharing
- Hostels and Budget Lodging
- Campgrounds and RV Parks
- Food & Beverages
- Others (Recreation & entertainment, shopping expenses, convention fees, and others)
- Transport
- Market Size and Growth Rates by Type
- Holiday/Leisure
- Visiting Friends & Relatives
- Business Travel
- Adventure and Eco-Tourism
- Market Size and Growth Rates by Booking Channel
- Online Travel Agencies (OTAs)
- Direct Supplier (Airline/Hotel Websites)
- Traditional Travel Agencies
- Market Size and Growth Rates by Tourist Origin
- Domestic Residents
- International Arrivals
- Market Size and Growth Rates by Geography
- Ontario
- Quebec
- British Columbia
- Northern Canada
- Others
Detailed Research Methodology and Data Validation
Primary Research
Mordor analysts hold structured interviews with senior officials at provincial tourism boards, revenue managers at chain and independent hotels, OTAs operating in Toronto and Vancouver, and airline network planners. Insights on evolving booking windows, average party size, and capacity constraints let us check secondary ratios and adjust assumptions where necessary.
Desk Research
We begin with structured pulls from Statistics Canada's National Tourism Indicators, Destination Canada's Tourism Data Collective, the World Travel & Tourism Council EIR, UN Tourism arrivals series, and provincial economic accounts to ground the base year. Company filings, airport authority traffic releases, and press coverage aggregated through Dow Jones Factiva add timely rate and volume signals.
Next, analysts mine trade association dashboards such as the Indigenous Tourism Association of Canada and airline load-factor reports, and then interrogate D&B Hoovers for carrier and hotel revenue splits that help refine segment weights. These sources, among others, provide the foundation; many additional public and paid repositories were consulted for gap-filling and validation.
Market-Sizing & Forecasting
We reconstruct 2024 spend using a top-down production and trade framework anchored on National Tourism Indicator totals, converted from CAD using the Bank of Canada annual rate, which are then corroborated with selective bottom-up roll-ups of sampled ADR × room-night, passenger yield × enplanement, and park ticket volumes. Key variables tracked include overnight trip counts, average stay length, real disposable income, USD/CAD exchange, eTA issuances, and ADR trend, each forecast through 2030. A multivariate regression model, stress tested with scenario analysis around the 2026 FIFA World Cup and carbon pricing shifts, generates the CAGR, while missing micro inputs are interpolated from provincial shares before being peer reviewed internally.
Data Validation & Update Cycle
Outputs pass three tiers of checks: variance flags versus historic series, cross-market sanity scans, and senior analyst sign-off. Reports refresh annually and are rerun mid-cycle if material shocks, such as regulatory fee hikes or border policy shifts, alter underlying drivers. Clients receive the freshly validated file each time.
Why Our Canada Travel And Tourism Baseline Commands Reliability
Published estimates often diverge because firms choose different spend buckets, exchange rate conventions, or refresh cadences.
Key gap drivers here stem from whether totals cover retail shopping, how GDP impacts are treated, and the currency year locked in at conversion. Mordor's definition centers strictly on traveler outlays on core trip services, uses constant 2024 USD, and refreshes every twelve months, which together produce a balanced, repeatable baseline.
Benchmark comparison
| Market Size | Anonymized source | Primary gap driver |
|---|---|---|
| USD 90.09 B (2025) | Mordor Intelligence | - |
| USD 130 B (2024) | Regional Consultancy A | Counts all direct visitor spending, including duty-free retail, and reports in current CAD without currency normalization |
| USD 169 B (2024) | Industry Association B | Measures tourism GDP contribution rather than gross spend, inflating headline figure |
| USD 62.2 B (2022) | Trade Journal C | Uses narrow revenue lines, excludes foodservice and attraction receipts, and reflects pandemic-era base year |
The comparison shows that scope width, metric choice, and exchange rate treatment explain most gaps. By grounding totals in transparent variables and a disciplined twelve-month update rhythm, Mordor Intelligence delivers a dependable starting point for strategic decisions.


Key Questions Answered in the Report
What is the 2026 size and 2031 outlook for Canada travel and tourism?
The Canada travel and tourism market size is USD 98.52 billion in 2026 and is projected to reach USD 120.23 billion by 2031 at a 4.06% CAGR.
Which segments are growing the fastest through 2031 in Canada's travel and tourism?
Adventure and Eco-Tourism lead type growth at a 5.37% CAGR, the Others service category grows at 5.10%, and Online Travel Agencies expand at 5.01% through 2031.
How will recent policy changes influence inbound travel to Canada in 2026?
The eTA exemption adopted on March 15, 2025, simplifies entry for vetted travelers and supports stronger long-haul arrivals. The federal Tourism Growth Strategy commits USD 108 million through 2028, with 15% reserved for Indigenous-led initiatives, which strengthens capacity and disperses demand.
Which province leads in destinations and which is set to grow the fastest by 2031?
Ontario held 43.40% of the destination share in 2025. British Columbia is projected to grow at a 5.17% CAGR through 2031.
How do domestic and international travelers contribute to Canada's tourism recovery in 2026?
Domestic residents represented 76.07% of volume in 2025, providing a stable base across provinces. International arrivals are the fastest growing at a 5.13% CAGR through 2031, aided by streamlined entry and a weak Canadian dollar.
What constraints should executives monitor for Canada travel and tourism in 2026?
Key headwinds include hospitality labor shortages and airport slot constraints at Toronto Pearson and Vancouver International that limit capacity additions. Overtourism controls at Banff and Niagara, and the industrial carbon pricing framework may cap throughput in the near term.
Page last updated on:


