Bleisure Travel Market Size and Share
Market Overview
| Study Period | 2019 - 2030 |
|---|---|
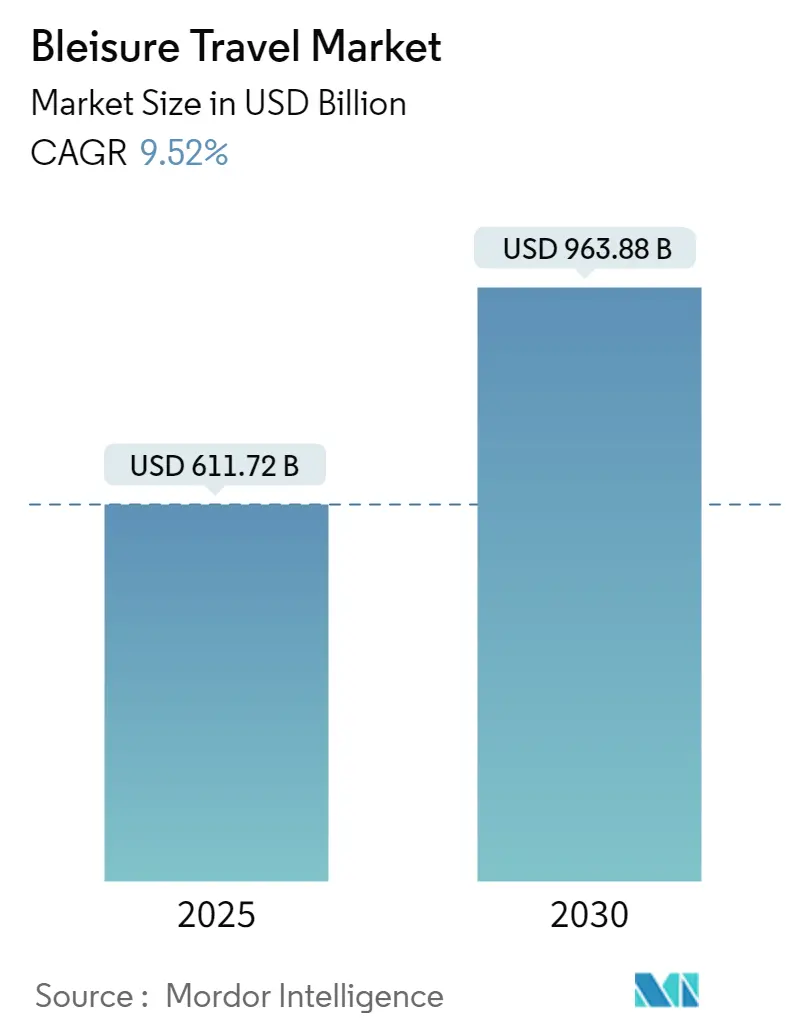
| Market Size (2025) | USD 611.72 Billion |
| Market Size (2030) | USD 963.88 Billion |
| Growth Rate (2025 - 2030) | 9.52% CAGR |
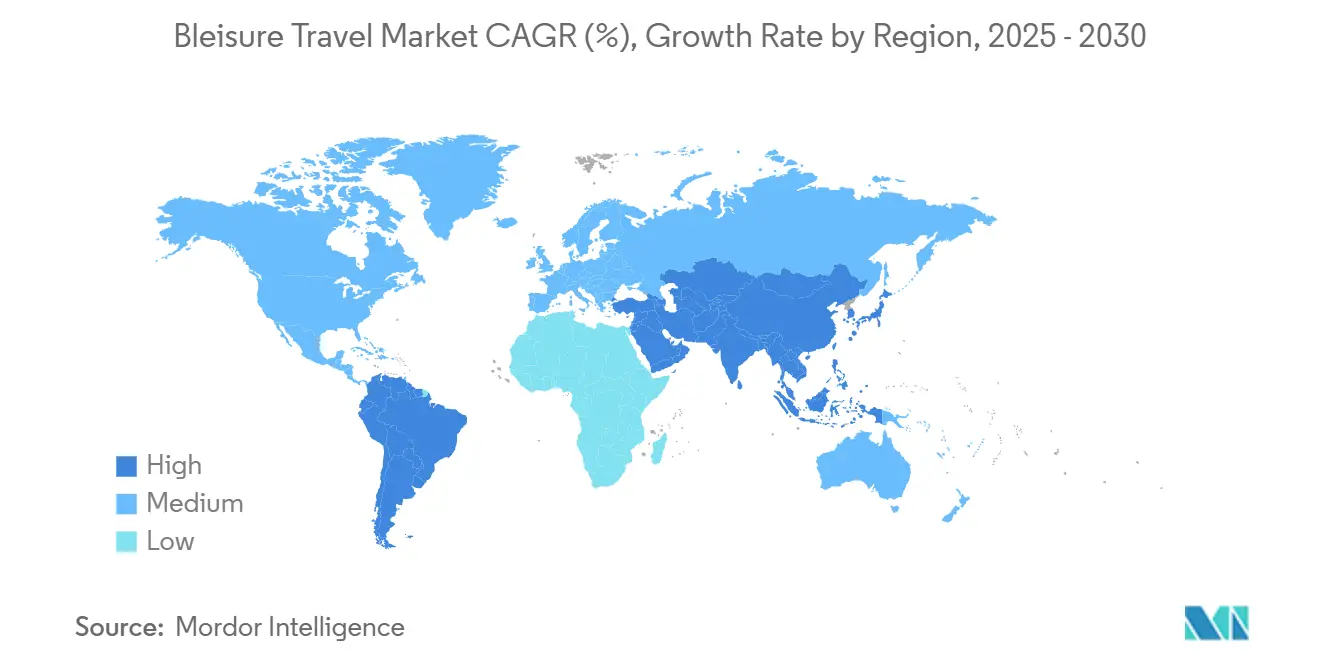
| Fastest Growing Market | Asia Pacific |
| Largest Market | Europe |
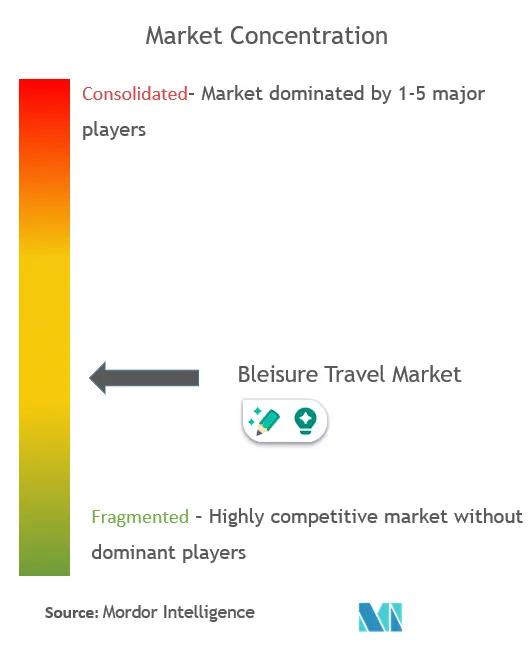
| Market Concentration | Medium |
Major Players *Disclaimer: Major Players sorted in no particular order Image © Mordor Intelligence. Reuse requires attribution under CC BY 4.0. | |
Bleisure Travel Market Analysis by Mordor Intelligence
The bleisure travel market is valued at USD 611.72 billion in 2025 and is forecast to reach USD 963.88 billion by 2030, registering a 9.5% CAGR during the period. Employers worldwide are reshaping travel policies to blend productivity and personal time, travelers are leveraging digital tools to tack vacation days onto work trips, and destinations are packaging attractions around meeting venues to secure incremental spend. Faster visa approval channels, extensive airport and rail upgrades, and corporate emphasis on employee well-being all act in concert to expand the bleisure travel market footprint. Demand benefits further from a millennial cohort that routinely mixes business with leisure and from growing interest among Gen Z and Boomer professionals who now view extended stays as a route to richer experiences. Technology platforms have simplified multi-stop bookings, and loyalty ecosystems reward longer stays, reinforcing a virtuous growth cycle that underpins aggressive revenue projections through 2030.
Key Report Takeaways
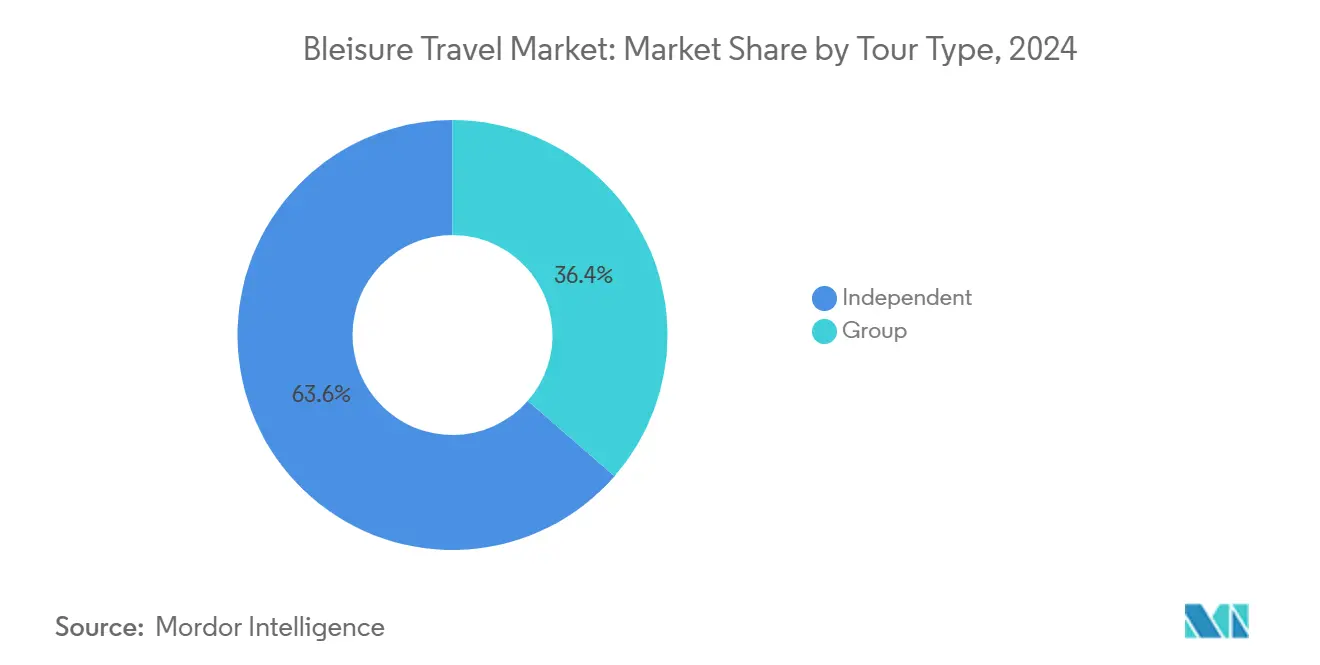
- By tour type, independent travelers led with 63.55% bleisure travel market share in 2024, while group tours are projected to expand at an 11.85% CAGR through 2030.
- By trip type, domestic travel held 71.23% of the bleisure travel market size in 2024; international trips are advancing at an 11.03% CAGR to 2030.
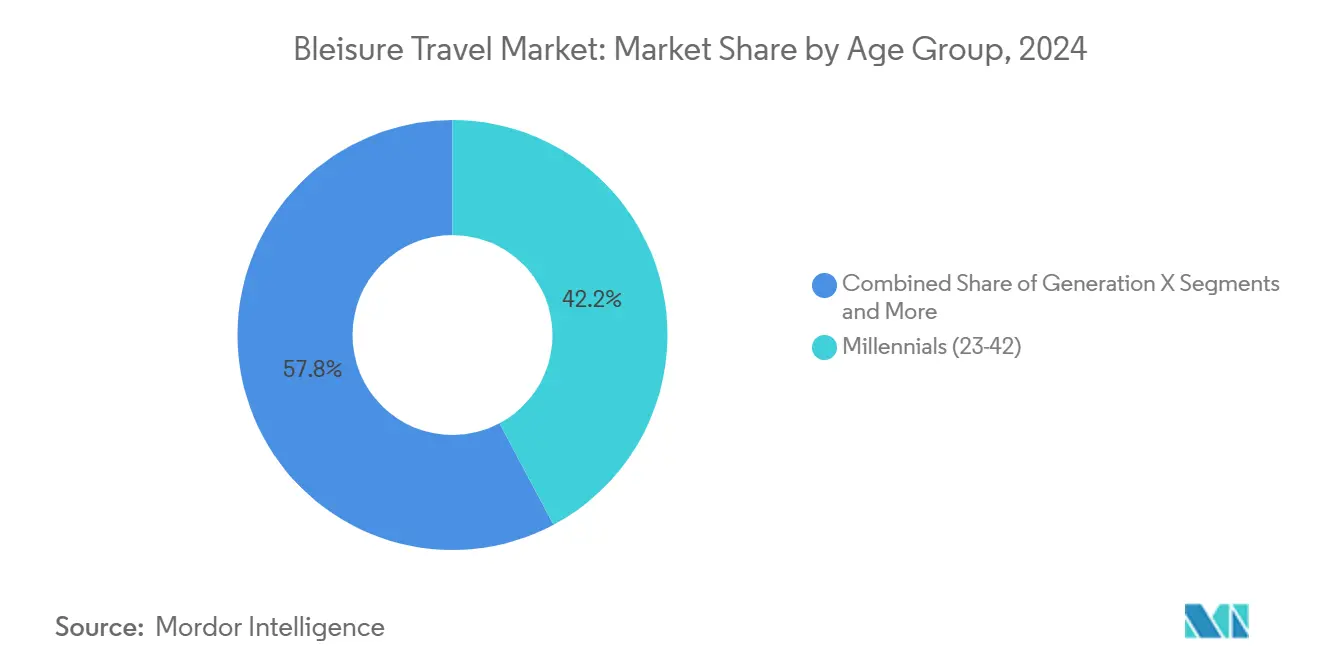
- By age group, millennials captured 42.21% of 2024 revenue; the Gen Z and Boomer cohort posts the fastest growth at a 12.61% CAGR.
- By industry vertical, the corporate segment commanded 66.85% share of the bleisure travel market size in 2024, while government travel is increasing at an 11.95% CAGR.
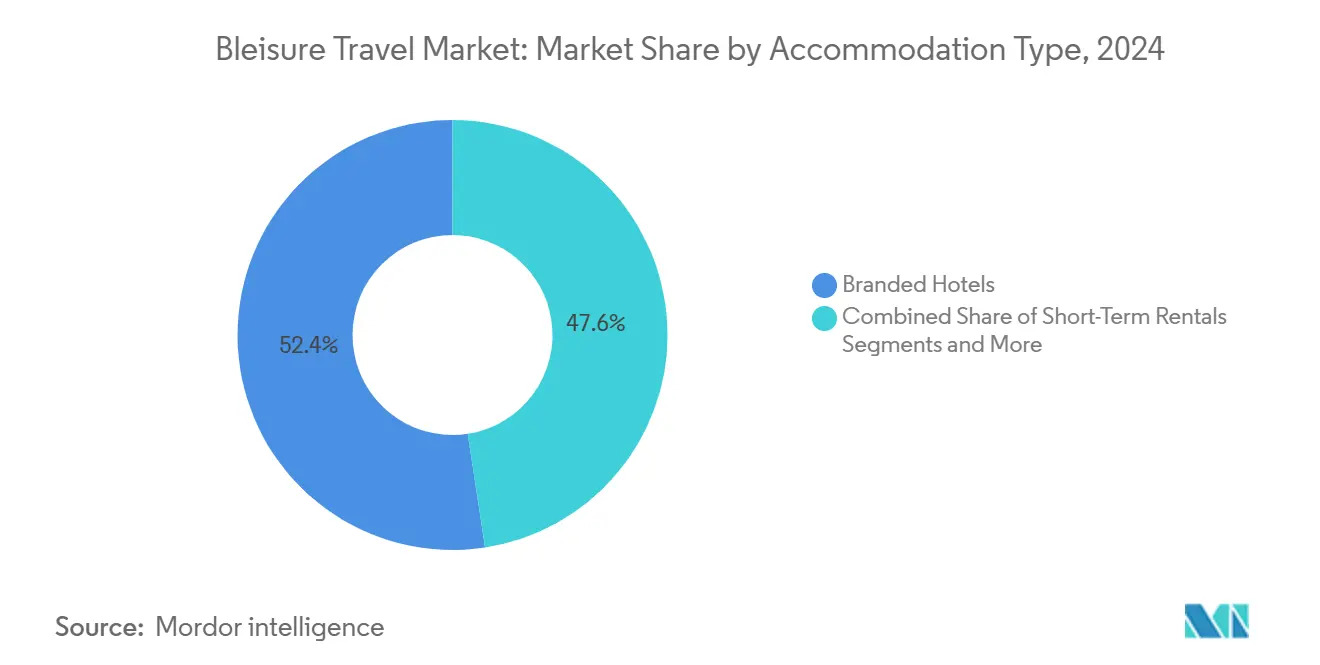
- By accommodation type, branded hotels accounted for 58.11% revenue share in 2024; serviced apartments are accelerating at a 12.31% CAGR.
- By booking channel, OTAs represented 47.25% of 2024 bookings, and direct corporate portals are scaling at a 12.75% CAGR.
- Geographically, Europe led with 30.51% bleisure travel market share in 2024, whereas Asia Pacific is set to expand at a 10.01% CAGR through 2030.
- Expedia Group Inc., Booking Holdings Inc., Airbnb Inc., BCD Group, and Amex GBT together controlled significant market share in 2024 revenue.
Global Bleisure Travel Market Trends and Insights
Drivers Impact Analysis*
| Driver | (~) % Impact on CAGR Forecast | Geographic Relevance | Impact Timeline |
|---|---|---|---|
| Rising demand for work-life balance among global knowledge workers | 2.1% | Global, with highest impact in North America and Europe | Medium term (2-4 years) |
| Expansion of flexible remote-work policies enabling leisure extensions | 2.3% | Global, with early adoption in technology and consulting sectors | Medium term (2-4 years) |
| Supportive corporate travel policies integrating leisure add-ons | 1.8% | North America, Europe, and developed APAC markets | Short term (≤ 2 years) |
| Destination marketing of "bleisure-ready" cities & visa-light regimes | 1.5% | Global, with concentrated impact in emerging tourism hubs | Medium term (2-4 years) |
| Source: Mordor Intelligence | |||
Rising Demand for Work-Life Balance Among Global Knowledge Workers
Professionals seek trips that yield both career value and personal enrichment, compelling companies to adopt policies that enable leisure add-ons. North American and European firms have started to advertise bleisure flexibility as an employment benefit, and the U.S. Travel Association notes that blended travel helps support more than 20 million domestic jobs[1]Source: U.S. Department of Transportation, “National Travel and Tourism Infrastructure Strategic Plan,” transportation.gov. Longer stays translate into higher spending on culture, dining, and local transport, broadening revenue streams for urban economies and reinforcing the bleisure travel market appeal.
Expansion of Flexible Remote-Work Policies Enabling Leisure Extensions
Hybrid work unlocks the possibility to remain productive from hotels, cafés, or co-working lounges, dissolving the boundary between a business meeting and vacation time. Asia-Pacific Economic Cooperation (APEC) ministers report a clear uptick in demand for stays that combine work with leisure pursuits. The bleisure travel market expands because travel eligibility now spans junior staff as well as executives, boosting trip volumes and average stay lengths.
Supportive Corporate Travel Policies Integrating Leisure Add-Ons
Organizations formalize rules that permit personal-expense nights, clarify insurance coverage for extended stays, and embed leisure filters in booking systems. The U.S. Department of Commerce highlights partnership programs that encourage policy innovation, noting gains in employee retention where flexibility is offered[2]Source: U.S. Travel Association, “Monthly Travel Data Report,” ustravel.org. Immediate improvement in traveler satisfaction drives early adoption, amplifying near-term growth.
Destination Marketing of “Bleisure-Ready” Cities and Visa-Light Regimes
Tourism boards publicize business districts situated near cultural landmarks and streamline e-visa channels tailored to delegates who extend trips. The U.S. Travel Association advocates a National Vetting Service to accelerate document processing, thereby reinforcing America’s pull for bleisure trips (ustravel.org). Similar programs in Europe and the Middle East further extend the bleisure travel market by slashing administrative friction.
Restraints Impact Analysis*
| Restraint | (~) % Impact on CAGR Forecast | Geographic Relevance | Impact Timeline |
|---|---|---|---|
| Stringent corporate travel policies in risk-averse sectors | -1.2% | Global, with highest impact in regulated industries | Medium term (2-4 years) |
| Budget constraints amid post-pandemic cost controls | -1.5% | Global, with varying impact based on economic conditions | Short term (≤ 2 years) |
| Limited itinerary time windows for leisure add-ons | -0.9% | Global, with higher impact in high-pressure work cultures | Short term (≤ 2 years) |
| Health & safety concerns in high-risk destinations | -0.7% | Regional, concentrated in emerging markets with security challenges | Medium term (2-4 years) |
| Source: Mordor Intelligence | |||
Stringent Corporate Travel Policies in Risk-Averse Sectors
Despite the overall trend toward flexibility, many organizations in regulated industries maintain strict travel policies that limit opportunities for bleisure extensions. These policies often require direct returns from business destinations, prohibit mixing personal and business expenses, and impose rigid itinerary requirements. The U.S. Travel Association's monthly travel data report indicates mixed performance across different sectors, reflecting varying levels of policy flexibility.
Budget Constraints Amid Post-Pandemic Cost Controls
Inflationary pressures and tighter profit margins force many firms to trim trip frequency, cabin class, or duration. OECD tourism analysis notes that policymakers and corporations alike remain cautious about escalating travel costs[3]Source: Organisation for Economic Co-operation and Development, “Tourism Trends and Policies 2024,” oecd.org. Lower per-trip budgets shorten stays and discourage additional companions, tempering the market’s expansion in the near term even as overall demand returns to pre-pandemic volume.
*Our forecasts treat driver/restraint impacts as directional, not additive. The impact forecasts reflect baseline growth, mix effects, and variable interactions.
Segment Analysis
By Tour Type: Independent Travelers Drive Market Volume
Independent travelers commanded 63.55% bleisure travel market share in 2024 and routinely attach two to three personal nights to business itineraries. Mobile booking apps, user reviews, and real-time maps drive self-service planning, while loyalty-linked discounts make spontaneous extensions affordable. These factors safeguard this segment’s dominance and keep the bleisure travel industry vibrant.
Group tours constituted 36.45% of 2024 trips yet are projected to grow at an 11.85% CAGR. Corporate retreats, incentive trips, and conference side tours fuel expansion as organizers curate efficient schedules, easing planning for time-pressed employees. Increased MICE activity globally supports this fast-growing slice of the bleisure travel market.


By Trip Type: Domestic Dominance with International Acceleration
Domestic journeys accounted for 71.23% of the bleisure travel market size in 2024, leveraging the convenience of rail and highway systems along with consistent corporate rate programs. Companies favor domestic destinations to limit carbon footprints and streamline approvals, while travelers appreciate flexible change policies.
International trips, 28.77% in 2024, advance at an 11.03% CAGR, benefitting from relaxed entry rules and expanded air corridors. Renewed global client engagement prompts executives to explore cultural landmarks near project sites, pushing up the bleisure travel market size for cross-border travel.
By Age Group: Millennials Lead While Gen Z and Boomers Surge
Millennials captured 42.21% of 2024 revenue and average 3.1 blended trips a year. Their appetite for authentic experiences drives hotels to offer local experiences and late checkout perks that solidify loyalty.
Generation X, 30.79% of travelers, values time efficiency yet still adds short leisure periods around essential meetings. Meanwhile, Gen Z and Boomer professionals, grouped in the 27% “Others” share, are growing fastest at 12.61% CAGR. Flexible study schedules for Gen Z and phased retirement for Boomers collectively broaden the bleisure travel market audience.
By Industry Vertical: Corporate Dominance with Government Growth
Corporate travel formed 66.85% of industry spending in 2024, reflecting large multinational itineraries, partner summits, and client site visits. HR departments showcase flexible trip policies as recruitment differentiators, and technology consultancies especially advocate blended travel.
Government travel, holding 33.15% of 2024 revenue, is expanding at an 11.95% CAGR. Public agencies integrate multiple site inspections into a single itinerary, cutting unit costs and meeting sustainability targets, which drives additional nights in the bleisure travel market.
By Accommodation Type: Hotels Lead While Serviced Apartments Accelerate
Branded hotels accounted for 58.11% of stays in 2024, with extensive loyalty programs, on-site workspaces, and wellness amenities. Chains retrofit lobbies to double as casual meeting rooms, sustaining relevance for the bleisure travel market.
Short-term rentals held a 26.89% share, prized for home-style amenities during extended stays. Serviced apartments, 15% in 2024, surge at a 12.31% CAGR by fusing hotel-grade services with residential layouts, offering an optimal blend for knowledge workers needing productivity and comfort.
By Booking Channel: OTAs Dominate While Direct Corporate Portals Surge
OTAs captured 47.25% of bookings in 2024, combining a broad inventory with intuitive interfaces that streamline combined business-and-leisure reservations. Cross-selling of tours, insurance, and local transport bolsters OTA margins and reinforces their central role in the bleisure travel market.
Travel Management Companies handled 31%, focusing on duty-of-care compliance and visa assistance. Direct corporate portals, 21.75% of 2024 bookings, soar at a 12.75% CAGR as enterprises deploy user-friendly dashboards that integrate policy checks and leisure filters.
Geography Analysis
Europe is benefiting from dense business hubs near cultural capitals and an integrated rail network that facilitates weekend getaways. Cities like London, Amsterdam, and Paris ride sustained mid-week occupancy into the weekend as delegates stay on for art shows or culinary events. EU digital visa systems and cross-border e-ticketing reinforce ease of movement, fueling consistent gains in the bleisure travel market.
North America accounted for 28%, buoyed by extensive domestic corridors and an ingrained culture of paid time off. The U.S. leads with large-scale conventions that prompt attendees to tack on leisure days, while Canada and Mexico benefit from cross-border corporate ties that simplify multi-country itineraries. The U.S. Travel Association confirms ongoing strength in domestic leisure, providing a stable bedrock for blended trips.
Asia-Pacific represents the fastest-growing region at a 10.01% CAGR. Rapid economic development in China, India, and Southeast Asia drives increased project travel, while governments introduce digital nomad and remote-work visas to keep visitors longer. APEC documents surging demand for extended stays, demonstrating the rising prominence of the bleisure travel market in Asia. Airlines add fifth-freedom routes that pair business hubs with resort destinations, fostering multi-city itineraries.
The Middle East and Africa investments in dual-use convention and tourism facilities. Business delegates attending expos in Dubai or Riyadh often extend trips to nearby heritage sites or coastal resorts, broadening the bleisure travel market across the region. Security improvements and visa-on-arrival programs widen appeal to multinational firms.
South America Financial centers such as São Paulo and Santiago host regional headquarters that generate steady meeting traffic, while surrounding national parks and wine regions lure visitors to stay longer. Currency volatility tempers growth momentum, yet improving air connectivity and digital payment adoption support a gradual uptick in the bleisure travel market.

Competitive Landscape
Competition is moderately concentrated: Expedia Group Inc., Booking Holdings Inc., Airbnb Inc., BCD Group, and Amex GBT combine to hold a significant market share. OTAs scale AI-driven personalization to nudge travelers toward leisure extensions. Expedia’s 2025 roll-out of “Expedia Trip Matching” analyzes social-media cues and aligns them with local experiences, driving cross-sell of tours and dining reservations. Booking Holdings extends direct hotel partnerships into secondary cities, broadening its portfolio for business travelers seeking authentic neighborhoods.
Airbnb cultivates longer corporate stays by expanding dedicated corporate dashboards that manage expense separation, appealing to finance and HR teams. BCD Group and Amex GBT embed predictive analytics to optimize policy compliance and locate savings across blended itineraries. Visa Government Solutions supplies spend data analytics that travel managers and suppliers use to refine program design (visa.com).
Strategic convergence is clear: OTAs strengthen reporting and duty-of-care modules, while TMCs integrate leisure content. Hotel chains form coalitions with airlines to offer unified points accrual across flights and rooms, allowing travelers to redeem rewards for leisure upgrades. Serviced-apartment operators partner with tech firms to add automated check-in and enterprise expense coding, attracting the knowledge-worker demographic at the center of the bleisure travel market.
Continued technology investment sets competitive tempo. Chatbots manage last-minute itinerary changes, while mobile apps deliver neighborhood guides that encourage off-peak spending. Providers that harmonize corporate policy, duty-of-care requirements, and leisure inspiration in a single interface stand to deepen market share as the bleisure travel market matures.
Bleisure Travel Industry Leaders
Airbnb Inc.
American Express Travel
Expedia Inc.
BCD Travel
Carlson Wagonlit Travel
- *Disclaimer: Major Players sorted in no particular order

Recent Industry Developments
- May 2025: Expedia Group Inc. launched AI-powered “Expedia Trip Matching,” linking social-media interests to destination suggestions; gross bookings climbed 4% to USD 31.45 billion.
- December 2024: Trip.com introduced Trip.Biz, enabling travelers to divide personal and corporate expenses via a co-payment feature that supports upgrades and stay extensions.
- October 2024: Hilton expanded “Work From Hilton,” citing survey data showing 46% of full-time workers plan to add leisure days to business itineraries.


Research Methodology Framework and Report Scope
Market Definitions and Key Coverage
According to Mordor Intelligence, we define the bleisure travel market as the aggregate spending that occurs when a business trip is extended, or partly reshaped, to include personal leisure activities. The valuation captures transport, lodging, food and beverage, attractions, and ancillary services consumed during the business leg and the immediate leisure extension (up to seven consecutive nights) that remains tied to the original corporate itinerary.
Scope Exclusions: pure leisure vacations with no business purpose, remote-only digital nomad stays exceeding one month, and cruise packages are outside this study's remit.
Segmentation Overview
- By Tour Type
- Independent
- Group
- By Trip Type
- Domestic
- International
- By Age Group
- Millennials (23-42)
- Generation X (43-58)
- Others (Gen Z & Boomers)
- By Industry Vertical
- Corporate
- Government / Public Sector
- By Accommodation Type
- Branded Hotels
- Short-Term Rentals
- Serviced Apartments
- By Booking Channel
- Online Travel Agencies (OTAs)
- Travel Management Companies (TMCs)
- Direct Corporate Portals
- Geographic
- North America
- Canada
- United States
- Mexico
- South America
- Brazil
- Peru
- Chile
- Argentina
- Rest of South America
- Asia-Pacific
- India
- China
- Japan
- Australia
- South Korea
- South East Asia (Singapore, Malaysia, Thailand, Indonesia, Vietnam, and Philippines)
- Rest of Asia-Pacific
- Europe
- United Kingdom
- Germany
- France
- Spain
- Italy
- BENELUX (Belgium, Netherlands, and Luxembourg)
- NORDICS (Denmark, Finland, Iceland, Norway, and Sweden)
- Rest of Europe
- Middle East & Africa
- United Arab Emirates
- Saudi Arabia
- South Africa
- Nigeria
- Rest of Middle East & Africa
- North America
Detailed Research Methodology and Data Validation
Primary Research
Mordor analysts interview corporate travel managers, hotel revenue heads, airline GDS specialists, and digital booking platforms across North America, Europe, and Asia Pacific. Structured surveys of frequent flyers and follow-up calls with destination marketing organizations validate extension rates, price points, and hybrid work adoption that desk research alone cannot reveal.
Desk Research
Our team begins with publicly available tier-1 datasets such as UNWTO purpose of visit arrivals, U.S. Bureau of Transportation Statistics passenger segments, Eurostat tourism night splits, WTTC Travel and Tourism spending trends, and OECD household travel expenditure panels. Company filings, hotel ADR disclosures, OTA trading updates, and national tourism board dashboards enrich near-term demand signals, while D&B Hoovers and Dow Jones Factiva provide corporate travel budget clues and news sentiment. Airport slot filings, corporate card network snapshots, and select trade association white papers help verify traveler mix, trip length, and extension ratios. The sources cited above are illustrative; many additional references are consulted for data collection, cross-checks, and clarification.
Market Sizing and Forecasting
A top-down model starts with business purpose arrivals and domestic business trips by country, multiplies them by average spend per night, then layers an empirically derived 'leisure extension ratio' to isolate incremental bleisure outlays. Results are corroborated through selective bottom-up checks, sampled hotel ADR multiplied by bleisure nights, OTA booking splits, and airline net sales to refine totals. Key inputs include corporate travel budgets, hybrid work penetration, average trip length, ADR progression, and domestic to international mix. Multivariate regression with ARIMA error correction projects these drivers forward, letting scenario analysis adjust for macro shocks. Gaps in bottom-up evidence are bridged using weighted regional proxies agreed on with interviewees.
Data Validation and Update Cycle
Outputs pass variance tests against historical series, peer indicators, and prior editions. Senior reviewers question anomalies, and models are re-run when large shifts emerge. Reports refresh each year, with interim updates triggered by material events; just before release, an analyst conducts a fresh validation pass so clients receive the latest view.
Why Mordor's Bleisure Travel Baseline Commands Reliability
Published estimates often diverge because firms choose different base years, extension definitions, and growth scenarios.
By anchoring figures to purpose of visit data and a clearly capped leisure night window, Mordor delivers a disciplined, reproducible baseline.
Key Gap Drivers include: some publishers merge pure leisure spend, others forecast off older 2022 data, and a few rely heavily on credit card proxies without calibrating ADR or extension ratios; several use aggressive work from anywhere penetration that inflates long-term growth.
Benchmark comparison
| Market Size | Anonymized source | Primary gap driver |
|---|---|---|
| USD 611.72 B (2025) | Mordor Intelligence | - |
| USD 685.20 B (2024) | Global Consultancy A | Includes traditional leisure trips and broader booking window |
| USD 933.31 B (2022) | Industry Journal B | Older base year and credit card spend proxy inflates totals |
These comparisons show that, by selecting the right scope, fresher base year, and mixed method validation, Mordor Intelligence offers decision makers a balanced, transparent starting point they can reliably build upon.


Key Questions Answered in the Report
What is the projected value of the bleisure travel market by 2030?
The bleisure travel market size is expected to reach USD 611.72 billion in 2025 and grow at a CAGR of 9.52% to reach USD 963.88 billion by 2030.
What is the current Bleisure Travel Market size?
The bleisure travel market is forecast to reach USD 963.88 billion by 2030.
How fast is the international portion of the bleisure travel market growing?
International trips are forecast to grow at an 11.03% CAGR between 2025 and 2030.
Which accommodation type is recording the quickest growth?
Serviced apartments are expanding at a 12.31% CAGR due to work-friendly amenities.
Which region has the biggest share in Bleisure Travel Market?
Asia-Pacific leads with a projected 10.01% CAGR through 2030, driven by economic expansion and new visa options.
Page last updated on:


