
Online Travel Agency Market Size and Share
Online Travel Agency Market Analysis by Mordor Intelligence
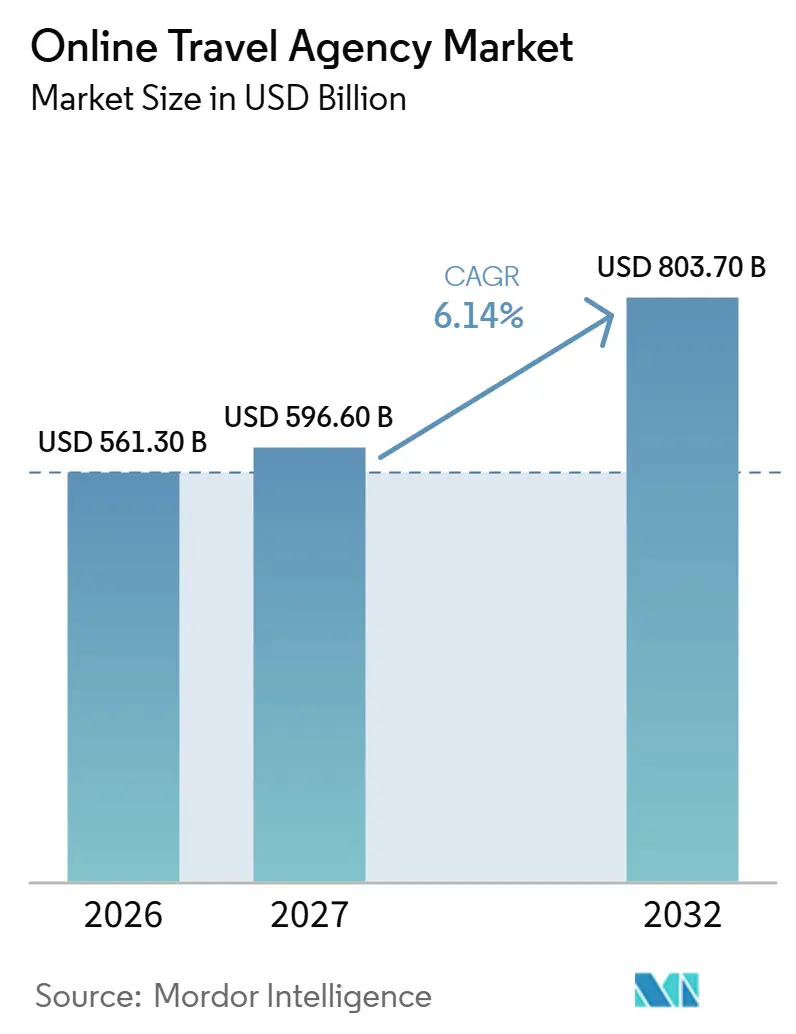
The online travel agency market size is projected to expand from USD 561.3 billion in 2026 and USD 596.6 billion in 2027 to USD 803.7 billion by 2032, registering a CAGR of 6.14% between 2027 and 2032.
Recovering international travel expands the pool of trips, although airfare pressure and air traffic disruptions caused by the Middle East conflict from March 2026 complicated travel decisions. Agency apps in India and mini-program booking in China bring reservations into the customer's digital travel journey. Richer airline offers and eligible installment payments give those channels more ways to complete a trip. Workflow and loyalty strategies can reinforce customer relationships, while search dependence and supplier pricing freedom make differentiation more important. Coordinating discovery, reservations, and service responsibility can help an agency retain a commercial role when another platform introduces the traveler.
Key Report Takeaways
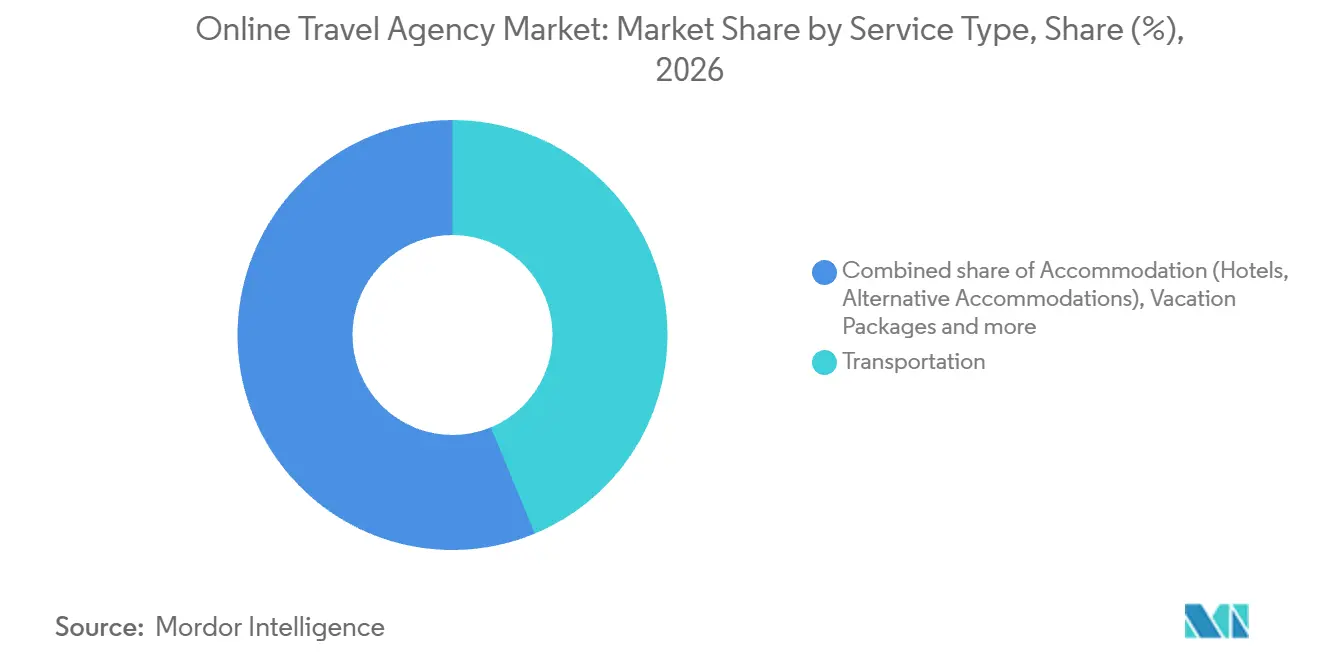
- By service type, transportation held a 43.74% online travel agency market share in 2026, while accommodation is forecast to grow fastest at a 6.3% CAGR between 2027 and 2032.
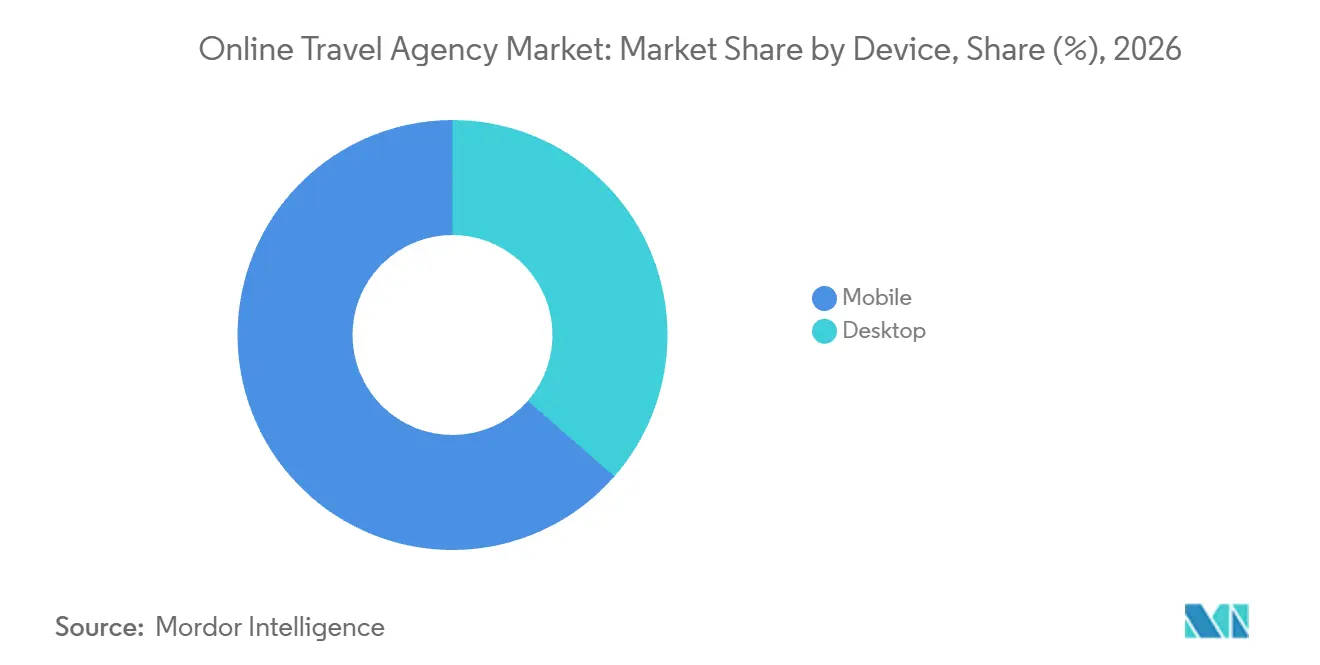
- In the device category, mobile led with a 63.57% market share in 2026 and is forecast to be the fastest-growing segment, with a 6.25% CAGR between 2027 and 2032.
- Across traveler types, leisure travelers led with a 77.67% share of the online travel agency market size in 2026, while business travelers are forecast to grow fastest at a 6.3% CAGR between 2027 and 2032.
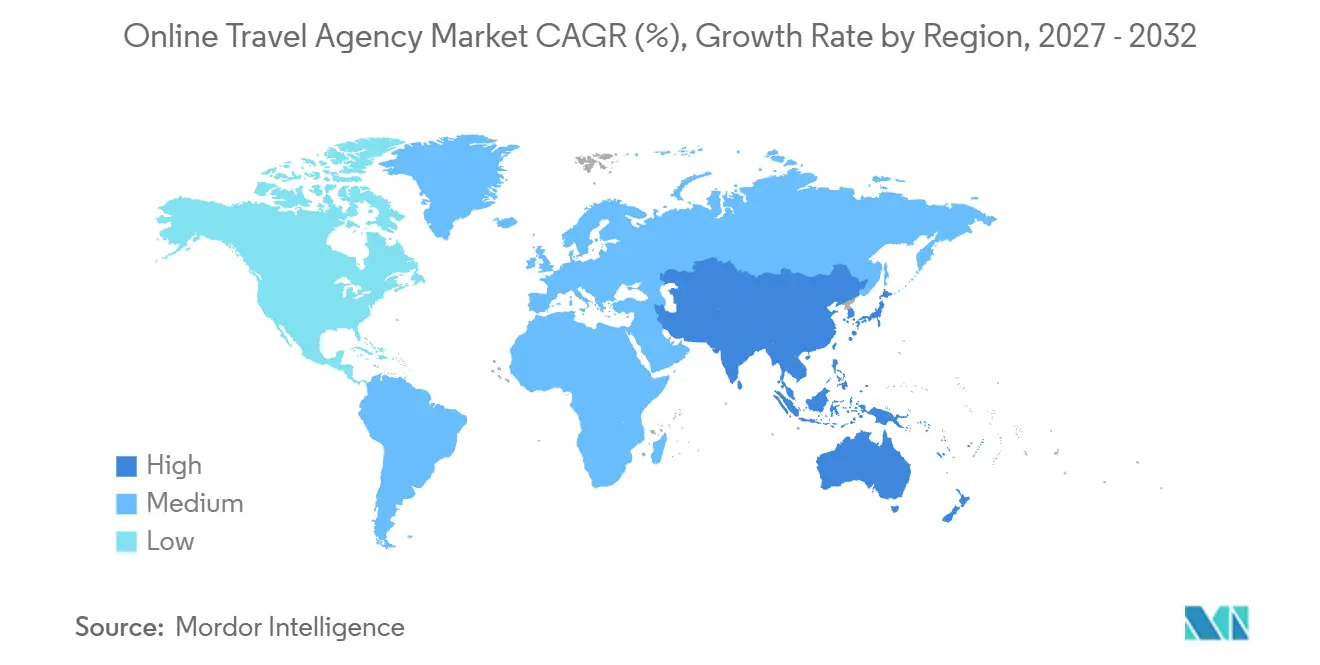
- Geographically, Asia-Pacific held a 38.49% market share in 2026 and is forecast to be the fastest-growing region, registering a 6.65% CAGR between 2027 and 2032.
Note: Market numbers in this report are based on Mordor Intelligence's proprietary estimation framework, which combines nine months of actuals with Q4 projections for base year 2026.
Market Trends and Insights
Drivers Impact Analysis of Online Travel Agency Market*
| Driver | (~) % Impact on CAGR Forecast | Geographic Relevance | Impact Timeline |
|---|---|---|---|
| Mobile-first booking and app adoption | +2.2% | India within Asia-Pacific | Short term (≤ 2 years) |
| International travel recovery and Asia-Pacific-led growth | +2.5% | Asia and the Pacific | Medium term (2-4 years) |
| Embedded fintech and BNPL lift conversion and AOV | +1.4% | United States in North America | Medium term (2-4 years) |
| Airline NDC enables richer air retailing and ancillaries | +1.1% | North America, Europe and Asia-Pacific | Medium term (2-4 years) |
| Superapp and mini-program integrations expand OTA reach | +0.9% | China within Asia-Pacific | Short term (≤ 2 years) |
| AI-powered personalization and dynamic pricing optimization | +0.6% | North America, Europe and Asia-Pacific | Long term (≥ 4 years) |
| Source: Mordor Intelligence | |||
Mobile-first booking and app adoption
Travel apps create an agency-controlled place to complete a reservation after the traveler has identified a trip. In India, app bookings accounted for 81.3% of MakeMyTrip's key-brand transactions in fiscal 2026, which ended March 31, 2026. The combined cumulative download count for MakeMyTrip, Goibibo, and redBus apps exceeded 566.7 million across iOS and Android by March 31, 2026. A downloaded app can provide a return booking route, giving the agency an opportunity to earn the next reservation through its own interface. That makes app adoption a distribution asset whose value can extend across later trip decisions, provided travelers continue choosing the agency's booking service.
International travel recovery and Asia-Pacific-led growth
Cross-border travel recovery enlarges the demand pool that agencies can serve through transport and accommodation reservations. Provisional UN Tourism figures put Asia and the Pacific's international tourist arrivals at 336.6 million in 2025, up 7.6% year over year against 4.7% worldwide. Regional arrivals grew 1% year over year in H1 2026 but were 11% below 2019 levels, as higher airfares, uncertainty, and air connectivity disrupted by the Middle East conflict since March 2026 affected demand. That combination supports further booking opportunities while making available connections and trip affordability important conditions for converting travel interest into transactions. Available routes and fares determine which parts of this recovering arrival pool an agency can feasibly serve.
Embedded fintech and BNPL lift conversion and AOV
Installment payments can make a timely travel purchase more manageable by separating the booking decision from the full upfront payment. In January 2026, Expedia Group and Affirm announced a multi-year agreement making Affirm the exclusive buy now, pay later (BNPL) provider for US lodging and packages across Expedia, Hotels.com, and Vrbo.[1] Payment options depend on eligibility and purchase amount, and a down payment may be required. For qualifying travelers, distributing payments can make a larger trip basket feasible when immediate payment would constrain the booking decision. The announced exclusive route would let these brands offer eligible US lodging and package buyers a consistent way to spread booking costs.
Airline NDC enables richer air retailing and ancillaries
Access to a fuller airline offer gives online agencies more scope to sell travel attributes alongside the basic itinerary. In March 2025, Emirates' New Distribution Capability (NDC) integration connected its complete fare-product and service portfolio to Expedia Group's global customer base. In August 2026, Navan upgraded Singapore Airlines NDC access to a direct connection on its business travel platform.[2] These deployments show how airline-controlled content can reach both consumer and corporate booking channels, creating scope for more differentiated offers within the agency experience. The commercial value of that access depends on presenting the additional fare and service choices clearly enough to make the agency useful beyond a basic flight search.
Restraints Impact Analysis of Online Travel Agency Market*
| Restraint | (~) % Impact on CAGR Forecast | Geographic Relevance | Impact Timeline |
|---|---|---|---|
| Dependence on Google/AI search raises CAC volatility | -1% | North America, Europe and Asia-Pacific | Short term (≤ 2 years) |
| Regulatory scrutiny and rate-parity bans (European Union DMA) | -0.8% | European Economic Area countries | Medium term (2-4 years) |
| NDC-driven content fragmentation and servicing complexity | -0.5% | South Africa within Africa | Medium term (2-4 years) |
| Rising fraud/chargebacks in cross-border payments | -0.3% | Asia-Pacific, Europe, Middle East and Africa | Short term (≤ 2 years) |
| Source: Mordor Intelligence | |||
Dependence on Google/AI search raises CAC volatility
Unpaid search exposure creates a cost risk even when an agency continues to attract travelers to its booking services. In its 2025 risk disclosure, Expedia Group warned that Google travel features and AI search threatened traffic and margins. It said replacement costs could rise if search providers continued their strategies or Expedia failed to manage paid and unpaid search effectively. The commercial constraint is the potential expense of preserving traffic when the source of those visits changes outside the agency's control. For exposed agencies, replacing an unpaid visit with a paid visit can consume more of the earnings available from that booking.
Regulatory scrutiny and rate-parity bans (European Union DMA)
Rate-parity restrictions weaken an intermediary's ability to secure consistent supplier terms across competing channels. Since November 14, 2024, the Digital Markets Act has prohibited Booking.com from preventing accommodation providers in the European Economic Area from offering different prices or conditions elsewhere.[3] For the designated platform, that freedom limits the contractual protection surrounding its accommodation offer and strengthens suppliers' scope to differentiate direct bookings. Booking.com must justify its distribution role when a hotel can make another channel commercially more attractive. This constraint on supplier pricing terms applies to Booking.com's EEA accommodation inventory, concentrating the distribution challenge on that designated service.
*Our forecasts treat driver/restraint impacts as directional, not additive. The impact forecasts reflect baseline growth, mix effects, and variable interactions.
Online Travel Agency Market Segment Analysis
By Service Type:
Transportation Anchors Transaction ScaleTransportation accounted for a 43.74% share of the online travel agency market size in 2026. Booking Holdings' platforms booked 68 million airline tickets in 2025, up 37% year over year, representing USD 16.8 billion in gross bookings. Booking Holdings' airline-ticket flows give an agency repeated opportunities to secure the principal transport reservation for travelers planning a specific journey.
Accommodation, including hotels and alternative accommodations, is forecast to be the fastest-growing segment at a 6.3% CAGR between 2027 and 2032. Expedia Group recorded 111.5 million booked hotel room and alternative accommodation property nights in Q2 2026. Booking.com listed more than 4.1 million alternative accommodation properties and more than 500,000 hotels, motels, and resorts on June 30, 2026. That combination of booking activity and varied supply gives accommodation intermediaries substantial scope to match different trip requirements. Reducing the search burden across hotel and alternative inventory can differentiate platforms serving travelers with the same destination and dates.

By Device:
Mobile Execution Shapes Distribution EconomicsMobile was the largest segment with a 63.57% market share in 2026 and is forecast to be the fastest-growing segment, registering a 6.25% CAGR between 2027 and 2032. In Q2 2026, Trip.com Group said mobile bookings reached a new high of over 70% of its total bookings. This level of channel use makes mobile execution central to the platform's ability to transact with its existing audience.
Trip.com Group's CFO attributed the company's Q2 2026 mobile distribution gains to a smoother booking experience and stronger organic traffic. For an operator already routing substantial business through mobile, even a useful new travel offer has limited commercial value if customers struggle to complete its reservation. Because the CFO paired the gain with stronger organic traffic, which is unpaid, checkout quality decides how many of those visits become bookings.
By Traveler Type:
Leisure Scale Meets Corporate Service DemandLeisure travelers represented a 77.67% online travel agency market share in 2026. Expedia Group's 2025 Traveler Value Index, a survey with Wakefield Research of 11,000 respondents across 11 markets, found that nearly 90% of consumers planned a leisure trip in the following 12 months. For the largest segment, the freedom to choose a destination and trip format makes itinerary formation part of the service an agency can offer. An agency assembling a holiday proposition can compete for prospective leisure travelers before a particular supplier secures their reservation.
Business travelers are forecast to be the fastest-growing segment, with a 6.3% CAGR between 2027 and 2032. The Global Business Travel Association (GBTA) estimated 1.82 billion business trips worldwide in 2025 and forecast 1.84 billion in 2026. GBTA anticipated a 7.2% rise in business travel spending in 2026, contrasting with roughly 25 million additional trips, and linked this gap to higher transportation and travel costs dampening trip demand. For corporate booking platforms, this combination makes efficient handling of substantial existing trip volume commercially relevant alongside the opportunity to serve additional journeys. With spending forecast to outpace trips, cost control per journey matters alongside reservation volume.
Geography Analysis
Asia-Pacific Online Travel Agency Market
Asia-Pacific represented a 38.49% online travel agency market share in 2026 and is forecast to be the fastest-growing region, with a 6.65% CAGR between 2027 and 2032. The World Travel & Tourism Council (WTTC) estimated that the region's broader travel and tourism sector generated USD 3.29 trillion in GDP in 2025. The Pacific Asia Travel Association's June 2026 forecast projected international visitor arrivals across 39 Asia-Pacific destinations rising from 714.9 million in 2026 to 789.2 million in 2028. PATA forecast Vietnam to lead international visitor-arrival growth among the region's 10 largest destinations between 2025 and 2027. That projected expansion widens the potential audience for destination suppliers selling across regional borders through booking platforms.
North America was a substantial discovery base for Expedia Group, accounting for 75% of its global search volume in Q2 2026. During that quarter, US travelers' searches for Labor Day weekend travel on September 4 to 7, 2026, rose 35% year over year in the company's data. For Europe, Expedia Group characterized the wider Europe, Middle East, and Africa search region's shift toward near-term searches as consistent with European travelers planning last-minute summer trips. Poland, within Rest of Europe, recorded growth in 2025 guest nights in short-stay rentals booked through Airbnb, Booking, and Expedia. Seasonal US interest and European last-minute planning make offer timing a regional decision, while Poland's growth in platform-booked short-stay nights shows demand for rental-type stays rising within Rest of Europe.
South America's international tourist arrivals fell 2% in H1 2026 compared with H1 2025, with mixed destination results making the regional decline an inadequate guide to individual offers. For the Middle East and Africa, UN Tourism reported Middle Eastern arrivals down 22% amid conflict-related air traffic disruptions and lower traveler confidence, while African arrivals rose 4% over the same period. Those air traffic disruptions affected the Middle East and other regions from March 2026 and gradually eased after the ceasefire in May and early June, allowing some air routes to reopen. Saudi Arabia's Q2 2026 hotel occupancy exceeded the combined serviced-apartment and other-hospitality rate, although both declined year over year, making facility mix relevant to local accommodation offers.
Regulatory Framework and Outlook
These selected jurisdictions are compared from the perspective of an online travel agency (OTA) operating an online accommodation-booking platform. The frameworks address different commercial tasks, including advertised pricing, platform transparency, supplier registration, and licensed travel services. China's recommended LB/T 094-2025 standard, effective August 19, 2025, provides a product-specific benchmark for accommodation-booking information. The practical comparison concerns how a platform presents an offer and establishes the conditions for providing its reservation service.
Regulatory Table of Online Travel Agency Market
| Decision factor | Canada | Germany | China | Brazil | Saudi Arabia |
|---|---|---|---|---|---|
| Primary authority | Competition Bureau | Bundesnetzagentur | Ministry of Culture and Tourism | Ministry of Tourism | Ministry of Tourism |
| Key instruments or direction | Competition Act prohibition on unattainable advertised prices | Digital Services Act tiered intermediary transparency duties | Recommended standard LB/T 094-2025 | General Tourism Law provider-registration condition | Travel and Tourism Services Regulations, with Arabic text governing |
| Commercial effect | Include mandatory fixed fees in advertised prices, except legislatively imposed purchaser charges | Match transparency controls to service category and duty tier | Prominent booking, cancellation, and fee terms | Listed tourism providers advertised through digital channels must register, with possible channel responsibility under applicable law | License required for covered travel services, with website authentication sufficient for specified electronic-only classes alongside other licensing requirements |
| Current policy attractiveness | Medium | Medium | High | Medium | Medium |
| Future direction of policy attractiveness | No change | No change | No change | No change | No change |
| Source: Mordor Intelligence | |||||
Canada's Competition Bureau guidance dated August 24, 2026, on unattainable advertised prices, Brazil's covered-provider registration rule in force since September 19, 2024, and Saudi Arabia's licensing requirement, backed by its September 14, 2026 violations schedule penalizing travel-service providers that omit license details on online booking platforms, support medium ratings for accommodation platforms. China's High rating and No change outlook reflect the recommended, non-mandatory accommodation standard in effect from August 19, 2025. Germany's medium rating reflects tiered Digital Services Act transparency duties, applicable to covered platforms since February 2024, with continuity judged for accommodation-only sales. The revised EU Package Travel Directive's transition requires transposition by September 29, 2028, and application from March 29, 2029, for qualifying packages, leaving an accommodation-only reservation outside that particular change.
Value Chain Stages
Value capture differs across lodging franchising, distribution technology, and agency retailing because each activity controls a different part of the reservation. Marriott earns application fees and continuing royalties under its hotel-franchising arrangements, alongside reimbursement for centralized services. Expedia Group operates both merchant and agency booking models, with the travel supplier serving as merchant of record in agency transactions. These distinctions make contractual responsibility as important as the ability to display a travel offer.
Value Chain Analysis Table of Online Travel Agency Market
| Primary activity | Key participants | Value capture | Bottleneck | Resilience response |
|---|---|---|---|---|
| Lodging branding and franchising | Lodging operators and franchisors such as Marriott | Franchise application fees and continuing royalties | Dependence on hotel-owner participation | Broaden owner relationships to reduce dependence on individual properties |
| Distribution technology and reservation processing | Global distribution system (GDS) technology providers such as Amadeus | Air booking fees, net of estimated cancellations and subject to contractual reversal | NDC search traffic at scale | Apply request filtering, following Amadeus's 2025 response |
| Online travel retailing | Booking intermediaries such as Expedia Group | Agency commissions, ticketing fees, and GDS fees on certain agency transactions | Coordinating merchant and agency booking flows | Keep transaction responsibilities and reconciliation specific to each model |
| Source: Mordor Intelligence | ||||
Amadeus negotiates access prices and booking incentives together in individual agency contracts, with incentives usually exceeding subscription revenue. Distribution earnings therefore depend on the balance between supplier fees and the cost of attracting agency bookings. In 2025, Amadeus identified NDC search traffic at scale as a major adoption hurdle and made Advanced Airline Profile available as a filtering response. This places management of the processing load from richer airline content at the distribution-technology layer.
Competitive Landscape
Competition spans consumer and specialist platforms, with Booking Holdings operating Booking.com, Priceline, and Agoda and reporting USD 186.1 billion in gross bookings in 2025. Navan serves business travel and expense customers, while Perk (formerly TravelPerk) supplies a business travel and expense management platform. Expedia Group combines consumer brands with B2B travel services. Klook was used by 42.5% of 2,990 paid-tour and activity bookers in Osaka Convention & Tourism Bureau's 4-wave FY2025 survey of international travelers departing Japan's Kansai Airport, May 2025 to March 2026. Because these platforms serve broad consumer travel, corporate travel and expense, and paid activities, a supplier's reach depends on which customer relationship it joins as well as distribution volume.
Corporate booking strategies link reservations to employers' wider travel and expense needs, with Navan reporting USD 9.1 billion in gross booking volume for the fiscal year ended January 31, 2026. In August 2026, Perk enabled customers to book and manage travel, submit expenses, and create team events through Claude, ChatGPT, and other AI assistants. Expedia Group's 2025 One Key expansion on Brand Expedia reached additional global markets, with most Expedia Rewards members migrated to the program. A continuing workflow or rewards relationship can give these platforms a role in the customer's next booking decision beyond the immediate need to reserve a trip.
Booking.com's program rules show how regulatory dialogue reaches the terms on which hotels compete across booking channels. In September 2026, following continued regulatory dialogue with the European Commission, Booking.com stopped using external prices to assess potential Booking Sponsored Benefit eligibility for properties in the European Economic Area, where such prices had previously still counted. Under that program, Booking.com funds the customer discount. The hotel receives the full amount corresponding to its set rate, and its agreed commission remains unchanged. Because external prices no longer determine potential eligibility, a hotel can price its own website below its Booking.com rate without that comparison affecting its potential access to the program.
Online Travel Agency Industry Leaders
-
Booking Holdings (Booking.com, Priceline, Agoda)
-
Navan (Reed & Mackay, Comtravo, Resia, Atlanta Events & Corporate Travel Consultants)
-
Perk (Formerly TravelPerk)
-
Expedia Group (Expedia, Hotels.com, Vrbo)
-
Klook
- *Disclaimer: Major Players sorted in no particular order
Online Travel Agency Market Companies Covered in this Report
- Booking Holdings (Booking.com, Priceline, Agoda)
- Navan (Reed & Mackay, Comtravo, Resia, Atlanta Events & Corporate Travel Consultants)
- Perk (Formerly TravelPerk)
- Expedia Group (Expedia, Hotels.com, Vrbo)
- Klook
- GetYourGuide
- Trip.com Group
- eDreams ODIGEO (eDreams, Opodo, GO Voyages)
- AsiaYo
- Secret Escapes
- TUI Musement
- Yatra
- MakeMyTrip
- Omio
- Despegar
- Traveloka
- lastminute.com
- On the Beach
- Hostelworld
- Universal Travels & Tourism LLC
- Hopper
- Webjet
- Rome2Rio
- Headout
Key Opportunities for Market Participants
The opportunities compare new hotel-discovery channels with the preparation needed for package-booking operations. Search and consumer-app interfaces offer agencies ways to supply reservations through a partner's customer experience. Package organizers face a different decision because their booking workflows must accommodate a defined national implementation timetable. The commercial distinction is between extending distribution and preparing the responsibilities attached to a more complex travel product.
Market Opportunities Table of Online Travel Agency Market
| Opportunity | Why now | Buyer / lead segment | Recommended play | Main barrier | Likely beneficiaries |
|---|---|---|---|---|---|
| Hotel fulfillment through AI search | Google began a US English hotel-booking rollout in August 2026 | US English-language hotel shoppers | Make hotel offers and servicing usable through partner discovery interfaces | Coordinating discovery with booking-provider customer service | Participating OTA brands such as Booking.com and Expedia |
| Hotel booking through consumer-app partnerships | Uber's US hotel-booking channel with Expedia Group is operating | US hotel shoppers using consumer apps | Develop comparable partner-operated hotel checkout propositions | Reconciling booking, payment, and support across organizations | OTA booking partners such as Expedia Group |
| Package-organizer workflow preparation | Revised EU directive entered into force May 28, 2026, with transposition due September 29, 2028, and application from March 29, 2029 | OTA traders acting as package organizers | Prepare package-booking workflows for national implementation | Completing applicable workflow changes before the measures apply | Online travel traders organizing packages |
| Source: Mordor Intelligence | |||||
The central near-term opening is to supply hotel reservations through interfaces that control a different part of customer discovery. Booking and payment responsibilities need to remain clear when a separate app or search provider presents the offer. Google's initial hotel-booking rollout serves US English-language users, while Uber's hotel channel requires users to be in the United States. Participation in these channels initially favors integrated booking partners such as Booking.com and Expedia.
Recent Industry Developments in Online Travel Agency Market
- Sep 2026: Qantas Loyalty announced a technology partnership with Expedia Group to upgrade booking across Qantas Hotels & Holidays and Jetstar Holidays in Australia, with Expedia Group B2B set to power the experience.
- Sep 2026: Booking.com stopped using external prices to assess potential Booking Sponsored Benefit eligibility for properties in the European Economic Area.
- Aug 2026: Google began rolling out hotel booking in AI Mode in the United States in English, with OTA partners including Booking.com and Expedia.
Online Travel Agency Market Report Scope and Research Methodology
Market Definition and Coverage
The global online travel agency market measures annual end-user spending on travel products booked through online travel agencies worldwide. It classifies those bookings by service type, booking device, traveler type and region.
Scope exclusions: Travel products booked directly with suppliers, travel products booked through offline travel agencies, standalone software, listing or technology services sold by OTAs to suppliers, and standalone payment, credit or financing services sold separately from an OTA travel booking are excluded.
Segments Covered in This Report
- By Service Type
- Accommodation (Hotels, Alternative Accommodations)
- Transportation
- Vacation Packages
- Others
- By Device
- Desktop
- Mobile
- By Traveler Type
- Leisure Travelers
- Business Travelers
- By Geography
- North America
- Canada
- United States
- Mexico
- South America
- Brazil
- Peru
- Chile
- Argentina
- Rest of South America
- Asia-Pacific
- India
- China
- Japan
- Australia
- South Korea
- South East Asia (Singapore, Malaysia, Thailand, Indonesia, Vietnam, and Philippines)
- Rest of Asia-Pacific
- Europe
- United Kingdom
- Germany
- France
- Spain
- Italy
- BENELUX (Belgium, Netherlands, and Luxembourg)
- NORDICS (Denmark, Finland, Iceland, Norway, and Sweden)
- Rest of Europe
- Middle East and Africa
- United Arab Emirates
- Saudi Arabia
- South Africa
- Nigeria
- Rest of Middle East and Africa
- North America
Data Sources, Market Sizing, and Validation
Desk Research
Public indicators such as Eurostat's tourism statistics and its platform-booked accommodation series can anchor accommodation volumes, origin and destination patterns, while the World Travel & Tourism Council's country and regional accounts and the Global Business Travel Association's Business Travel Index help frame leisure and business travel activity. The European Commission's Digital Markets Act materials provide context on platform rules that can affect supplier terms and channel economics.
Company annual reports, investor materials and reputable travel and business press can provide reported bookings, room nights, air tickets, average prices and changes to platform distribution, with each measure checked against its stated period and scope before use. These named sources are illustrative and not exhaustive, and further sources inform collection, validation and clarification.
Primary Interviews and Surveys
Structured interviews with OTA executives and leaders in lodging, air distribution, package operations and corporate travel can test the interpretation of secondary indicators and clarify how bookings enter the market boundary. Traveler and business-buyer surveys can help distinguish leisure from business use and desktop from mobile booking, while conflicting or missing evidence is checked against independent public indicators and reconciled before it informs estimates.
Distribution of primary research fieldwork respondents
| Company type | Respondent position | Region |
|---|---|---|
| Top tier: 31% | CXOs: 20% | APAC: 40% |
| Mid tier: 45% | Functional/Unit leaders: 35% | EMEA: 33% |
| Smaller Players: 24% | Managers: 45% | Americas: 27% |
Market-Sizing & Forecasting
A top-down estimate starts with travel spending and booking activity by region, then isolates the portion transacted through online travel agencies under the end-user checkout definition. International arrivals and accommodation nights indicate trip and stay volumes, while tourism spending, hotel rates and airfares show changes in transaction value. Public platform booking disclosures and online channel use help assess OTA penetration, and traveler-type evidence separates leisure from business demand. Segment shares follow the service purchased, booking device, traveler type and destination region, with package transactions counted once at the total package price.
A multivariate regression can relate historical OTA booking value to travel activity, prices and online booking penetration, with scenario analysis used when travel recovery, air capacity or channel economics change materially. Selective bottom-up checks multiply sampled booking volumes by average transaction values for lodging, air, packages and other services, then compare those roll-ups with the top-down estimate. Incomplete disclosures are bounded with comparable public indicators and left out of the check when a defensible value cannot be established. Subject specialists can review the direction of variable-level forecasts and identify inconsistent assumptions before the estimates are reconciled.
Data Validation & Update Cycle
Analysts triangulate the estimate against independent travel demand, accommodation, air travel, platform booking and company filing signals, checking that periods, units and transaction bases align. Unexpected movements or material variance between top-down and selective supplier or channel checks are traced to source definitions and price, volume or mix changes, corrected where evidence supports a change, and reviewed by another analyst before sign-off. Re-contact is triggered when a source definition is unclear, public indicators conflict, or a material change affects the booking boundary. The model is refreshed annually, updated between cycles for material events and given a fresh pre-delivery review.
Mordor Intelligence's Online Travel Agency Market Size Compared Against Other Published Estimates
Published estimates can differ in the transactions and products they count and the inputs used to model demand. The global online travel agency market measures annual end-user spending on travel products booked through online travel agencies worldwide.
Key Gap Drivers include the study's defined coverage and market-specific modeling choices. Incomplete disclosures are bounded with comparable public indicators and left out of the check when a defensible value cannot be established.
Benchmark comparison
| Source | Market Size | Gaps in Research Methodology |
|---|---|---|
| Mordor Intelligence | USD 596.6 B (2027) | |
| Global Consultancy A | USD 665 B (2025) | At its 2025 base, this estimate is 11.5% above this report's 2027 value of USD 596.6 B, 2 years later. Includes metasearch and direct supplier portals alongside OTAs, extending coverage beyond OTA-booked transactions. |
| Global Consultancy B | USD 713 B (2025) | At its 2025 base, this estimate is 19.5% above this report's 2027 value of USD 596.6 B, 2 years later. Includes direct supplier bookings as well as OTA bookings, adding transactions excluded from the OTA-only boundary. |
Mordor Intelligence's analysts triangulate the estimate against independent travel demand, accommodation, air travel, platform booking and company filing signals, checking that periods, units and transaction bases align.
Key Questions Answered in the Report
What is the online travel agency market size and growth outlook?
The market is projected at USD 596.6 billion in 2027 and USD 803.7 billion by 2032, with a 6.14% CAGR between 2027 and 2032.
What drives demand for online travel agency services?
Mobile adoption, international travel recovery, installment payments, and richer airline content support demand. MakeMyTrip's key-brand app transaction share in India was 81.3% in fiscal 2026.
Which service category leads the OTA sector?
Transportation led with a 43.74% market share in 2026.
Which companies compete in the OTA sector?
Booking Holdings, Navan, Perk, Expedia Group, and Klook are among the major participants.
Which challenges could constrain OTA booking growth?
Expedia Group's 2025 disclosure warned that continued search changes or ineffective channel management could raise the cost of replacing unpaid traffic with paid traffic. Booking.com also faces rate-parity restrictions in the European Economic Area.
Which region leads OTA services?
Asia-Pacific held a 38.49% market share in 2026 and is forecast to grow fastest at a 6.65% CAGR between 2027 and 2032.