Vanilla Bean Market Size and Share
Vanilla Bean Market Analysis by Mordor Intelligence
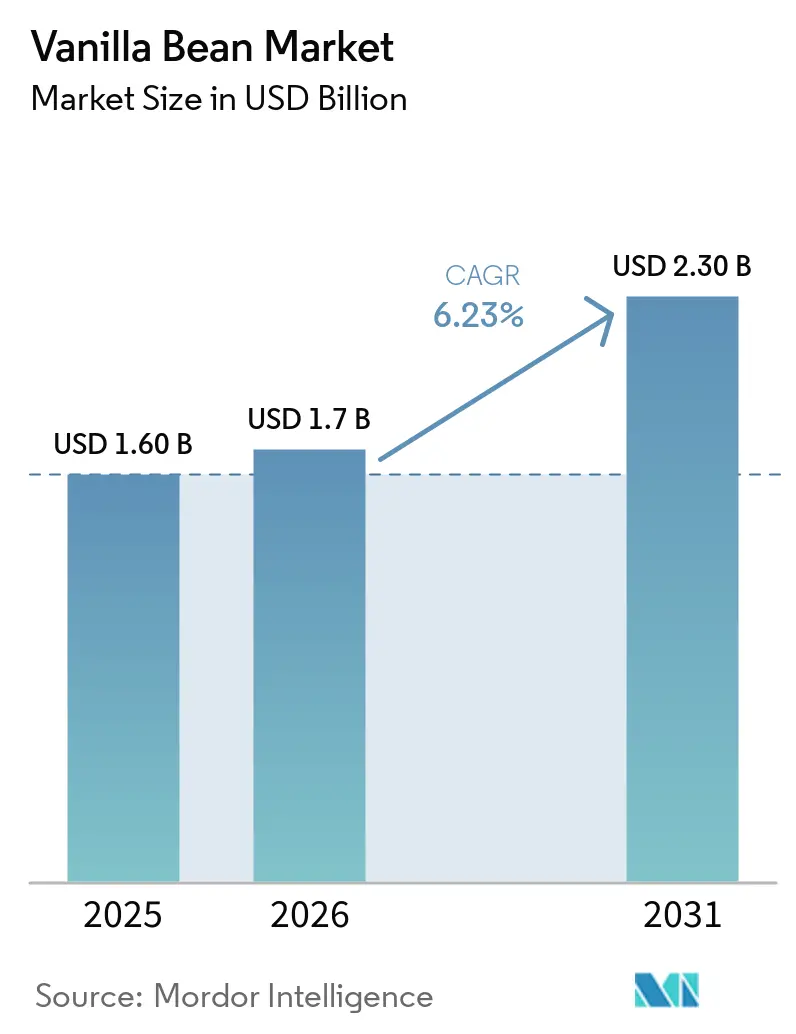
The vanilla bean market size is projected to expand from USD 1.6 billion in 2025 and USD 1.7 billion in 2026 to USD 2.3 billion by 2031, registering a CAGR of 6.23% between 2026 and 2031. The vanilla bean market benefits from sustained premium pricing because natural vanilla remains the preferred flavor for ice cream, bakery, and personal-care applications, even as synthetic vanillin gains ground in cost-sensitive segments. North America continues to dominate demand, driven by consumers who associate natural vanilla with clean-label credentials and who are willing to pay retail premiums when traceability is verified. The Asia-Pacific region is the fastest-growing consumption base in the vanilla bean market, as rising disposable incomes and the adoption of Western-style desserts in China and India encourage manufacturers to reformulate with natural vanilla and experiment with origin-specific varieties. Supply-side fragility persists in the vanilla bean market because Madagascar accounts for more than one-third of global production and remains vulnerable to cyclone risk, organized theft, and narrow genetic diversity. Controlled-environment cultivation pilots in Israel and Australia hint at long-term diversification potential in the vanilla bean market. Flavor houses that invest in blockchain verification, farmer pre-financing, and carbon-credit pilot projects are widening the competitive gap by securing a reliable supply while strengthening their sustainability narratives.
Key Report Takeaways
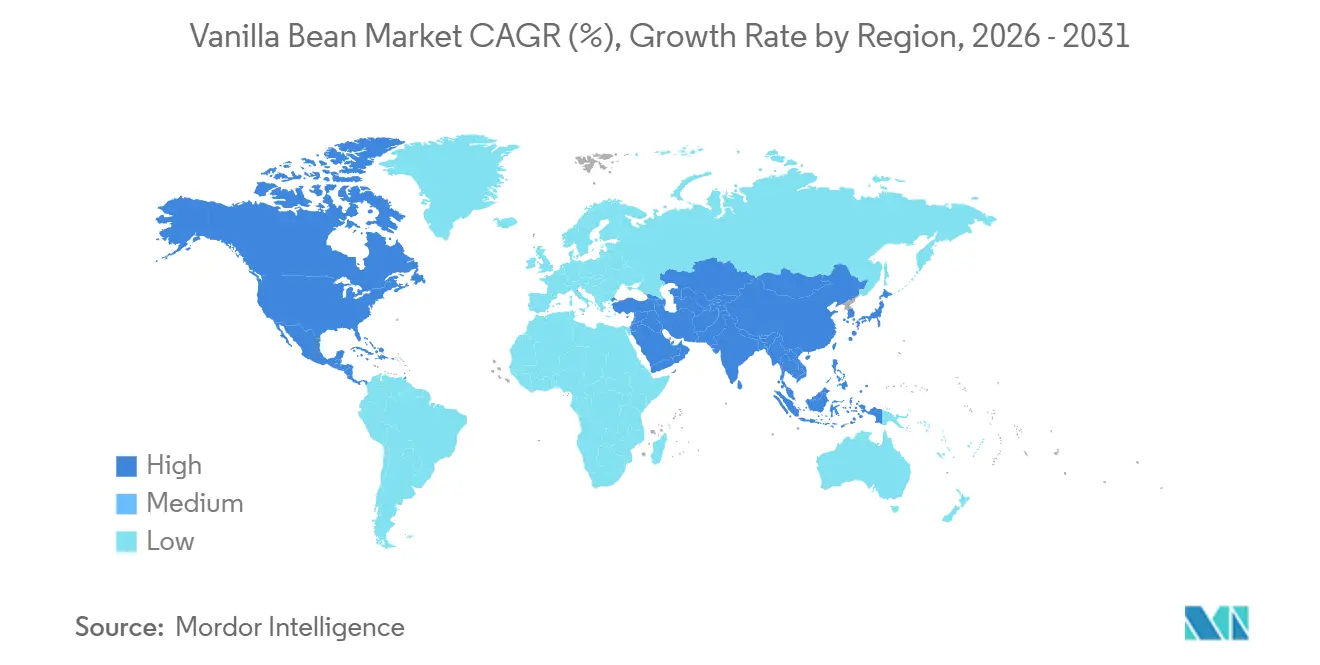
- By geography, North America captured 37.8% of the vanilla bean market share in 2025, and the Asia-Pacific region is projected to show the fastest CAGR of 7.2% from 2026 to 2031.
Note: Market size and forecast figures in this report are generated using Mordor Intelligence’s proprietary estimation framework, updated with the latest available data and insights as of January 2026.
Global Vanilla Bean Market Trends and Insights
Drivers Impact Analysis*
| Driver | (~) % Impact on CAGR Forecast | Geographic Relevance | Impact Timeline |
|---|---|---|---|
| Premiumization of natural flavors in packaged foods | +1.0% | Global, led by North America and Western Europe | Medium term (2-4 years) |
| Growing demand from nutraceutical and cosmeceutical processors | +0.7% | North America, Europe, and Asia-Pacific urban centers | Long term (≥ 4 years) |
| Shift toward organic and regenerative vanilla farming | +0.5% | Madagascar, Indonesia, Uganda with spillover to import markets | Long term (≥ 4 years) |
| Rising traceability mandates by confectionery majors | +0.8% | Global, concentrated in North America and EU procurement | Short term (≤ 2 years) |
| Carbon-credit revenue streams for agro-forestry vanilla farms | +0.3% | Madagascar, Indonesia, and Papua New Guinea | Long term (≥ 4 years) |
| Expansion of controlled-environment vanilla cultivation projects | +0.5% | Israel, Australia, and United States pilot regions | Long term (≥ 4 years) |
| Source: Mordor Intelligence | |||
Premiumization of Natural Flavors in Packaged Foods
In the vanilla bean market, natural vanilla’s “clean label” halo allows manufacturers to charge 15% to 25% more than private-label alternatives. Ice cream giants committed to 100% natural vanilla are reinforcing the value proposition that justifies these markups[1]Source: International Dairy Foods Association, “Flavor Trends in United States Ice Cream,” idfa.org. Surveys show that two-thirds of North American shoppers perceive natural vanilla as healthier, despite its comparable sensory performance to synthetic vanillin. Within the vanilla bean market, flavor houses report an uptick in dessert and bakery product launches containing natural vanilla, confirming that reformulation momentum extends beyond frozen dairy. As retailers highlight origin stories on packaging, demand for traceable Madagascar vanilla grades is strengthening. The premiumization trend also supports investment in blockchain verification because consumers reward transparent sourcing with brand loyalty.
Growing Demand from Nutraceutical and Cosmeceutical Processors
Cosmetics and dietary supplement laboratories are treating vanilla as a functional active ingredient due to its polyphenol profile. A leading French dermocosmetic brand incorporated Vanilla tahitensis extract at 1% concentration in an anti-aging serum that retails at a premium price point. The Cosmetic Ingredient Review panel cataloged 370 formulations that contain vanilla compounds, confirming broader penetration into personal-care lines. In nutraceutical channels, vanilla oleoresin is positioned for relaxation and sleep health, even though clinical validation is still emerging.
Shift Toward Organic and Regenerative Vanilla Farming
Certification schemes in the vanilla bean market are scaling as buyers connect sustainability claims to continued shelf access. The Rainforest Alliance updated its vanilla standard to require 50% certified content in blended products through 2027 and 90% by 2030[2]Source: Rainforest Alliance, “Sustainable Certification Standard for Vanilla,” rainforest-alliance.org. Intercropping vanilla with nitrogen-fixing shade trees increases soil carbon sequestration by up to 1.8 metric tons per hectare annually, aligning with the objectives of regenerative agriculture. A development lender extended a USD 500,000 loan to a Tanzanian exporter to expand organic acreage among 300 smallholders, demonstrating financier appetite for verified environmental outcomes. Certified vanilla trades at a 20% to 30% premium but requires the buyer to pre-finance to mitigate the revenue dip during the transition period, underscoring the need for deeper buyer-supplier partnerships.
Rising Traceability Mandates by Confectionery Majors
Blockchain and DNA fingerprinting in the vanilla bean market are moving from pilot phases into procurement requirements. A global beauty conglomerate utilizes a distributed ledger to record pollination dates, curing details, and export manifests for 450 Malagasy farmers, resulting in a 12% reduction in bean theft and a strengthening of brand claims regarding ethical sourcing[3]Source: Estée Lauder Companies, “Blockchain Traceability for Vanilla,” elcompanies.com. The Sustainable Vanilla Initiative, organized by a Dutch development group, has engaged multinational confectioners that have pledged to use 100% sustainable ingredients, including vanilla, by 2025. This commitment accounts for approximately 70% of trade volumes, as reported by IDH. The European Union Deforestation Regulation mandates the collection of geolocation data for vanilla imports starting in 2025, thereby accelerating investment in GPS tagging and farm mapping. Traceability infrastructure costs USD 0.50 to USD 1.00 per kilogram, yet buyers in premium channels absorb the expense as a reputational safeguard.
Restraints Impact Analysis*
| Restraint | (~) % Impact on CAGR Forecast | Geographic Relevance | Impact Timeline |
|---|---|---|---|
| Price volatility linked to cyclone risk in Madagascar | -1.1% | Global, with acute impact on Madagascar production and EU/North America import costs | Short term (≤ 2 years) |
| Surging availability of synthetic and bio-engineered vanillin | -0.8% | Global, concentrated in cost-sensitive food and fragrance applications | Medium term (2-4 years) |
| Organized crime and bean theft undermining supply stability | -0.5% | Madagascar, Uganda, with spillover to global pricing | Short term (≤ 2 years) |
| Limited genetic diversity heightening disease susceptibility | -0.4% | Madagascar, Indonesia, Mexico, Papua New Guinea | Long term (≥ 4 years) |
| Source: Mordor Intelligence | |||
Price Volatility Linked to Cyclone Risk in Madagascar
Madagascar produced 39.38% of the world's vanilla, which remains central to the vanilla bean market in 2022, leaving the global supply exposed to tropical storms that can wipe out up to 40% of annual output. Cyclone Garance damaged 123 hectares in February 2025, triggering French emergency aid of USD 1.37 million for 161 producers. Price spikes in the vanilla bean market follow weather shocks, and beans traded at USD 600 to USD 750 per kilogram after Cyclone Enawo. A government-imposed USD 250 per kilogram export floor in 2022 overshot market-clearing levels, leading to 4,500 metric tons of unsold inventory in 2023. Such volatility deters long-term contracts, prompting manufacturers to hedge with synthetic vanillin.
Surging Availability of Synthetic and Bio-Engineered Vanillin
In May 2024, Professor Toshiki Furuya from Tokyo University of Science successfully developed an enzyme capable of producing vanillin from plant-derived ferulic acid. Ferulic acid, the raw material, is a compound abundantly available from agricultural waste, including rice bran and wheat bran. Vanillin is produced by simply mixing ferulic acid with the developed enzyme at room temperature. A materials-science leader commercialized a bio-based vanillin derived from glucose fermentation, marketing it as “natural” under European regulations. Synthetic vanillin already accounts for approximately 95% of total vanillin volume in the vanilla bean market, as it retails at around USD 12 per kilogram, significantly below the USD 300 minimum for quality vanilla extract. Emerging markets prioritize affordability over clean-label cues, reinforcing the threat of substitution to the vanilla bean market.
*Our forecasts treat driver/restraint impacts as directional, not additive. The impact forecasts reflect baseline growth, mix effects, and variable interactions.
Geography Analysis
North America captured 37.8% in vanilla bean market share in 2025, driven by the United States' strong presence in ice cream and bakery applications, where vanilla remains the most popular flavor. The region's demand is influenced by premiumization trends, as demonstrated by Unilever's plan to remove synthetic vanillin from its ice cream portfolio by 2026, reflecting a shift toward natural ingredients with higher retail value. Canada and Mexico contribute smaller shares but exhibit stable growth, tied to the expansion of their food processing sectors. Traceability mandates are most advanced in North America, with Estée Lauder's blockchain pilot and the Sustainable Vanilla Initiative driving adoption of origin verification systems.
In the vanilla bean market, the Asia-Pacific region is projected to show the fastest CAGR of 7.2% from 2026 to 2031, driven by increasing disposable incomes and rapid urbanization. Dairy processors in China reformulate their premium ice cream lines with natural vanilla to enhance flavor perception, while India’s organized bakery sector benefits from the expansion of quick-service restaurants, which increases the use of vanilla extracts in cakes and fillings. Indonesia, a top producer, also imports Madagascar vanilla for re-export after blending to meet high-spec orders, illustrating intra-regional trade dynamics. Japan’s consumers value single-origin vanilla, especially Tahitian varieties, and are willing to pay higher retail prices. Australia’s greenhouse pilots, if scaled commercially, would reduce regional import dependence.
Germany, France, and the United Kingdom remain major demand centers in the vanilla bean market, where confectionery and dairy manufacturers source Bourbon vanilla as a flavor benchmark. Traceability and deforestation rules compel European buyers to map supply chains at the farm level, incurring extra administrative costs that favor larger processors with digital infrastructure. South America, the Middle East, and Africa remain nascent consumer territories. Premium hospitality and specialty bakery shops in Brazil, Peru, Saudi Arabia, and the United Arab Emirates are beginning to specify single-origin vanilla.


Competitive Landscape
Vanilla production remains highly fragmented across the vanilla bean market among approximately 200,000 smallholder farmers, yet processing and distribution are concentrated in a handful of European and North American flavor houses, such as Symrise, Firmenich, and Givaudan, which control a significant portion of the trade value. Their direct-sourcing models bypass intermediaries, finance local curing centers, and secure premium bean grades that meet the demands of large food and personal-care clients seeking traceability. This structure enables processors to capture margins even when farm-gate prices fluctuate significantly in response to weather shocks or policy interventions.
Strategic moves center on securing supply and expanding the portfolio. Archer Daniels Midland acquired Revela Foods in 2024 to enhance its dairy-flavor capabilities and secure additional vanilla extraction capacity that complements its existing sweet-flavor range. Estée Lauder’s blockchain pilot with 450 Malagasy farmers reduced bean theft by 12% and demonstrated that immutable traceability systems can justify retail premiums while stabilizing upstream relationships. Leading houses simultaneously invest in farmer training and long-term contracts that link price premiums to certification, ensuring compliance with forthcoming European laws on deforestation and corporate supply chains.
In the vanilla bean market, new entrants are pursuing technology-driven niches. Vanilla Vida in Israel and Australian Vanilla Plantations are piloting controlled-environment farms to reduce harvest cycles to 24 months and eliminate cyclone risk, targeting high-value extracts and cosmeceutical markets. Synthetic vanillin producers, such as Solvay, utilize fermentation to produce "natural" vanillin in compliance with European regulations at a significantly lower cost compared to natural extracts, increasing competition in mid-tier food segments. The rising certification requirements, such as achieving 90% Rainforest Alliance content by 2030, are projected to raise compliance costs. This may pressure smaller processors while creating barriers that benefit vertically integrated companies capable of supporting farmer audits and regenerative agriculture transitions.
Recent Industry Developments
- November 2025: The Malagasy government suspended the Conseil National de la Vanille's (CNV) USD 4 per kilogram export levy following industry criticism of fund opacity. The CNV accumulated approximately USD 35 million intended for farmer support, yet disbursement mechanisms remained unclear. The United States removed an additional 15% ad valorem duty on Malagasy vanilla, improving export competitiveness.
- June 2025: The Cosmetic Ingredient Review panel published a safety assessment documenting vanilla extracts in 370 cosmetic formulations, spanning moisturizers, shampoos, and lip balms. The review confirmed the safety profile of vanilla and supported its expanded use in personal care products.
- January 2025: Vanilla Vida in Israel expanded its greenhouse facility to produce vanilla beans year-round using LED lighting and climate control, claiming a 24-month harvest cycle versus 36 to 48 months for field-grown orchids.


Research Methodology Framework and Report Scope
Market Definitions and Key Coverage
Our study defines the vanilla bean market as the yearly global trade value of cured, whole pods from the Vanilla orchid that are shipped in bulk for processing or direct culinary use. Production volumes are mapped through harmonized commodity codes, and transaction values are gathered at the importer and wholesaler level.
Scope Exclusion: We exclude flavored derivatives such as extracts, powders, and synthesized vanillin.
Segmentation Overview
- By Geography
- North America
- United States
- Production Analysis (Area Harvested, Yield, and Production Volume)
- Consumption Analysis (Consumption Value and Volume)
- Import Market Analysis (Import Value, Volume, and Key Supplying Markets)
- Export Market Analysis (Export Value, Volume, and Key Destination Markets)
- Wholesale Price Trend Analysis and Forecast
- Regulatory Framework
- List of Key Players
- Logistics and Infrastructure
- Seasonality Analysis
- Canada
- Production Analysis (Area Harvested, Yield, and Production Volume)
- Consumption Analysis (Consumption Value and Volume)
- Import Market Analysis (Import Value, Volume, and Key Supplying Markets)
- Export Market Analysis (Export Value, Volume, and Key Destination Markets)
- Wholesale Price Trend Analysis and Forecast
- Regulatory Framework
- List of Key Players
- Logistics and Infrastructure
- Seasonality Analysis
- Mexico
- Production Analysis (Area Harvested, Yield, and Production Volume)
- Consumption Analysis (Consumption Value and Volume)
- Import Market Analysis (Import Value, Volume, and Key Supplying Markets)
- Export Market Analysis (Export Value, Volume, and Key Destination Markets)
- Wholesale Price Trend Analysis and Forecast
- Regulatory Framework
- List of Key Players
- Logistics and Infrastructure
- Seasonality Analysis
- United States
- Europe
- Germany
- Production Analysis (Area Harvested, Yield, and Production Volume)
- Consumption Analysis (Consumption Value and Volume)
- Import Market Analysis (Import Value, Volume, and Key Supplying Markets)
- Export Market Analysis (Export Value, Volume, and Key Destination Markets)
- Wholesale Price Trend Analysis and Forecast
- Regulatory Framework
- List of Key Players
- Logistics and Infrastructure
- Seasonality Analysis
- United Kingdom
- Production Analysis (Area Harvested, Yield, and Production Volume)
- Consumption Analysis (Consumption Value and Volume)
- Import Market Analysis (Import Value, Volume, and Key Supplying Markets)
- Export Market Analysis (Export Value, Volume, and Key Destination Markets)
- Wholesale Price Trend Analysis and Forecast
- Regulatory Framework
- List of Key Players
- Logistics and Infrastructure
- Seasonality Analysis
- France
- Production Analysis (Area Harvested, Yield, and Production Volume)
- Consumption Analysis (Consumption Value and Volume)
- Import Market Analysis (Import Value, Volume, and Key Supplying Markets)
- Export Market Analysis (Export Value, Volume, and Key Destination Markets)
- Wholesale Price Trend Analysis and Forecast
- Regulatory Framework
- List of Key Players
- Logistics and Infrastructure
- Seasonality Analysis
- Spain
- Production Analysis (Area Harvested, Yield, and Production Volume)
- Consumption Analysis (Consumption Value and Volume)
- Import Market Analysis (Import Value, Volume, and Key Supplying Markets)
- Export Market Analysis (Export Value, Volume, and Key Destination Markets)
- Wholesale Price Trend Analysis and Forecast
- Regulatory Framework
- List of Key Players
- Logistics and Infrastructure
- Seasonality Analysis
- Russia
- Production Analysis (Area Harvested, Yield, and Production Volume)
- Consumption Analysis (Consumption Value and Volume)
- Import Market Analysis (Import Value, Volume, and Key Supplying Markets)
- Export Market Analysis (Export Value, Volume, and Key Destination Markets)
- Wholesale Price Trend Analysis and Forecast
- Regulatory Framework
- List of Key Players
- Logistics and Infrastructure
- Seasonality Analysis
- Germany
- Asia-Pacific
- China
- Production Analysis (Area Harvested, Yield, and Production Volume)
- Consumption Analysis (Consumption Value and Volume)
- Import Market Analysis (Import Value, Volume, and Key Supplying Markets)
- Export Market Analysis (Export Value, Volume, and Key Destination Markets)
- Wholesale Price Trend Analysis and Forecast
- Regulatory Framework
- List of Key Players
- Logistics and Infrastructure
- Seasonality Analysis
- India
- Production Analysis (Area Harvested, Yield, and Production Volume)
- Consumption Analysis (Consumption Value and Volume)
- Import Market Analysis (Import Value, Volume, and Key Supplying Markets)
- Export Market Analysis (Export Value, Volume, and Key Destination Markets)
- Wholesale Price Trend Analysis and Forecast
- Regulatory Framework
- List of Key Players
- Logistics and Infrastructure
- Seasonality Analysis
- Japan
- Production Analysis (Area Harvested, Yield, and Production Volume)
- Consumption Analysis (Consumption Value and Volume)
- Import Market Analysis (Import Value, Volume, and Key Supplying Markets)
- Export Market Analysis (Export Value, Volume, and Key Destination Markets)
- Wholesale Price Trend Analysis and Forecast
- Regulatory Framework
- List of Key Players
- Logistics and Infrastructure
- Seasonality Analysis
- Australia
- Production Analysis (Area Harvested, Yield, and Production Volume)
- Consumption Analysis (Consumption Value and Volume)
- Import Market Analysis (Import Value, Volume, and Key Supplying Markets)
- Export Market Analysis (Export Value, Volume, and Key Destination Markets)
- Wholesale Price Trend Analysis and Forecast
- Regulatory Framework
- List of Key Players
- Logistics and Infrastructure
- Seasonality Analysis
- Indonesia
- Production Analysis (Area Harvested, Yield, and Production Volume)
- Consumption Analysis (Consumption Value and Volume)
- Import Market Analysis (Import Value, Volume, and Key Supplying Markets)
- Export Market Analysis (Export Value, Volume, and Key Destination Markets)
- Wholesale Price Trend Analysis and Forecast
- Regulatory Framework
- List of Key Players
- Logistics and Infrastructure
- Seasonality Analysis
- China
- South America
- Brazil
- Production Analysis (Area Harvested, Yield, and Production Volume)
- Consumption Analysis (Consumption Value and Volume)
- Import Market Analysis (Import Value, Volume, and Key Supplying Markets)
- Export Market Analysis (Export Value, Volume, and Key Destination Markets)
- Wholesale Price Trend Analysis and Forecast
- Regulatory Framework
- List of Key Players
- Logistics and Infrastructure
- Seasonality Analysis
- Peru
- Production Analysis (Area Harvested, Yield, and Production Volume)
- Consumption Analysis (Consumption Value and Volume)
- Import Market Analysis (Import Value, Volume, and Key Supplying Markets)
- Export Market Analysis (Export Value, Volume, and Key Destination Markets)
- Wholesale Price Trend Analysis and Forecast
- Regulatory Framework
- List of Key Players
- Logistics and Infrastructure
- Seasonality Analysis
- Brazil
- Middle East
- Saudi Arabia
- Production Analysis (Area Harvested, Yield, and Production Volume)
- Consumption Analysis (Consumption Value and Volume)
- Import Market Analysis (Import Value, Volume, and Key Supplying Markets)
- Export Market Analysis (Export Value, Volume, and Key Destination Markets)
- Wholesale Price Trend Analysis and Forecast
- Regulatory Framework
- List of Key Players
- Logistics and Infrastructure
- Seasonality Analysis
- United Arab Emirates
- Production Analysis (Area Harvested, Yield, and Production Volume)
- Consumption Analysis (Consumption Value and Volume)
- Import Market Analysis (Import Value, Volume, and Key Supplying Markets)
- Export Market Analysis (Export Value, Volume, and Key Destination Markets)
- Wholesale Price Trend Analysis and Forecast
- Regulatory Framework
- List of Key Players
- Logistics and Infrastructure
- Seasonality Analysis
- Turkey
- Production Analysis (Area Harvested, Yield, and Production Volume)
- Consumption Analysis (Consumption Value and Volume)
- Import Market Analysis (Import Value, Volume, and Key Supplying Markets)
- Export Market Analysis (Export Value, Volume, and Key Destination Markets)
- Wholesale Price Trend Analysis and Forecast
- Regulatory Framework
- List of Key Players
- Logistics and Infrastructure
- Seasonality Analysis
- Saudi Arabia
- Africa
- South Africa
- Production Analysis (Area Harvested, Yield, and Production Volume)
- Consumption Analysis (Consumption Value and Volume)
- Import Market Analysis (Import Value, Volume, and Key Supplying Markets)
- Export Market Analysis (Export Value, Volume, and Key Destination Markets)
- Wholesale Price Trend Analysis and Forecast
- Regulatory Framework
- List of Key Players
- Logistics and Infrastructure
- Seasonality Analysis
- Uganda
- Production Analysis (Area Harvested, Yield, and Production Volume)
- Consumption Analysis (Consumption Value and Volume)
- Import Market Analysis (Import Value, Volume, and Key Supplying Markets)
- Export Market Analysis (Export Value, Volume, and Key Destination Markets)
- Wholesale Price Trend Analysis and Forecast
- Regulatory Framework
- List of Key Players
- Logistics and Infrastructure
- Seasonality Analysis
- Tanzania
- Production Analysis (Area Harvested, Yield, and Production Volume)
- Consumption Analysis (Consumption Value and Volume)
- Import Market Analysis (Import Value, Volume, and Key Supplying Markets)
- Export Market Analysis (Export Value, Volume, and Key Destination Markets)
- Wholesale Price Trend Analysis and Forecast
- Regulatory Framework
- List of Key Players
- Logistics and Infrastructure
- Seasonality Analysis
- Madagascar
- Production Analysis (Area Harvested, Yield, and Production Volume)
- Consumption Analysis (Consumption Value and Volume)
- Import Market Analysis (Import Value, Volume, and Key Supplying Markets)
- Export Market Analysis (Export Value, Volume, and Key Destination Markets)
- Wholesale Price Trend Analysis and Forecast
- Regulatory Framework
- List of Key Players
- Logistics and Infrastructure
- Seasonality Analysis
- South Africa
- North America
Detailed Research Methodology and Data Validation
Primary Research
Mordor analysts speak with growers in Sava, exporters in Uganda, artisan ice-cream formulators in North America, and bulk buyers across Europe. These discussions verify yield assumptions, typical cured-bean prices, and the pace of organic certification; insights that desk research alone cannot deliver.
Desk Research
We begin with crop statistics from the FAO, export filings on the ITC Trade Map, and customs shipment logs accessed through Volza. Context is strengthened with UN Comtrade price series, CBI buyer guides, and regulatory notes from the EU Novel Food Catalog. Company filings, investor decks, and respected agricultural press help us track supply shocks after cyclones in Madagascar. D&B Hoovers and Dow Jones Factiva are then queried to benchmark processor revenues against declared export receipts, revealing early anomalies that steer the next interview wave. The sources listed are illustrative; many additional public datasets inform our full model.
Market-Sizing & Forecasting
A top-down construct converts FAO tonnage into trade value through triangulated average selling prices, which are then reconciled with sampled exporter invoices for 2024-2025. Limited bottom-up supplier roll-ups around key curing cooperatives act as guardrails. Key variables like cyclone frequency indices, organic acreage, premium ice-cream output, unit import duties, and synthetic vanillin penetration feed a multivariate regression that projects demand to 2030. Gaps in bottom-up evidence are bridged with region-specific price elasticities drawn from survey feedback.
Data Validation & Update Cycle
Outputs pass two analyst reviews, outlier checks against vanilla-extract price curves, and senior sign-off. We refresh the model annually, reopening it sooner if export rules or extreme weather alter fundamentals.
Why Mordor's Vanilla Bean Baseline Commands Reliability
Published estimates often diverge because firms adopt different product scopes, currency years, and update rhythms.
Key gap drivers include mixing extracts with pods, applying retail rather than wholesale prices, and shorter refresh cadences that miss recent duty hikes. Our model fixes scope to cured pods only and is re-benchmarked after each harvest, yielding steadier numbers.
Benchmark comparison
| Market Size | Anonymized source | Primary gap driver |
|---|---|---|
| USD 1.8 Bn (2025) | Mordor Intelligence | |
| USD 1.39 Bn (2025) | Regional Consultancy A | Limited geography, mixes pods with derivatives |
| USD 3.61 Bn (2024) | Trade Journal B | Uses retail price multipliers, includes extracts and powders |
| USD 1.34 Bn (2025) | Global Consultancy C | Applies five-year average prices, ignores recent correction |
These comparisons show that Mordor's disciplined scope selection, data cadence, and dual bottom-up and top-down checks give decision-makers a balanced, transparent baseline they can trust.


Key Questions Answered in the Report
What is the current global value of the vanilla bean market?
The vanilla bean market size is USD 1.70 billion in 2026 and is forecast to reach USD 2.30 billion by 2031 at a 6.23% CAGR.
Which region consumes the most natural vanilla?
North America leads consumption, holding 37.8% share in 2025, primarily through ice cream and bakery applications.
How does cyclone activity in Madagascar influence vanilla pricing?
Cyclones can cut Madagascar output by up to 40%, triggering spot-price spikes that have reached USD 600 to USD 750 per kilogram in past events.
What role does synthetic vanillin play in global supply?
Synthetic and bio-engineered vanillin supply roughly 95% of vanillin volume at costs near USD 12 per kilogram, creating constant substitution pressure on natural vanilla.
Are carbon credits a viable income stream for vanilla farmers?
Pilot projects show agroforestry vanilla can earn USD 16 to USD 60 per hectare annually in voluntary carbon markets, but verification costs still limit large-scale participation.
Which innovations could diversify vanilla production away from Madagascar?
Controlled-environment cultivation in Israel, Australia, and the United States aims to shorten harvest cycles and reduce weather risk, with potential to supply up to 10% of demand by 2035.
Page last updated on:


