
Fresh Apples Market Size and Share
Fresh Apples Market Analysis by Mordor Intelligence
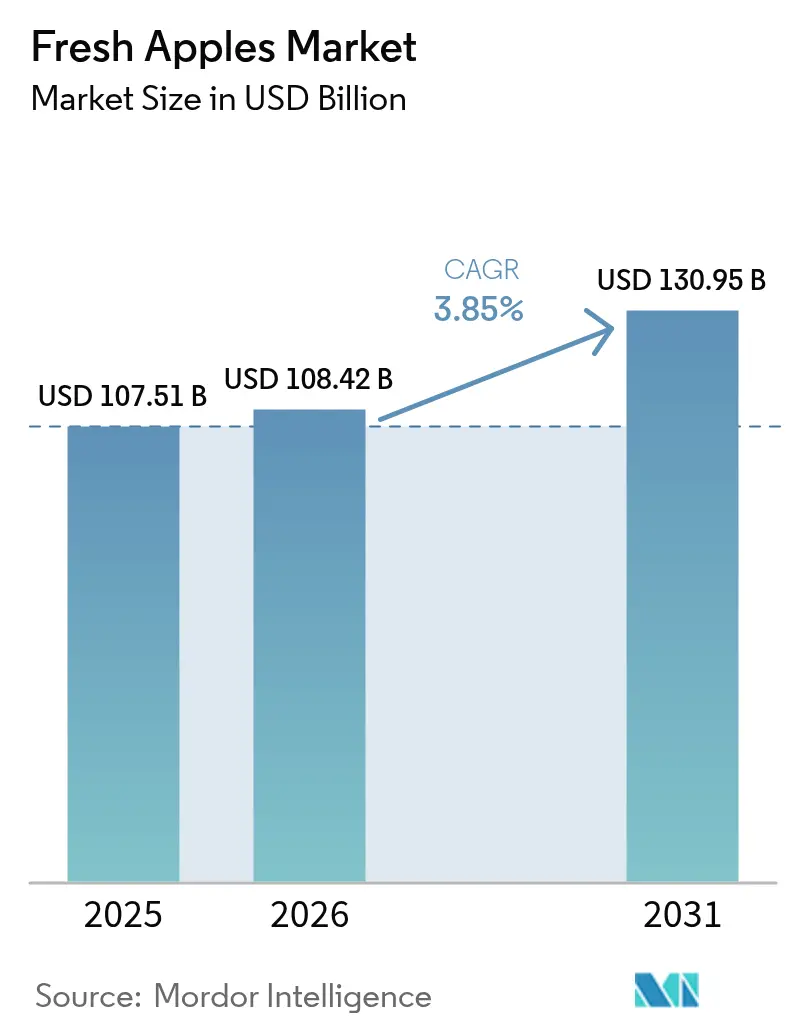
The fresh apples market size is projected to expand from USD 107.51 billion in 2025 and USD 108.42 billion in 2026 to USD 130.95 billion by 2031, registering a CAGR of 3.85% between 2026 to 2031. Steady value growth masks a structural pivot in global supply, as intensive orchard systems across Asia-Pacific now reshape yield curves faster than new acreage expands. Robust consumer demand in rapidly urbanizing economies, the premium commanded by climate-resilient cultivars, and carbon-credit revenue streams together reinforce upward price momentum. Yet climate-driven yield volatility in Europe and North America regularly knocks regional inventories off balance, keeping spot prices sensitive to weather forecasts. Persistent container-rate swings on Pacific and trans-Atlantic lanes amplify this volatility by forcing exporters to manage logistics risk more aggressively.
Key Report Takeaways
- By geography, Asia-Pacific held 52.4% of the fresh apples market share in 2025, and Africa is forecast to post the quickest 4.8% CAGR through 2031.
Note: Market size and forecast figures in this report are generated using Mordor Intelligence’s proprietary estimation framework, updated with the latest available data and insights as of 2026.
Global Fresh Apples Market Trends and Insights
Drivers Impact Analysis*
| Driver | (~) % Impact on CAGR Forecast | Geographic Relevance | Impact Timeline |
|---|---|---|---|
| High-density orchard expansion in China and India | +0.7% | Asia-Pacific core, and spillover to Central Asia | Medium term (2-4 years) |
| Organic acreage incentives in the European Union | +0.4% | Europe, export effects in North Africa and Middle East | Long term (≥ 4 years) |
| Cultivar innovation for climate resilience | +0.5% | Global, early gains in North America, Europe, and Oceania | Long term (≥ 4 years) |
| Monetization of orchard-based carbon credits | +0.2% | North America and European Union, pilots in South America | Long term (≥ 4 years) |
| Adoption of precision orcharding robotics | +0.6% | North America, Western Europe, and advanced Asia-Pacific markets | Medium term (2-4 years) |
| Commercialization of gene-edited non-browning varieties | +0.2% | North America, pending approvals in European Union and Asia | Medium term (2-4 years) |
| Source: Mordor Intelligence | |||
High-Density Orchard Expansion in China and India
China converted about 1.2 million hectares to high-density systems between 2020 and 2025, boosting yields to 35-40 metric tons per hectare, up from 15-20 metric tons in legacy apple orchards[1]Source: Ministry of Agriculture and Rural Affairs, “Statistical Communiqué on China’s Agriculture,” moa.gov.cn. In India, state incentives covering half the cost of rootstock and trellis infrastructure drove an 18% increase in high-density acreage in 2024. Shorter time to commercial production, together with drip-based fertigation that trims water use by up to 40%, improves payback periods and aligns with tightening environmental standards. Capital intensity remains a hurdle because smaller growers lack access to long-term credit. Consolidation among well-financed producers therefore advances quickly in Himachal Pradesh and Shaanxi, concentrating value capture and raising quality benchmarks within the fresh apples market.
Organic Acreage Incentives in the European Union
The European Union's incentives for organic apple production align with the Farm to Fork strategy, which aims to convert 25% of agricultural land to organic farming by 2030[2]Source: IFOAM Organics Europe, "Only two more months to apply for EU funds to promote organic food & farming,"organicseurope.bio . These payments aim to support farmers during the transition to organic farming, covering costs associated with certification and sustainable practices. Retailers in Germany, France, and Italy offer premiums of 40-60% for certified organic fruit, incentivizing growers to complete the mandatory three-year transition period. Poland leverages lower land costs to export organic apples to Western Europe, demonstrating how policy incentives influence intra-European trade patterns. Challenges such as reduced yields during the conversion period and limited biocontrol options for fire blight and codling moth slow adoption. These issues highlight the need for continued research and innovation in organic farming methods. Despite these obstacles, growing consumer demand for residue-free produce supports the continued growth of the organic fresh apples market, with retailers and policymakers playing a crucial role in driving this trend.
Monetization of Orchard-Based Carbon Credits
California’s Healthy Soils Program and the European Union Carbon Farming Initiative enable sequestration projects that generate credits trading at USD 15-25 per metric ton of carbon dioxide equivalent. A forty-hectare apple orchard adopting cover cropping and biochar can earn USD 3,000-5,000 annually, though verification can consume up to 40% of the gross credit value. Washington State’s aggregation pilot cut transaction costs for smaller holdings by half. Additionally, rules exclude many apple growers already practicing conservation, limiting early enrollment, yet the revenue promise nudges larger operators toward quantifiable soil-carbon strategies. The mechanism positions carbon finance as an auxiliary growth lever in the fresh apples market.
Commercialization of Gene-Edited Non-Browning Varieties
The introduction of gene-edited non-browning apples, particularly under the "Arctic Apple" brand, marks a notable advancement in agricultural biotechnology aimed at minimizing food waste and improving convenience. The non-browning trait reduces the need for citric-acid dips, lowering unit costs in pre-cut product lines. Consumer surveys indicate that 35-45% of shoppers prefer non-GMO labels, prompting retailers to approach cautiously. In the European Union, regulatory frameworks continue to classify gene-edited crops as genetically modified, restricting market entry until legal revisions are made. Additionally, intellectual property restrictions limit international licensing, providing North American growers with a first-mover advantage in the fresh apples market.
Restraints Impact Analysis*
| Restraint | (~) % Impact on CAGR Forecast | Geographic Relevance | Impact Timeline |
|---|---|---|---|
| Climate-driven yield volatility | -0.6% | Global, acute in North America, Europe, and Oceania | Short term (≤ 2 years) |
| Intensifying pest and disease pressure | -0.4% | Global, particularly Europe, North America, and Asia | Medium term (2-4 years) |
| Orchard water use regulations tightening | -0.3% | Western United States, Southern Europe, Australia, and Chile | Medium term (2-4 years) |
| Shipping container rate spikes on key export lanes | -0.5% | Pacific and trans-Atlantic corridors | Short term (≤ 2 years) |
| Source: Mordor Intelligence | |||
Intensifying Pest and Disease Pressure
Fire blight infection reached 10-15% of trees in parts of North America and Europe during 2024-2025, triggering costly tree removal at USD 3,000-5,000 per hectare[3]Source: Risk Management Agency, “Summary of Business,” United States Department of Agriculture, rma.usda.gov. Codling moth expanded northward into Sweden and Scotland as winters warmed, while apple scab resistance to key fungicides forced growers to rotate to older chemistries with lower efficacy. Organic producers, restricted from synthetic treatments, lost up to 30% of yield in wet years, narrowing economic margins. Adoption of pheromone traps and parallel scouting cuts pesticide use by one-third, yet upfront monitoring costs hold back widespread rollout. Rising biological pressure elevates input uncertainty in the fresh apples market.
Shipping Container Rate Spikes on Key Export Lanes
Freight rates from Chile to Asia hit USD 8,000-10,000 per forty-foot unit in early 2025, almost triple from 2023 levels, compressing margins for mid-value cultivars. New Zealand faced comparable hikes, nudging exporters toward premium varieties that can absorb logistics surcharges. Polish shippers endured Mediterranean rate swings between USD 2,000 and 4,500, complicating seasonal contract talks with Middle Eastern buyers. Air freight at USD 4.50-6.00 per kilogram remains viable only for niche organic and specialty apples. Cost spikes are accelerating investment in controlled atmosphere storage, which stretches marketing windows but requires USD 500-800 per metric ton in new capacity. Logistics turbulence, therefore, curbs short-term export volumes across the fresh apples market.
*Our forecasts treat driver/restraint impacts as directional, not additive. The impact forecasts reflect baseline growth, mix effects, and variable interactions.
Geography Analysis
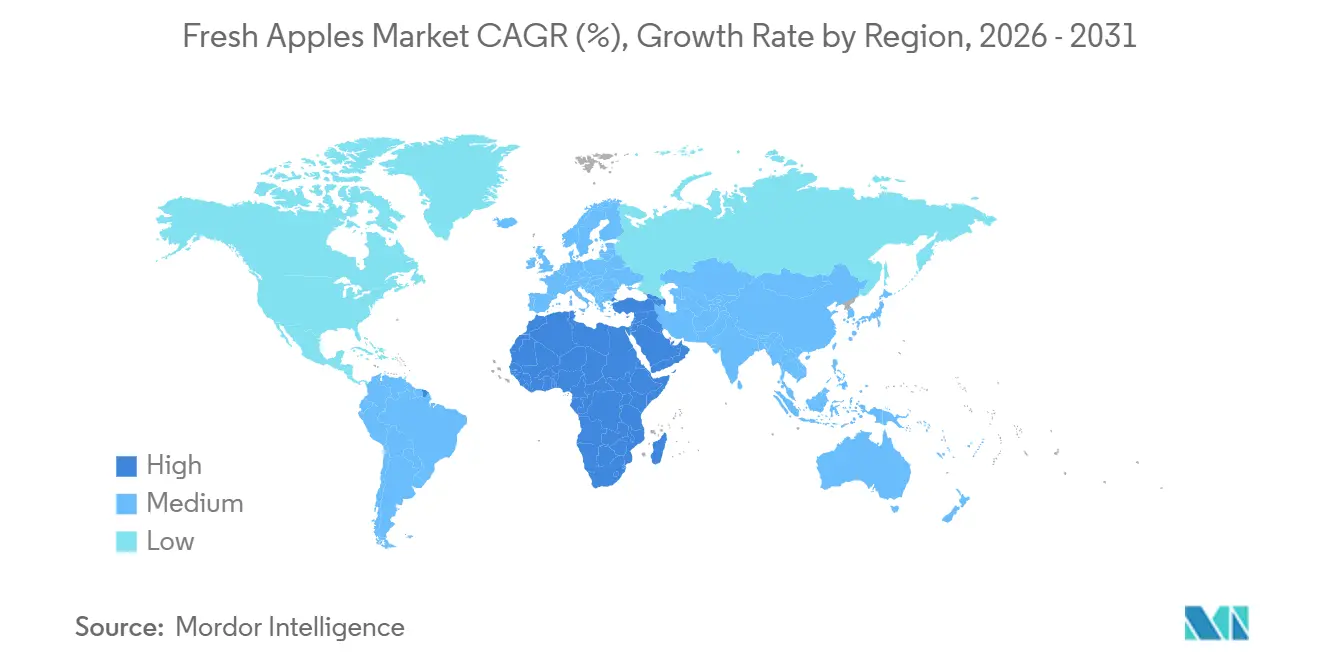
Asia-Pacific accounted for 52.4% of the fresh apples market share in 2025 and continues to define volume, price, and variety preferences. Yield gains of 35-50% from high-density orchards in Shaanxi, Shandong, and Himachal Pradesh offset land constraints, while premium cultivars such as Fuji and Envy retail at USD 3.00-5.00 per kilogram in Chinese tier-one supermarkets. Japan focuses on ultra-premium gifting apples that command over USD 10.00 per kilogram, though the grower is 67 years old, highlighting looming succession challenges. Southeast Asian imports are delivering double-digit growth, intensifying competition among New Zealand, the United States, and Chinese exporters for tariff-advantaged slots.
Africa records the fastest regional growth, with a projected 4.8% CAGR, anticipated to elevate its share of the fresh apples market by 2031. South Africa exported 1.1 million metric tons in 2025, using GlobalGAP certification to unlock shelf space in the European Union and Asia at attractive margins. Egypt harvested 850,000 metric tons and consumed 70% domestically, while shipping the remainder to Gulf states. Morocco’s drip-irrigated, high-density projects illustrate North Africa’s role as an emergent supplier, though cold-chain gaps still cap large-scale exports. These dynamics confirm that Africa is the fastest-growing geography in the fresh apples market.
Europe produced 12.5 million metric tons in 2025, with Poland supplying one-third and exporting 1.2 million metric tons mainly into neighboring European Union markets and the Middle East. Farm-to-Fork pesticide-reduction targets raise production costs by 20-30%, nudging growers toward integrated pest management or organic certification. Italy’s cooperative models pool resources for controlled-atmosphere storage and safeguard quality differentiation. Spain and France faced yield dips due to frost and water shortages, tightening intra-European spot availability during 2025-2026. Russia’s import-substitution drive lifted national output to 1.9 million metric tons, but quality gaps persist, maintaining demand for Polish and Turkish fruit in premium supermarket tiers.


Regulatory Landscape
Global fresh-apple trade is governed primarily by phytosanitary and food-safety controls aligned to the WTO Agreement on the Application of Sanitary and Phytosanitary (SPS) Measures, which anchors members' import requirements to internationally recognized standards and science-based risk assessment. A key harmonization step is the International Plant Protection Convention (IPPC) workstream on commodity-specific standards, where the IPPC Technical Panel on Commodity Standards is drafting a commodity standard for Malus domestica (apple). The first consultation on the draft is planned for July 2026.
Market access also reflects region-specific import conditions and trade instruments. In the European Union, technical requirements such as maximum residue limits and post-harvest treatment rules have constrained certain origins, including ongoing restrictions linked to diphenylamine (DPA) and morpholine use in waxes. Separately, Regulation (EU) 2026/1455 (25 June 2026) adjusted customs duties and tariff quotas for agricultural imports from the United States, explicitly covering fresh apples under CN 0808 10 80. In South Asia, bilateral trade discussions have used tariff and price instruments to manage inflows, including India maintaining a 50% tariff and a minimum import price structure on general apple imports while applying a quota-specific framework for U.S. apples during February 2026 interim-trade discussions.
Value Chain Analysis
The fresh apples value chain runs from input suppliers (nurseries, rootstocks, fertilizers, crop protection, irrigation and trellis systems) through orchard production, harvest labor, and packhouses (grading, optical sorting, packing). It then extends into cold chain (cold rooms and controlled-atmosphere storage), logistics (trucking, reefer containers, ocean freight), and downstream channels such as exporters, wholesalers, supermarkets, and foodservice. Cost and performance are shaped by orchard-system design, including high-density plantings, and by post-harvest capability, particularly controlled-atmosphere storage. That storage can extend marketing windows, but it requires substantial capital per unit of new capacity.
Key bottlenecks include labor intensity, often a major share of production cost, and tightening residue compliance demands in export markets. Logistics volatility on major shipping corridors also affects scheduling and throughput. Recent operational signals reinforce the role of storage and packing as strategic control points: the U.S. Apple Association reported U.S. fresh apple holdings at 37 million bushels in June 2026, down 8% from June 2025, which influences packout pacing and shipment planning through the marketing season. Export-oriented producers are also upgrading physical infrastructure to protect throughput and fruit quality, illustrated by Ceres Fruit Growers completing major packhouse infrastructure upgrades in South Africa, including mobile racking for 4,000 pallets and higher loading and dispatch capacity.
Competitive Landscape
Global supply shows heavy fragmentation, with smallholders dominating acreage, especially in Asia, while export-oriented regions consolidate to meet certification and traceability protocols. Chinese orchards average below two hectares, and cooperatives handle aggregation, yet varying quality continues to limit direct access to premium international chains. Washington State growers, by contrast, operate 100-500 hectare holdings and follow standardized rootstock and post-harvest regimens that exceed retailer specifications, securing dependable shelf space in North America and Asia. Polish groups invest in modern storage and optical sorting, pushing the region’s competitive edge against lower-cost Turkish fruit.
Technology uptake drives differentiation. Washington State partnered with IBM Food Trust in 2024 for blockchain traceability that verifies orchard origin and residue compliance in seconds. New Zealand exporters deploy real-time atmospheric control in ocean containers to deliver crisp apples after 25-day voyages, enabling premium pricing in Shanghai and Ho Chi Minh City. Patent activity across the United States, European Union, and China reached 127 filings during 2024-2025 for rootstocks, coatings, and gene-edited traits, underscoring persistent innovation investment
Downstream concentration reshapes bargaining power. Supermarket chains account for 60-70% of fresh apple sales in developed markets, imposing private-label specifications that smaller growers find costly to meet. Controlled-environment storage expansion, such as Stemilt Growers’ USD 45 million build-out for 12 million boxes, prolongs selling windows and improves negotiating leverage. Cooperative and vertically integrated models emerge as strategic responses, pooling capital for robotics, storage, and marketing programs. These counterweights shape a moderately consolidated yet regionally varied fresh apples market.
Market Opportunities and Future Outlook
Automation and smart post-harvest logistics remain a key whitespace for growers and exporters facing labor constraints and tighter delivery specifications from modern retail. In New Zealand, Mr Apple opened a 7,000 m2 smart logistics and cold storage hub in Whakatu, Hawke's Bay in June 2026. The facility is designed to process about 3,000 apple bins per day, illustrating how integrated cold-chain and handling investments are being used to lift packout efficiency and protect export quality on long-haul routes.
A second opportunity area involves orchard-compatible robotics and multi-task mechanization that reduces reliance on seasonal labor while improving input precision. Research commercialization is also moving forward, including Michigan State University's April 2026 announcement of a modular dual-arm apple harvester concept that can be redeployed for multiple tasks (harvesting, pruning, and targeted spraying). This aligns with the broader shift toward high-density, trellised orchards that are more machine-readable. On the demand and trade side, global export economics continue to favor premiumization and compliance-ready supply chains, with 2025 global fresh apple export value recorded at USD 8.15 billion. That value base supports continued investment in traceability, residue management, and controlled-atmosphere storage to preserve eating quality over extended distribution distances.
Recent Industry Developments
- July 2026: The USDA authorized flexibility and streamlined crop insurance processes for apple growers impacted by a late-April freeze across Maryland, Michigan, New York, Pennsylvania, Virginia, and West Virginia. The action reduced administrative friction in claims handling and helped growers stabilize cash flow decisions tied to harvest, replanting, and orchard management after weather shocks.
- June 2026: Soluna launched its premium Australian apple brand in Mainland China through partnerships with Joy Wing Mau Group and Riverking Group. The move strengthened channel access in a high-value import market and underscored the role of local distribution partners in scaling branded apple programs.
- May 2026: CIV partnered with India-based Qul Fruits to establish IVAR, a platform for managing protected fruit varieties in South Asia, following a launch event in Srinagar, Kashmir. The initiative supports structured variety licensing and commercialization, aligning growers and marketers around differentiated cultivars and more formalized supply programs.


Research Methodology Framework and Report Scope
Market Definition and Coverage
For this study, the fresh apples market is counted as the value of apples sold for fresh eating, tracked through the supply chain using production, consumption, trade, and wholesale price signals across major producing and importing countries.
Scope exclusions: Processed apple products like juice, cider, concentrates, applesauce, dried slices, and canned apples are not counted.
Segmentation Overview
-
By Geography
-
North America
-
United States
- Production Analysis (Area Harvested, Yield, and Production Volume)
- Consumption Analysis (Consumption Value and Volume)
- Import Market Analysis (Import Value, Volume, and Key Supplying Markets)
- Export Market Analysis (Export Value, Volume, and Key Destination Markets)
- Wholesale Price Trend Analysis and Forecast
- Regulatory Framework
- List of Key Players
- Logistics and Infrastructure
- Seasonality Analysis
-
Mexico
- Production Analysis (Area Harvested, Yield, and Production Volume)
- Consumption Analysis (Consumption Value and Volume)
- Import Market Analysis (Import Value, Volume, and Key Supplying Markets)
- Export Market Analysis (Export Value, Volume, and Key Destination Markets)
- Wholesale Price Trend Analysis and Forecast
- Regulatory Framework
- List of Key Players
- Logistics and Infrastructure
- Seasonality Analysis
-
Canada
- Production Analysis (Area Harvested, Yield, and Production Volume)
- Consumption Analysis (Consumption Value and Volume)
- Import Market Analysis (Import Value, Volume, and Key Supplying Markets)
- Export Market Analysis (Export Value, Volume, and Key Destination Markets)
- Wholesale Price Trend Analysis and Forecast
- Regulatory Framework
- List of Key Players
- Logistics and Infrastructure
- Seasonality Analysis
-
United States
-
Europe
-
Germany
- Production Analysis (Area Harvested, Yield, and Production Volume)
- Consumption Analysis (Consumption Value and Volume)
- Import Market Analysis (Import Value, Volume, and Key Supplying Markets)
- Export Market Analysis (Export Value, Volume, and Key Destination Markets)
- Wholesale Price Trend Analysis and Forecast
- Regulatory Framework
- List of Key Players
- Logistics and Infrastructure
- Seasonality Analysis
-
United Kingdom
- Production Analysis (Area Harvested, Yield, and Production Volume)
- Consumption Analysis (Consumption Value and Volume)
- Import Market Analysis (Import Value, Volume, and Key Supplying Markets)
- Export Market Analysis (Export Value, Volume, and Key Destination Markets)
- Wholesale Price Trend Analysis and Forecast
- Regulatory Framework
- List of Key Players
- Logistics and Infrastructure
- Seasonality Analysis
-
France
- Production Analysis (Area Harvested, Yield, and Production Volume)
- Consumption Analysis (Consumption Value and Volume)
- Import Market Analysis (Import Value, Volume, and Key Supplying Markets)
- Export Market Analysis (Export Value, Volume, and Key Destination Markets)
- Wholesale Price Trend Analysis and Forecast
- Regulatory Framework
- List of Key Players
- Logistics and Infrastructure
- Seasonality Analysis
-
Poland
- Production Analysis (Area Harvested, Yield, and Production Volume)
- Consumption Analysis (Consumption Value and Volume)
- Import Market Analysis (Import Value, Volume, and Key Supplying Markets)
- Export Market Analysis (Export Value, Volume, and Key Destination Markets)
- Wholesale Price Trend Analysis and Forecast
- Regulatory Framework
- List of Key Players
- Logistics and Infrastructure
- Seasonality Analysis
-
Italy
- Production Analysis (Area Harvested, Yield, and Production Volume)
- Consumption Analysis (Consumption Value and Volume)
- Import Market Analysis (Import Value, Volume, and Key Supplying Markets)
- Export Market Analysis (Export Value, Volume, and Key Destination Markets)
- Wholesale Price Trend Analysis and Forecast
- Regulatory Framework
- List of Key Players
- Logistics and Infrastructure
- Seasonality Analysis
-
Spain
- Production Analysis (Area Harvested, Yield, and Production Volume)
- Consumption Analysis (Consumption Value and Volume)
- Import Market Analysis (Import Value, Volume, and Key Supplying Markets)
- Export Market Analysis (Export Value, Volume, and Key Destination Markets)
- Wholesale Price Trend Analysis and Forecast
- Regulatory Framework
- List of Key Players
- Logistics and Infrastructure
- Seasonality Analysis
-
Russia
- Production Analysis (Area Harvested, Yield, and Production Volume)
- Consumption Analysis (Consumption Value and Volume)
- Import Market Analysis (Import Value, Volume, and Key Supplying Markets)
- Export Market Analysis (Export Value, Volume, and Key Destination Markets)
- Wholesale Price Trend Analysis and Forecast
- Regulatory Framework
- List of Key Players
- Logistics and Infrastructure
- Seasonality Analysis
-
Germany
-
Asia-Pacific
-
China
- Production Analysis (Area Harvested, Yield, and Production Volume)
- Consumption Analysis (Consumption Value and Volume)
- Import Market Analysis (Import Value, Volume, and Key Supplying Markets)
- Export Market Analysis (Export Value, Volume, and Key Destination Markets)
- Wholesale Price Trend Analysis and Forecast
- Regulatory Framework
- List of Key Players
- Logistics and Infrastructure
- Seasonality Analysis
-
India
- Production Analysis (Area Harvested, Yield, and Production Volume)
- Consumption Analysis (Consumption Value and Volume)
- Import Market Analysis (Import Value, Volume, and Key Supplying Markets)
- Export Market Analysis (Export Value, Volume, and Key Destination Markets)
- Wholesale Price Trend Analysis and Forecast
- Regulatory Framework
- List of Key Players
- Logistics and Infrastructure
- Seasonality Analysis
-
Japan
- Production Analysis (Area Harvested, Yield, and Production Volume)
- Consumption Analysis (Consumption Value and Volume)
- Import Market Analysis (Import Value, Volume, and Key Supplying Markets)
- Export Market Analysis (Export Value, Volume, and Key Destination Markets)
- Wholesale Price Trend Analysis and Forecast
- Regulatory Framework
- List of Key Players
- Logistics and Infrastructure
- Seasonality Analysis
-
New Zealand
- Production Analysis (Area Harvested, Yield, and Production Volume)
- Consumption Analysis (Consumption Value and Volume)
- Import Market Analysis (Import Value, Volume, and Key Supplying Markets)
- Export Market Analysis (Export Value, Volume, and Key Destination Markets)
- Wholesale Price Trend Analysis and Forecast
- Regulatory Framework
- List of Key Players
- Logistics and Infrastructure
- Seasonality Analysis
-
Vietnam
- Production Analysis (Area Harvested, Yield, and Production Volume)
- Consumption Analysis (Consumption Value and Volume)
- Import Market Analysis (Import Value, Volume, and Key Supplying Markets)
- Export Market Analysis (Export Value, Volume, and Key Destination Markets)
- Wholesale Price Trend Analysis and Forecast
- Regulatory Framework
- List of Key Players
- Logistics and Infrastructure
- Seasonality Analysis
-
Thailand
- Production Analysis (Area Harvested, Yield, and Production Volume)
- Consumption Analysis (Consumption Value and Volume)
- Import Market Analysis (Import Value, Volume, and Key Supplying Markets)
- Export Market Analysis (Export Value, Volume, and Key Destination Markets)
- Wholesale Price Trend Analysis and Forecast
- Regulatory Framework
- List of Key Players
- Logistics and Infrastructure
- Seasonality Analysis
-
Taiwan
- Production Analysis (Area Harvested, Yield, and Production Volume)
- Consumption Analysis (Consumption Value and Volume)
- Import Market Analysis (Import Value, Volume, and Key Supplying Markets)
- Export Market Analysis (Export Value, Volume, and Key Destination Markets)
- Wholesale Price Trend Analysis and Forecast
- Regulatory Framework
- List of Key Players
- Logistics and Infrastructure
- Seasonality Analysis
-
China
-
South America
-
Brazil
- Production Analysis (Area Harvested, Yield, and Production Volume)
- Consumption Analysis (Consumption Value and Volume)
- Import Market Analysis (Import Value, Volume, and Key Supplying Markets)
- Export Market Analysis (Export Value, Volume, and Key Destination Markets)
- Wholesale Price Trend Analysis and Forecast
- Regulatory Framework
- List of Key Players
- Logistics and Infrastructure
- Seasonality Analysis
-
Argentina
- Production Analysis (Area Harvested, Yield, and Production Volume)
- Consumption Analysis (Consumption Value and Volume)
- Import Market Analysis (Import Value, Volume, and Key Supplying Markets)
- Export Market Analysis (Export Value, Volume, and Key Destination Markets)
- Wholesale Price Trend Analysis and Forecast
- Regulatory Framework
- List of Key Players
- Logistics and Infrastructure
- Seasonality Analysis
-
Chile
- Production Analysis (Area Harvested, Yield, and Production Volume)
- Consumption Analysis (Consumption Value and Volume)
- Import Market Analysis (Import Value, Volume, and Key Supplying Markets)
- Export Market Analysis (Export Value, Volume, and Key Destination Markets)
- Wholesale Price Trend Analysis and Forecast
- Regulatory Framework
- List of Key Players
- Logistics and Infrastructure
- Seasonality Analysis
-
Brazil
-
Middle East
-
United Arab Emirates
- Production Analysis (Area Harvested, Yield, and Production Volume)
- Consumption Analysis (Consumption Value and Volume)
- Import Market Analysis (Import Value, Volume, and Key Supplying Markets)
- Export Market Analysis (Export Value, Volume, and Key Destination Markets)
- Wholesale Price Trend Analysis and Forecast
- Regulatory Framework
- List of Key Players
- Logistics and Infrastructure
- Seasonality Analysis
-
Iran
- Production Analysis (Area Harvested, Yield, and Production Volume)
- Consumption Analysis (Consumption Value and Volume)
- Import Market Analysis (Import Value, Volume, and Key Supplying Markets)
- Export Market Analysis (Export Value, Volume, and Key Destination Markets)
- Wholesale Price Trend Analysis and Forecast
- Regulatory Framework
- List of Key Players
- Logistics and Infrastructure
- Seasonality Analysis
-
Morocco
- Production Analysis (Area Harvested, Yield, and Production Volume)
- Consumption Analysis (Consumption Value and Volume)
- Import Market Analysis (Import Value, Volume, and Key Supplying Markets)
- Export Market Analysis (Export Value, Volume, and Key Destination Markets)
- Wholesale Price Trend Analysis and Forecast
- Regulatory Framework
- List of Key Players
- Logistics and Infrastructure
- Seasonality Analysis
-
United Arab Emirates
-
Africa
-
Egypt
- Production Analysis (Area Harvested, Yield, and Production Volume)
- Consumption Analysis (Consumption Value and Volume)
- Import Market Analysis (Import Value, Volume, and Key Supplying Markets)
- Export Market Analysis (Export Value, Volume, and Key Destination Markets)
- Wholesale Price Trend Analysis and Forecast
- Regulatory Framework
- List of Key Players
- Logistics and Infrastructure
- Seasonality Analysis
-
South Africa
- Production Analysis (Area Harvested, Yield, and Production Volume)
- Consumption Analysis (Consumption Value and Volume)
- Import Market Analysis (Import Value, Volume, and Key Supplying Markets)
- Export Market Analysis (Export Value, Volume, and Key Destination Markets)
- Wholesale Price Trend Analysis and Forecast
- Regulatory Framework
- List of Key Players
- Logistics and Infrastructure
- Seasonality Analysis
-
Egypt
-
North America
Data Sources, Market Sizing, and Validation
Desk Research
Desk work starts with mapping the real-world apples flow by country and checking if production, net trade, and apparent consumption line up. We rely on public agriculture statistics and trade series, such as FAOSTAT, USDA data releases, Eurostat, UN Comtrade, and customs or port authority summaries where available. Wholesale and farmgate price direction is taken from official market bulletins and agriculture ministries, then cross-checked against large retailer and terminal market references reported in reputable press.
To avoid building the model on one dataset, we use multiple sources for the same variable, and we document gaps before adding any values into the sizing sheet. Company annual reports, investor presentations, and industry association updates are used mainly to sense-check storage infrastructure, capacity additions, and export readiness. In a few cases, subscription databases support company financials, patent activity in post-harvest handling, and shipment-level trade checks, but the sizing logic remains anchored to public series. The sources listed here are illustrative, and other references were used to collect data, validate it, and clarify open questions.
Primary Interviews and Surveys
Primary work is used to confirm how prices move through the season, how much product is diverted away from fresh sales, and how trade disruptions show up in realized volumes. We speak with growers, packers, exporters, importers, wholesalers, and large buyers so assumptions on pack-out rates, storage loss, and grade mix stay realistic across APAC, EMEA, and the Americas.
Distribution of primary research fieldwork respondents
| Company type | Respondent position | Region |
|---|---|---|
| Top tier: 27% | CXOs: 18% | APAC: 42% |
| Mid tier: 53% | Functional/Unit leaders: 40% | EMEA: 33% |
| Smaller Players: 20% | Managers: 42% | Americas: 25% |
Market-Sizing & Forecasting
The core build uses a top-down approach where production and trade data reconstruct fresh-eating availability by country, which is then converted to value using wholesale price trends and typical grade and pack-out behavior. Since official series can lag or differ in coverage, totals are corroborated with selective bottom-up checks, such as sampled exporter and importer shipment mixes, channel markups described in interviews, and spot price to contract price spreads.
Inputs that matter for fresh apples include harvested area and yield changes, export and import volumes by key corridors, cold storage and controlled-atmosphere penetration, seasonal price bands, and the share of supply that shifts into processing during weak demand periods. When a country has limited public price series, we proxy it using regional wholesale references adjusted for trade parity and inflation, and then we validate the direction with local participants. For forecasting, scenario analysis is used around weather-driven yield volatility and freight or trade policy shocks, and the base case is kept consistent with expert expectations on planted area and productivity improvements over the period.
Data Validation & Update Cycle
Validation is done by comparing the model outputs with independent signals such as per capita fruit consumption patterns, exporter shipment momentum, and price movements during peak harvest and storage drawdown months. If a region shows a jump that is not explained by production, trade, or pricing, it is flagged and reviewed again, and the assumptions are rechecked with a fresh outreach.
Before sign-off, the workbook is reviewed in steps so geography totals, currency conversions, and year-on-year movements match the underlying drivers. Reports are refreshed annually, and interim updates are made when material events occur, such as major crop shortfalls or sudden trade restrictions. Right before delivery, a final update pass is run so the view reflects the latest available data.
Mordor Intelligence's Fresh Apples Market Size Compared Against Other Published Estimates
Published numbers for fresh apples can vary even when they appear to cover the same topic, because each study chooses its own mix of geography coverage, fresh versus processed boundaries, and how it converts volumes into value across seasons.
The table shows a clear spread, and in Mordor Intelligence's model the value is tied to fresh apples using production, consumption, import-export, and wholesale price trend checks together, instead of blending in processing-led demand or using a single global average price curve.
Benchmark comparison
| Source | Market Size | Gaps in Research Methodology |
|---|---|---|
| Mordor Intelligence | USD 107.51 B (2025) | |
| Global Research Publisher A | USD 101.04 B (2025) | Uses a narrower value build centered on fresh retail and handling economics with simpler pricing assumptions, which can understate value in high-price importing markets when trade and wholesale spreads widen. |
| Industry Research Publisher B | USD 85.64 B (2025) | Applies a lower growth and pricing path and appears to rely more on generalized demand projections, which can miss supply tightness years where yields fall and wholesale prices rise sharply. |
Taken together, the differences mostly come from what is counted as fresh-only, how the price per unit is constructed across regions, and how supply shocks are treated in the forecast. By keeping the variables visible and the steps repeatable, our estimate stays easier to trace back to real production, trade, and price signals.


Key Questions Answered in the Report
What is the growth outlook for the fresh apples market through 2031?
Value is forecast to rise from USD 108.42 billion in 2026 to USD 130.95 billion by 2031 at a 3.85% CAGR, aided by high-density orchards and premium cultivar demand.
Which region holds the dominant share of fresh apple consumption?
Asia-Pacific accounted for 52.4% of global consumption value in 2025, driven primarily by China’s large domestic appetite.
Why are high-density orchards expanding rapidly?
They cut the time to first commercial harvest to four years, double per-hectare yields, and reduce water use by up to 40%, improving farm profitability.
How are logistics challenges affecting exporters?
Container rate spikes on Pacific and trans-Atlantic lanes compress margins and prompt investment in controlled-atmosphere storage to delay shipments.
What role do carbon credits play for apple growers?
Verified soil-carbon projects can add USD 3,000-5,000 per year for a forty-hectare orchard, although verification costs absorb a significant share.
Page last updated on:


 Your data is secure and never sold or shared.



