Market Overview
| Study Period | 2020 - 2031 |
|---|---|
| Forecast Data Period | 2026 - 2031 |
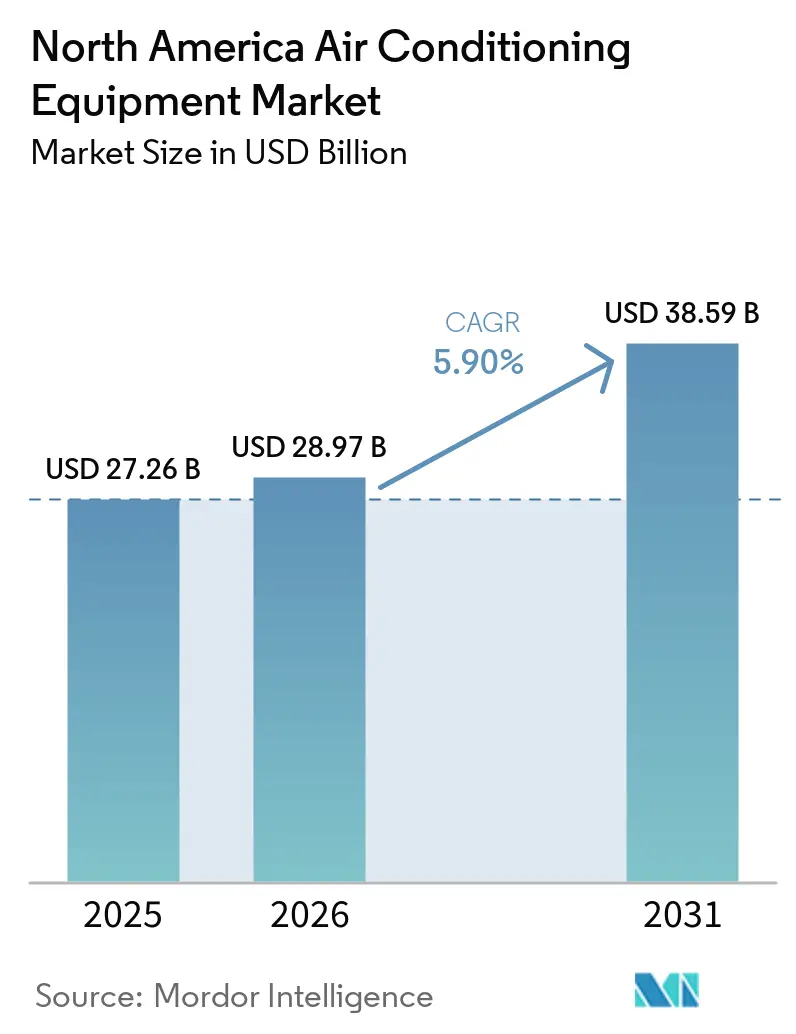
| Base Year Market Size (2025) | USD 27.26 Billion |
| Market Size (2026) | USD 28.97 Billion |
| Market Size (2031) | USD 38.59 Billion |
| Growth Rate (2026 - 2031) | 5.90% CAGR |
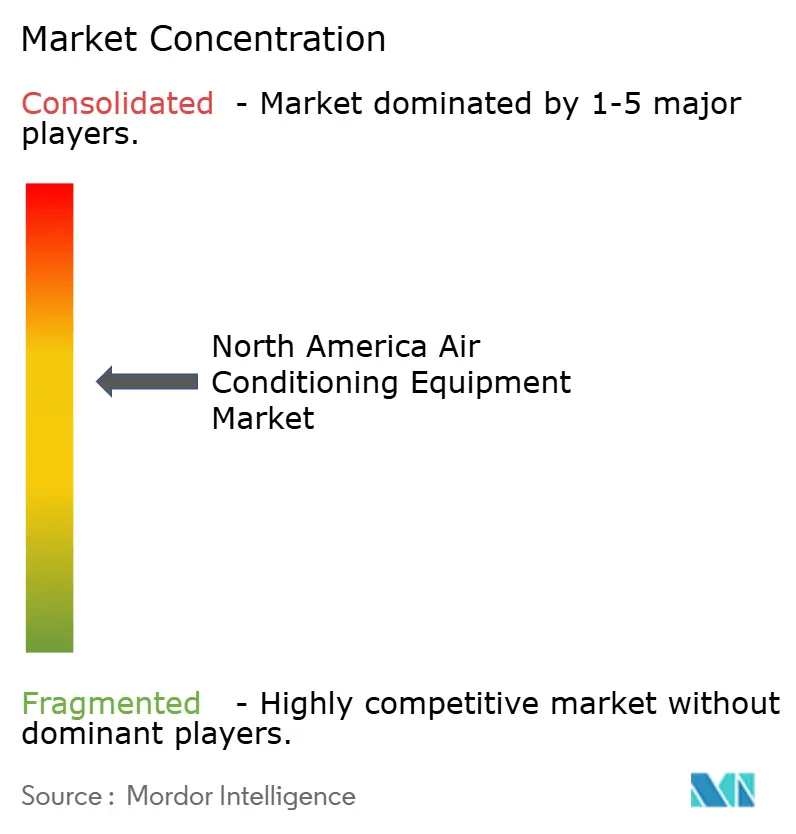
| Market Concentration | Medium |
Major Players *Disclaimer: Major Players sorted in no particular order Image © Mordor Intelligence. Reuse requires attribution under CC BY 4.0. | |
North America Air Conditioning Equipment Market Analysis by Mordor Intelligence
The North America air conditioning equipment market size is expected to grow from USD 27.26 billion in 2025 to USD 28.97 billion in 2026 and is forecast to reach USD 38.59 billion by 2031 at 5.9% CAGR over 2026-2031. Renewal of federal tax credits, accelerated replacement of rooftop units installed before 2010, and hyperscale data-center expansion are reshaping demand patterns. Utility rebate programs now link incentive levels to Seasonal Energy Efficiency Ratio (SEER2) thresholds, pushing high-efficiency equipment past mid-tier offerings. Supply-chain realignment toward low-global-warming-potential refrigerants is prompting manufacturers to certify multiple product platforms to hedge allocation risks. Parallel growth of smart-thermostat ecosystems is allowing vendors to capture recurring software revenue alongside hardware sales, intensifying competition for connected products within the air conditioning equipment market.
Key Report Takeaways
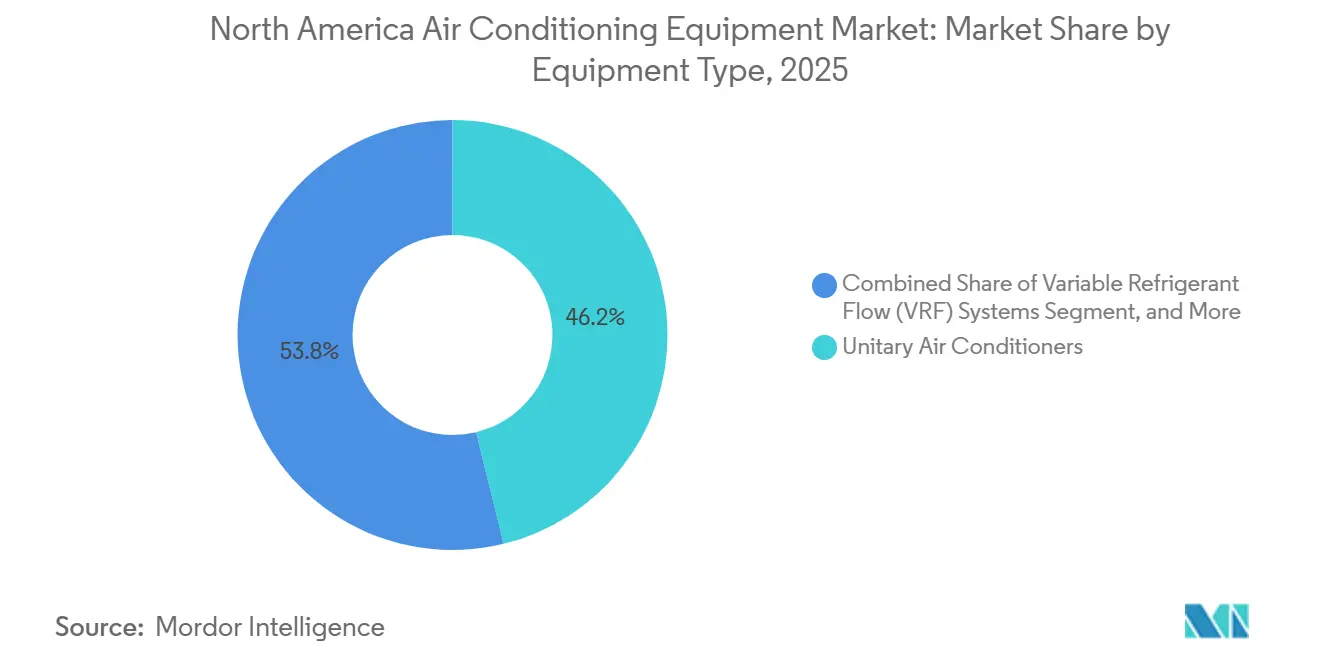
- By equipment type, unitary air conditioners retained 46.19% of air conditioning equipment market share in 2025, while variable refrigerant flow systems are advancing at a 6.78% CAGR through 2031.
- By refrigerant type, R-410A held 57.25% share of the air conditioning equipment market size in 2025, but R-32 is moving ahead at a 6.55% CAGR during 2026-2031.
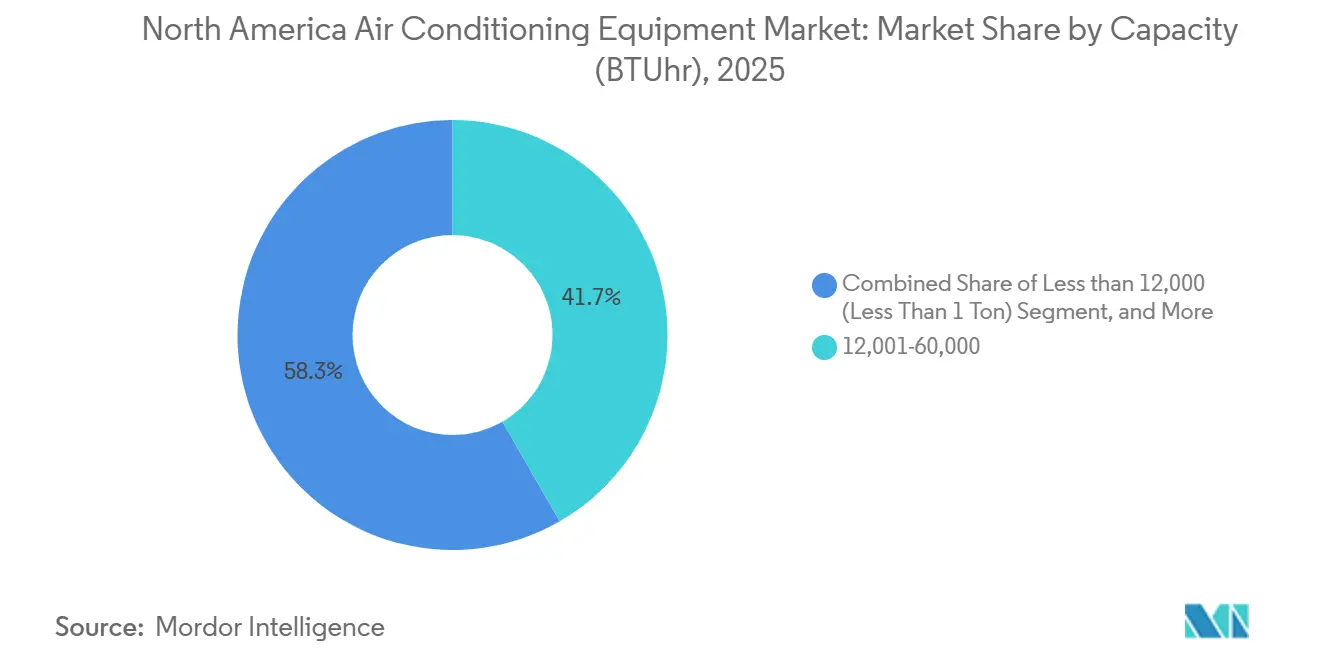
- By capacity, 12,001-60,000 BTU units commanded 41.68% of the air conditioning equipment market size in 2025, whereas systems below 12,000 BTU are growing at 6.72% CAGR.
- By efficiency, medium-efficiency models captured 48.38% share in 2025, yet high-efficiency equipment is expanding at 6.63% CAGR through 2031.
- By end user, residential applications represented 54.92% revenue in 2025, but commercial demand is rising faster at a 6.83% CAGR.
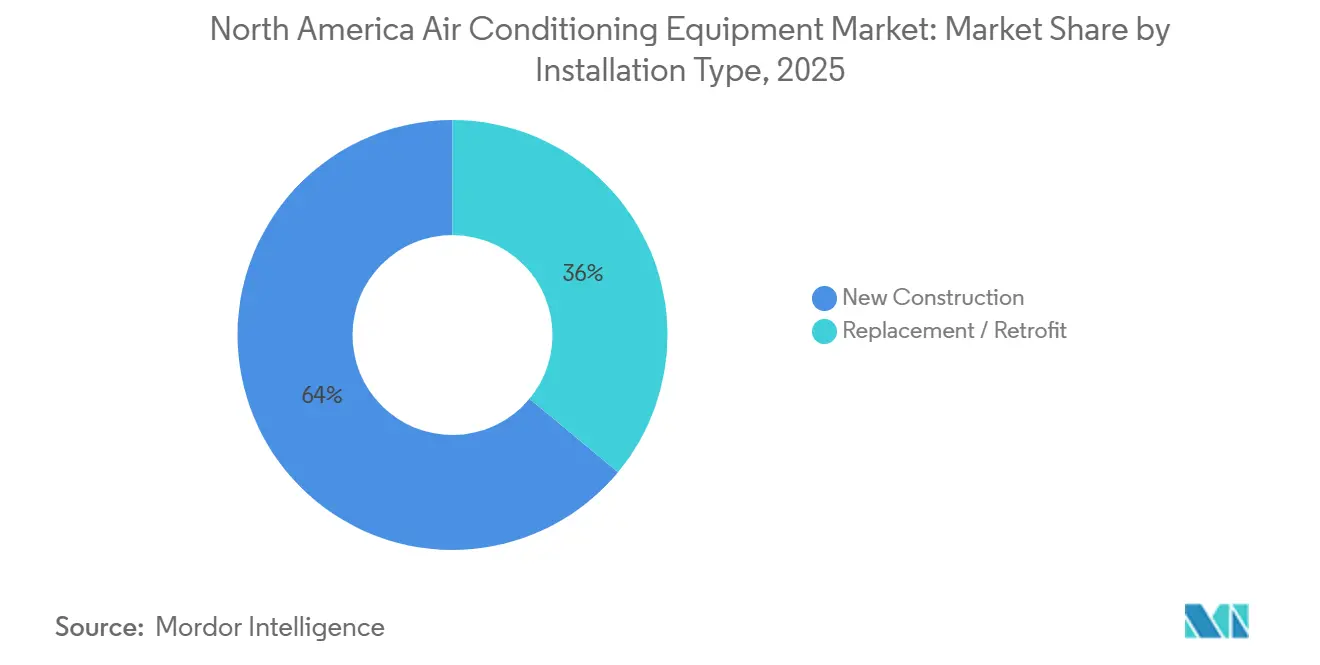
- By installation type, replacement and retrofit accounted for 63.98% volume in 2025, while new construction is set to climb at 6.91% CAGR.
- By sales channel, wholesalers and distributors held 52.73% share in 2025, whereas retail and e-commerce sales are scaling at 6.96% CAGR.
- By geography, the United States generated 80.78% revenue in 2025, with Mexico emerging as the fastest-growing country at 6.88% CAGR.
Note: Market size and forecast figures in this report are generated using Mordor Intelligence’s proprietary estimation framework, updated with the latest available data and insights as of January 2026.
North America Air Conditioning Equipment Market Trends and Insights
Drivers Impact Analysis*
| Driver | (~) % Impact on CAGR Forecast | Geographic Relevance | Impact Timeline |
|---|---|---|---|
| Tax-Credit Reinstatement and State-Level Rebate Programs | +1.30% | United States, with concentrated uptake in California, New York, Texas | Short term (≤ 2 years) |
| Replacement Demand for Aging Rooftop Units in Commercial Buildings | +1.10% | United States and Canada, urban cores with pre-2010 building stock | Medium term (2-4 years) |
| Rapid Growth of Smart-Thermostat and Home-Automation Ecosystems | +0.90% | United States, Canada, early adoption in metropolitan areas | Medium term (2-4 years) |
| Heat-Pump Incentives Shifting Mix Toward Reversible Systems (Cold-Climate) | +0.80% | Northern United States, Canada (Alberta, Ontario, Quebec) | Long term (≥ 4 years) |
| Data-Center Cooling Capacity Additions (Edge and Hyperscale) | +0.70% | United States (Virginia, Texas, Oregon), Canada (Quebec) | Long term (≥ 4 years) |
| Extreme-Heat Events Increasing Cooling-Degree Days | +0.60% | United States Southwest and Southeast, Mexico | Short term (≤ 2 years) |
| Source: Mordor Intelligence | |||
Tax-Credit Reinstatement and State-Level Rebate Programs
Expanded USD 2,000 federal credits under the Inflation Reduction Act halve payback periods for ENERGY STAR Most Efficient systems, making early replacement financially attractive.[1]Internal Revenue Service, “Energy Efficient Home Improvement Credit (Section 25C),” irs.gov California and New York add point-of-sale rebates that trim total installed cost by up to one-third.[2]California Energy Commission, “2025 Building Energy Efficiency Standards (Title 24, Part 6),” energy.ca.gov Combined incentives shorten the average residential replacement cycle from ten to seven years, elevating baseline demand within the air conditioning equipment market. Utilities now tie eligibility to demand-response enrolment, channelling thousands of connected units into automated peak-shaving programs that in turn validate performance data for manufacturers.[3]U.S. Department of Energy, “Energy Efficiency Standards for Residential Central Air Conditioners and Heat Pumps,” energy.gov
Replacement Demand for Aging Rooftop Units in Commercial Buildings
Rooftop units installed during the 2005-2010 building surge are failing at double-digit rates. Building owners weigh like-for-like swaps against upgrades featuring variable-speed compressors and economizer controls that trim energy use by up to 30%. Rising utility prices and corporate Scope 2 reduction targets are tipping decisions toward high-efficiency retrofits, boosting mid-tonnage shipments and service contract revenue. Secondary markets such as Phoenix, Atlanta, and Dallas account for a sizable share of this replacement wave, which sustains parts and maintenance demand in distributor networks.
Rapid Growth of Smart-Thermostat and Home-Automation Ecosystems
Smart thermostats are now installed in 38% of U.S. centrally cooled homes, up ten points in two years. Embedded Wi-Fi and Zigbee radios allow manufacturers to layer predictive maintenance alerts on top of comfort control, reducing truck-roll emergencies by nearly one-fifth. Monetization is shifting toward software subscriptions and utility incentive aggregation, giving firms a recurring-revenue hedge against hardware margin compression. Utilities leveraged automation to shed more than one gigawatt of load during 2025 heat events, proving grid value and spurring further utility partnerships.
Heat-Pump Incentives Shifting Mix Toward Reversible Systems
Cold-climate incentives in the United States and Canada closed the upfront price gap with gas furnaces, doubling heat-pump penetration to 12% in northern regions. Field studies confirmed that variable-speed inverter units maintain a coefficient of performance above 2.0 at −13 °F, meeting homeowner comfort and cost expectations. Contractor curricula now emphasize refrigerant charge precision and airflow balancing, and premium models command 30% price premiums, expanding profit pools despite higher component costs.
Restraints Impact Analysis*
| Restraint | (~) % Impact on CAGR Forecast | Geographic Relevance | Impact Timeline |
|---|---|---|---|
| SEER2 and AWEF Compliance Cost Pressures on OEM Margins | -0.80% | United States, Canada (federal efficiency mandates) | Short term (≤ 2 years) |
| Kigali Amendment Phasedown of HFC Refrigerants | -0.70% | United States, Canada, Mexico (Montreal Protocol signatories) | Medium term (2-4 years) |
| Electrical-Grid Congestion and Demand-Response Penalties | -0.50% | United States (California, Texas, New England ISO) | Medium term (2-4 years) |
| Skilled-Labor Shortages for HVAC Installation and Retro-Commissioning | -0.60% | United States, Canada (urban and rural markets) | Long term (≥ 4 years) |
| Source: Mordor Intelligence | |||
SEER2 and AWEF Compliance Cost Pressures on OEM Margins
Stricter SEER2 test procedures reduced published ratings by up to 8%, pushing manufacturers to redesign coils, blowers, and valves. Component upgrades added USD 150-300 to bill-of-materials costs, shaving 1.2 percentage points off gross margins in 2024-2025. Smaller regional brands lacking scale exited price-sensitive product lines, tightening the supply base but also concentrating negotiating power among the top manufacturers.
Kigali Amendment Phasedown of HFC Refrigerants
EPA allocation cuts drove R-410A spot prices 35% higher in early 2025, forcing accelerated transitions to R-32 and R-454B. Spring-summer shortages of R-454B delayed product launches, compelling interim R-32 use in platforms originally engineered for other blends. Contractors must now carry multiple refrigerants and reclaim equipment, lifting service costs and complicating inventory planning across the air conditioning equipment market.
*Our forecasts treat driver/restraint impacts as directional, not additive. The impact forecasts reflect baseline growth, mix effects, and variable interactions.
Segment Analysis
By Equipment Type: VRF Systems Challenge Unitary Dominance
Unitary systems delivered 46.19% air conditioning equipment market share in 2025, anchored by residential retrofits and builder familiarity. Variable refrigerant flow platforms, however, are pacing the field at 6.78% CAGR through 2031. First-cost premiums are narrowing as manufacturers localize production and as developers value zoned comfort that lowers peak load by up to one-third. Ductless mini-splits dominate accessory-dwelling-unit and urban retrofit projects where ductwork is impractical. Packaged rooftops remain the backbone of warehousing and big-box retail, but modular VRF designs are winning specifications in mixed-use developments seeking operational flexibility.
Project developers increasingly evaluate lifecycle operating expense instead of upfront cost alone. Consequently, VRF bids frequently overtake constant-volume alternatives when energy savings are annualized over ten years. Chillers and PTACs hold niche positions yet face gradual displacement outside their core applications. The broader competitive landscape is shifting toward integrated comfort-control ecosystems that combine air conditioning, heating, and ventilation under a unified service model, reinforcing premium positioning within the air conditioning equipment market.


By Refrigerant Type: Low-GWP Formulations Gain Traction
R-410A retained 57.25% of the installed base in 2025, but its share is eroding as phasedown quotas tighten. R-32, with a 68% lower global-warming potential, is expanding at 6.55% CAGR, propelled by single-component simplicity that eases service and reclamation. R-454B offers near drop-in compatibility for legacy R-410A designs, drawing interest from manufacturers seeking minimal tooling changes, yet supply bottlenecks hampered 2025 rollouts. Mildly flammable A2L classifications oblige contractors to invest in new leak-detection and brazing protocols, increasing training expenses while lifting service revenue for certified technicians.
The refrigerant transition splinters product roadmaps, encouraging some brands to dual-certify equipment. End users delay replacements until supply volatility subsides, lengthening decision cycles for large commercial projects. Meanwhile, reclaim and reuse markets are forming secondary profit streams, with refrigerant recovery firms marketing closed-loop service contracts that align with corporate sustainability goals. This transition period is likely to persist through 2029, keeping refrigerant availability a top-of-mind risk factor in procurement decisions across the air conditioning equipment market.
By Capacity: Sub-Ton Systems Capture Urban Infill
Units rated 12,001-60,000 BTU accounted for 41.68% of the air conditioning equipment market size in 2025, underpinning most single-family and small-commercial installations. Sub-12,000 BTU products, almost all ductless mini splits, are charting a 6.72% CAGR on the back of urban infill housing, accessory dwelling ordinances, and aging apartment retrofits. Compact compressors running on standard 120-volt circuits simplify homeowner installation approvals and reduce electrical upgrades.
California’s zoning reforms alone drove 18,000 accessory dwelling permits in 2025, typically specifying one or two mini-split heads per structure. Distributors respond by broadening SKU assortments, which raises inventory carrying costs but increases cross-sell opportunities for controls and mounting accessories. At the top end, systems above 60,000 BTU maintain relevance in logistics hubs and data centers, yet their longer sales cycles moderate overall volume growth even as per-unit revenue remains elevated.
By Efficiency: High-SEER2 Equipment Commands Premiums
Medium-efficiency equipment (16-19 SEER) held 48.38% share in 2025, but high-efficiency systems above 20 SEER2 are advancing at 6.63% CAGR through 2031. Variable-speed compressors and electronically commutated motors raise system cost by USD 800-1,200, yet pay back within six years in hot-humid climates where electricity prices are highest. Performance-based rebates are displacing flat incentives, encouraging installation of units featuring integrated metering and fault diagnostics.
Contractor capability becomes a bottleneck as high-end units demand precise duct sealing and refrigerant charging. Firms that invest in advanced commissioning tools command premium labour rates and gain sticky maintenance contracts, expanding aftermarket revenue. Budget-constrained buyers, however, remain loyal to mid-tier SKUs, suggesting a bifurcated demand curve that suppliers must address with tiered product families inside the air conditioning equipment market.
By End User: Commercial Segment Outpaces Residential
Residential applications generated 54.92% revenue in 2025, buoyed by retrofit demand. Yet commercial customers including life-science labs, logistics centers, and data centers are accelerating at 6.83% CAGR. Office-to-lab conversions require stringent humidity and temperature stability, nudging developers toward VRF and chilled-water systems. Data centers deploy 500-ton modular air-cooled chillers with redundant controls, lifting average selling prices and service-contract value.
Residential growth plateaus as household formation slows, while commercial square footage expands on e-commerce logistics and onshoring manufacturing. Equipment makers are prioritizing extended-warranty, remote-diagnostic, and modular-capacity features that align with 24-hour commercial operations, a pivot that alters supply-chain priorities for compressors and controls within the air conditioning equipment market.
By Installation Type: Retrofit Dominance Persists
Retrofit and replacement represented 63.98% volume in 2025, sustained by aging installed bases and emergency failure replacements that shorten sales cycles. New construction, though smaller, is on a 6.91% CAGR upswing, especially across the Sunbelt where population inflows keep multifamily permitting resilient despite high mortgage rates. Energy-service agreements that finance upgrades through guaranteed savings lower capital barriers, speeding decisions to replace marginally functional units ahead of catastrophic failure.
Regional variation remains pronounced. Sunbelt states tilt toward new builds, whereas northern metros lean heavily on retrofits. Commercial retrofits often bundle controls upgrades and air-quality sensors, raising project complexity and average revenue per job, thus maintaining healthy margins for contractors versed in integrated building systems.
By Sales Channel: E-Commerce Disrupts Traditional Distribution
Wholesalers and distributors still manage 52.73% of 2025 shipments, leveraging local inventory for same day fulfilments. Yet retail and e-commerce channels are clocking 6.96% CAGR, propelled by direct-to-consumer brands that pair subscription maintenance with equipment sales. Online platforms heighten price transparency, pressuring branded OEMs to differentiate through longer warranties and connected features.
Channel conflict is surfacing as manufacturers experiment with hybrid models, selling online while preserving distributor partnerships for installation and after-sales support. Distributors answer by expanding value-added services design assistance, commissioning support to defend relevance. The resulting realignment compresses gross margins on commodity window units but opens consulting revenue streams on complex VRF and mini-split projects.
Geography Analysis
The United States contributed 80.78% of North American revenue in 2025 and is projected to post a 5.8% CAGR to 2031. Sunbelt states such as Texas, Florida, and Arizona account for outsized shipments due to high cooling-degree days and net domestic migration surpassing 1.2 million in 2025. Northern states pivot toward cold-climate heat pumps, with Minnesota and Wisconsin recording 22% year-over-year installation gains in 2025. California’s 2025 update to Title 24 mandates heat-pump-ready electrical panels, future-proofing new homes and stimulating contractor demand for high-efficiency split systems. Utility rate disparities drive coastal states toward premium equipment while interior regions settle for mid-tier solutions, segmenting the air conditioning equipment market by both climate and wallet size.
Mexico is the regional growth leader at a 6.88% CAGR through 2031. Nearshoring investments relocated USD 40 billion of manufacturing capacity during 2024-2025, spurring HVAC demand concentrated in Monterrey, Tijuana, and Ciudad Juárez. Updated NOM-021-ENER standards lifted minimum SEER thresholds, pushing low-efficiency imports out of the market and consolidating share among multinational brands with engineering scale. Rising middle-class income in northern states amplifies residential penetration, while scorching summers sustain steady replacement cycles for room air conditioners and emerging mini-split alternatives.
Canada’s market is smaller but structurally evolving as federal and provincial programs accelerate heat-pump adoption. Combined rebates of up to CAD 8,000 (USD 5,900) drove 45,000 installations in 2025, double the 2023 figure. Quebec’s inexpensive hydroelectricity makes heat pumps cost-competitive with gas, catalysing contractor training in sub-zero commissioning. Urban centers in Ontario and British Columbia face end-of-life cycles for units installed during the 2005-2010 boom, generating predictable replacement flows. Remote northern communities depend on specialized cold-climate models, sustaining a niche yet profitable segment for manufacturers that can certify products to extreme performance standards.
Competitive Landscape
The air conditioning equipment market shows moderate concentration: the top five manufacturers Carrier Global, Trane Technologies, Daikin Industries, Johnson Controls, and Lennox International together command roughly 55-60% of regional revenue. Consolidation quickened in 2024-2025 as majors sought portfolio breadth. Carrier’s USD 5.8 billion purchase of Viessmann Climate Solutions embeds European heat-pump expertise, while Trane’s USD 4.1 billion acquisition of Modine Climate Solutions extends data-center credentials. These integrations aim to bundle heating, cooling, and controls under unified service contracts, boosting recurring maintenance and software income.
Technology differentiation is intensifying. Daikin filed a 2025 patent covering machine-learning algorithms that adjust refrigerant flow based on occupancy patterns, signalling a shift toward software-centric value. Smaller disruptors chase white space in cold-climate heat pumps and e-commerce direct sales, often leveraging factory-charged line sets that bypass licensed refrigerant handling. Regulatory pressures on SEER2 and refrigerant transitions compel OEMs to rationalize platforms, a challenge more manageable for global players with diversified tooling budgets than for regional assemblers.
Channel strategy is another battleground. E-commerce entrants compress distributor margins on commodity products, yet complex VRF and chilled-water systems still lean on traditional contractor relationships. OEMs are piloting hybrid models that capture direct online margin while outsourcing install labour to certified dealers. Success will hinge on balancing channel conflict against customer demand for convenience, a calculus that continues to evolve alongside buyer expectations in the air conditioning equipment market.
North America Air Conditioning Equipment Industry Leaders
Daikin Industries Ltd
Carrier Corporation
Rheem Manufacturing Company
Trane Inc. (Trane Technologies PLC)
Johnson Controls International PLC
- *Disclaimer: Major Players sorted in no particular order

Recent Industry Developments
- January 2026: Carrier Global announced a USD 1.2 billion program to build a heat-pump assembly plant in South Carolina and upgrade Tennessee and Indiana factories, with operations slated for Q2 2027.
- January 2026: Fujitsu General rolled out a USD 199-per-year subscription maintenance plan covering annual tune-ups and remote diagnostics for residential ductless owners.
- February 2026: Samsung Electronics received ENERGY STAR Most Efficient certification for 24 SEER2 ductless mini-splits featuring variable-speed compressors.
- December 2025: Trane Technologies finalized Modine Climate Solutions integration, targeting USD 150 million in annual synergies by 2027.


North America Air Conditioning Equipment Market Report Scope
The North America Air Conditioning Equipment Market Report is Segmented by Equipment Type (Unitary Air Conditioners, Room Air Conditioners, Packaged Terminal Air Conditioners, Chillers, Variable Refrigerant Flow Systems), Refrigerant Type (R-410A, R-32, R-454B and R-466A), Capacity (Less Than 12,000 BTU per hr, 12,001-60,000 BTU per hr, Greater Than 60,000 BTU per hr), Efficiency (Low, Medium, High), End User (Residential, Commercial, Industrial), Installation Type (New Construction, Replacement and Retrofit), Sales Channel (Direct, Retail and E-Commerce, Wholesalers and Distributors), and Geography (United States, Canada, Mexico). The Market Forecasts are Provided in Terms of Value (USD).
By Equipment Type
| Unitary Air Conditioners | Ducted Split Systems |
| Ductless Mini-Splits | |
| Indoor Packaged and Rooftops | |
| Room Air Conditioners | |
| Packaged Terminal Air Conditioners | |
| Chillers | |
| Variable Refrigerant Flow (VRF) Systems |
By Refrigerant Type
| R-410A |
| R-32 |
| R-454B and R-466A (Next-Gen Low-GWP) |
By Capacity (BTU/hr)
| Less than 12,000 (Less Than 1 Ton) |
| 12,001-60,000 (1-5 Tons) |
| More than 60,000 (More than 5 Tons) |
By Efficiency (SEER Rating)
| Low Efficiency (13-15 SEER) |
| Medium Efficiency (16-19 SEER) |
| High Efficiency (More than 20 SEER/SEER2 Equivalent) |
By End User
| Residential |
| Commercial |
| Industrial |
By Installation Type
| New Construction |
| Replacement / Retrofit |
By Sales Channel
| Direct (OEM-to-Contractor) |
| Retail / E-Commerce |
| Wholesalers / Distributors |
By Country
| United States |
| Canada |
| Mexico |
| By Equipment Type | Unitary Air Conditioners | Ducted Split Systems |
| Ductless Mini-Splits | ||
| Indoor Packaged and Rooftops | ||
| Room Air Conditioners | ||
| Packaged Terminal Air Conditioners | ||
| Chillers | ||
| Variable Refrigerant Flow (VRF) Systems | ||
| By Refrigerant Type | R-410A | |
| R-32 | ||
| R-454B and R-466A (Next-Gen Low-GWP) | ||
| By Capacity (BTU/hr) | Less than 12,000 (Less Than 1 Ton) | |
| 12,001-60,000 (1-5 Tons) | ||
| More than 60,000 (More than 5 Tons) | ||
| By Efficiency (SEER Rating) | Low Efficiency (13-15 SEER) | |
| Medium Efficiency (16-19 SEER) | ||
| High Efficiency (More than 20 SEER/SEER2 Equivalent) | ||
| By End User | Residential | |
| Commercial | ||
| Industrial | ||
| By Installation Type | New Construction | |
| Replacement / Retrofit | ||
| By Sales Channel | Direct (OEM-to-Contractor) | |
| Retail / E-Commerce | ||
| Wholesalers / Distributors | ||
| By Country | United States | |
| Canada | ||
| Mexico |


Key Questions Answered in the Report
What is the projected value of the North American air conditioning equipment market in 2031?
It is forecast to reach USD 38.59 billion by 2031, growing at 5.9% CAGR from 2026-2031.
Which equipment type is growing fastest through 2031?
Variable refrigerant flow systems are expanding at a 6.78% CAGR, the highest among equipment categories.
How large is the U.S. share of regional revenue?
The United States generated 80.78% of North American revenue in 2025 and is forecast to remain dominant through 2031.
Why are refrigerant transitions critical for buyers?
Kigali phasedown quotas are tightening R-410A supply, forcing shifts to R-32 and R-454B and affecting service practices and availability.
Which sales channel shows the strongest growth?
Retail and e-commerce platforms are advancing at 6.96% CAGR as direct-to-consumer brands gain traction.
How will high-efficiency standards affect pricing?
Component upgrades needed for SEER2 compliance added USD 150-300 per unit, leading to selective price increases and accelerated retirement of low-efficiency models.
Page last updated on:


