Commercial HVAC Market Size and Share
Market Overview
| Study Period | 2020 - 2031 |
|---|---|
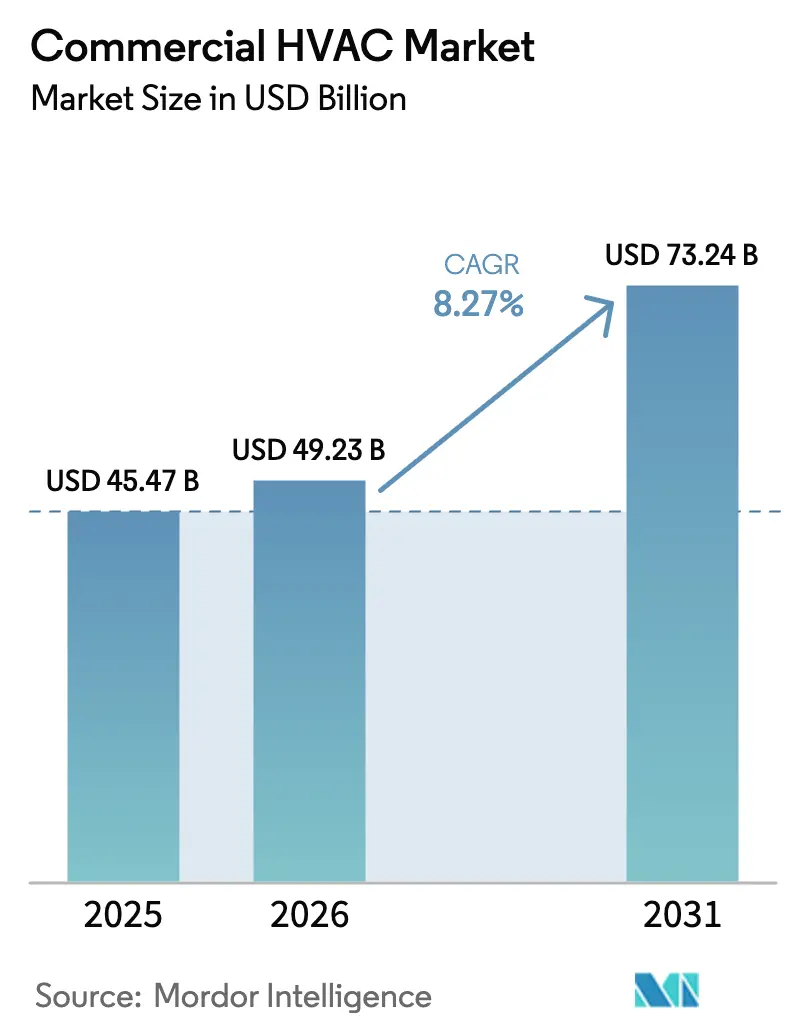
| Market Size (2026) | USD 49.23 Billion |
| Market Size (2031) | USD 73.24 Billion |
| Growth Rate (2026 - 2031) | 8.27% CAGR |
| Fastest Growing Market | North America |
| Largest Market | Asia Pacific |
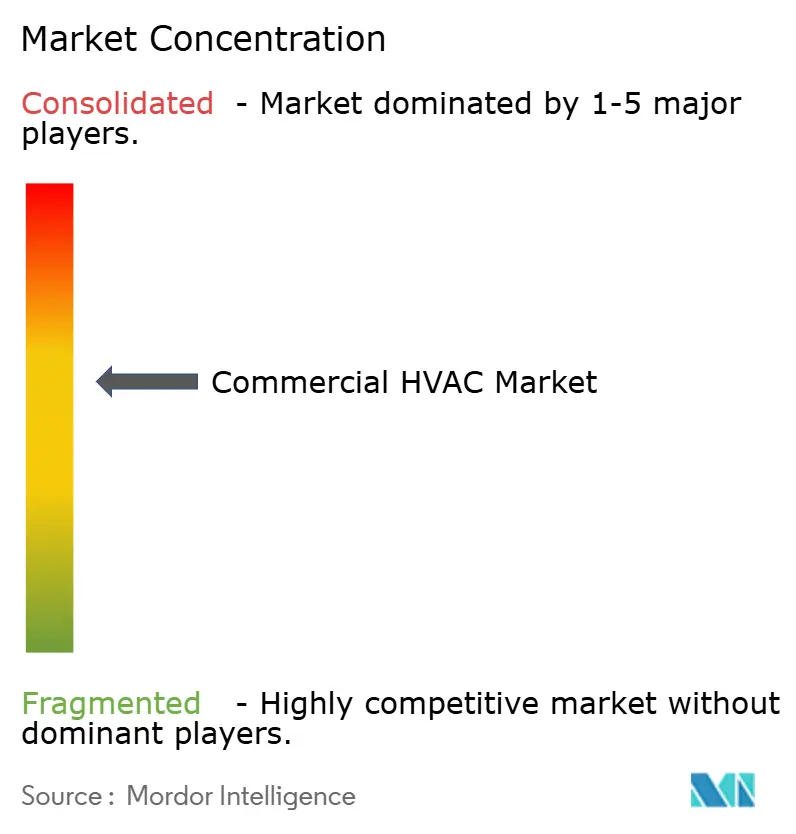
| Market Concentration | Medium |
Major Players
*Disclaimer: Major Players sorted in no particular order Image © Mordor Intelligence. Reuse requires attribution under CC BY 4.0. |
|
Commercial HVAC Market Analysis by Mordor Intelligence
The commercial HVAC market size is projected to expand from USD 45.47 billion in 2025 and USD 49.23 billion in 2026 to USD 73.24 billion by 2031, registering a CAGR of 8.27% between 2026 and 2031. Cooling demand from AI data centers, accelerated refrigerant phase-downs, and post-pandemic ventilation mandates are reshaping specification criteria and procurement cycles. Original equipment manufacturers are redesigning compressors around low-GWP refrigerants to win green-building certifications, while facility owners are shifting budgets toward outcome-based service contracts that guarantee energy savings. Labor shortages in North American installation trades, coupled with persistent semiconductor volatility, are slowing project completion schedules but also reinforcing demand for predictive-maintenance platforms that stretch equipment lifetimes. Capital inflows continue to favor suppliers that bundle HVAC upgrades with on-site solar and storage, turning buildings into flexible grid assets.
Key Report Takeaways
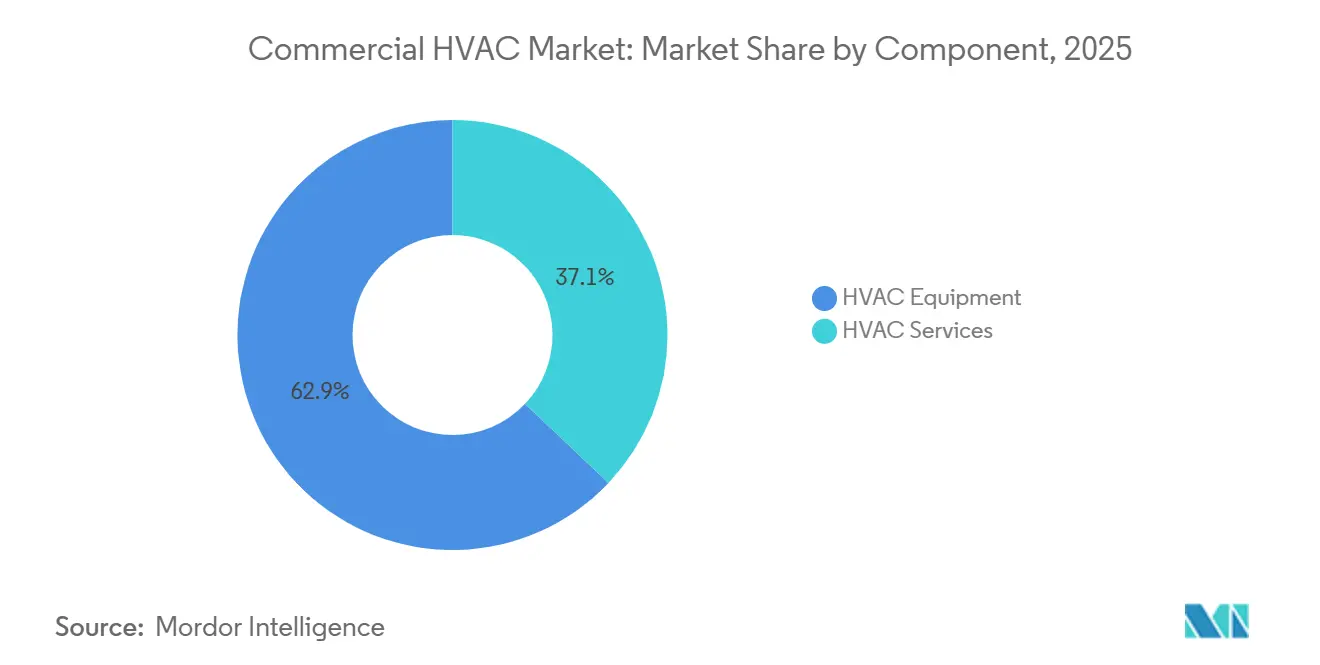
- By component, HVAC equipment led with 62.91% revenue share in 2025, while services are forecast to advance at an 8.54% CAGR to 2031.
- By equipment type, cooling and air-conditioning held 47.33% of the commercial HVAC market share in 2025, and controls and sensors are projected to expand at an 8.89% CAGR through 2031.
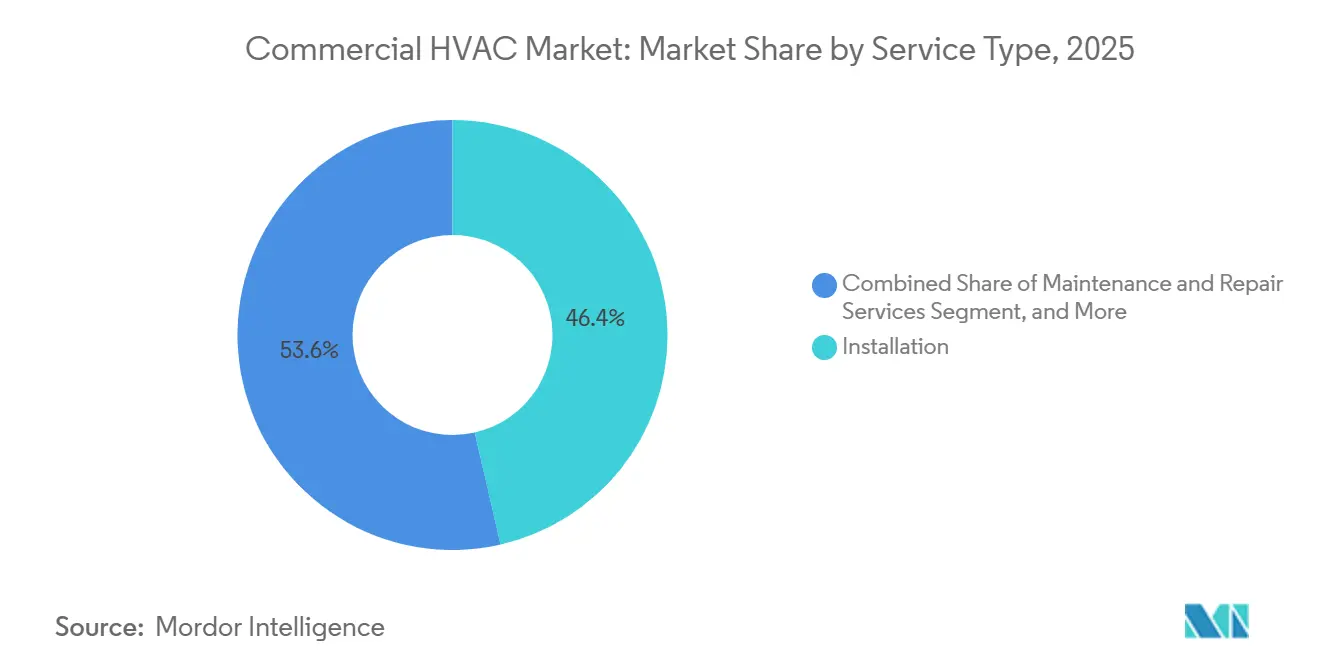
- By service type, installation accounted for 46.42% of the commercial HVAC market in 2025, whereas performance contracting and HVAC-as-a-Service show the highest growth rate at an 8.93% CAGR to 2031.
- By end-user industry, commercial office buildings accounted for 32.89% of demand in 2025; data centers are the fastest-growing segment, rising at a 9.78% CAGR over 2026-2031.
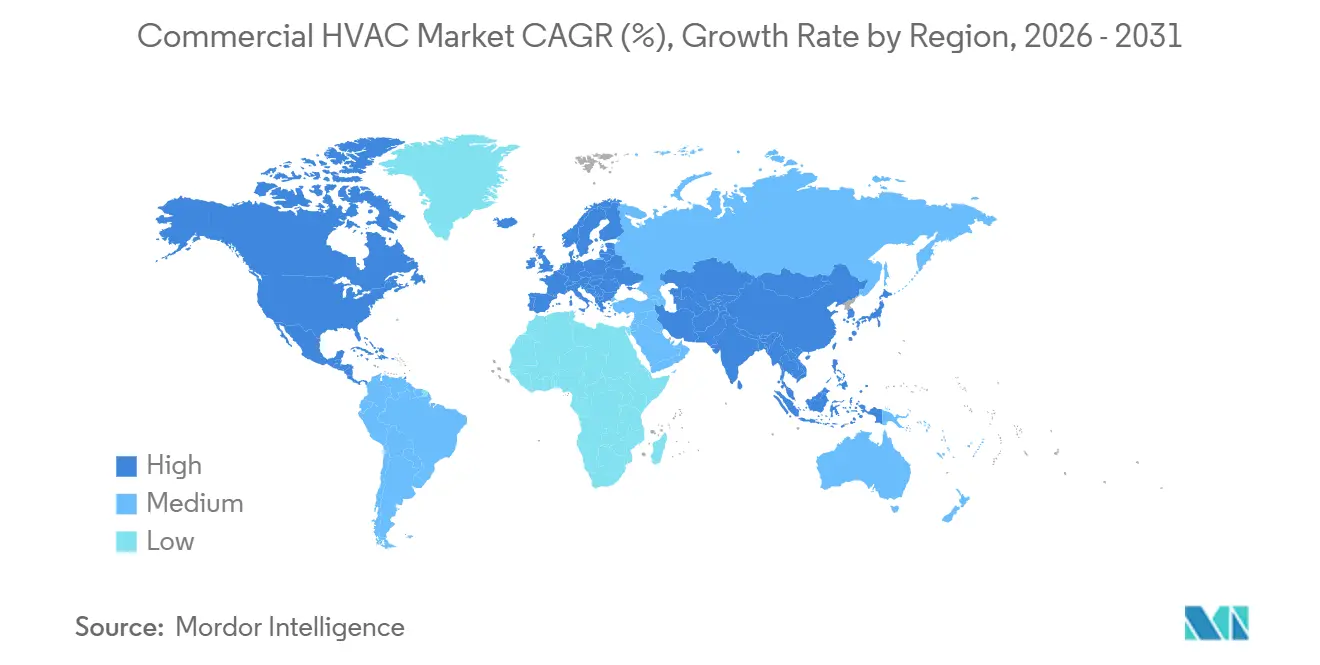
- By geography, North America contributed 35.78% of revenue in 2025, and Asia-Pacific is expected to record the quickest regional upswing at a 9.43% CAGR during the forecast horizon.
Note: Market size and forecast figures in this report are generated using Mordor Intelligence’s proprietary estimation framework, updated with the latest available data and insights as of January 2026.
Global Commercial HVAC Market Trends and Insights
Drivers Impact Analysis*
| Driver | (~) % Impact on CAGR Forecast | Geographic Relevance | Impact Timeline |
|---|---|---|---|
| Surging Cooling Load From AI-Driven Data Centers | +2.1% | North America, Europe, Asia-Pacific hyperscale hubs | Medium term (2–4 years) |
| Stricter Energy-Efficiency and Refrigerant Regulations | +1.8% | Global, led by EU, United States, Japan | Long term (≥4 years) |
| Increasing Demand for Energy-Efficient HVAC Systems | +1.5% | North America and Europe | Medium term (2–4 years) |
| Rise of HVAC-as-a-Service and Outcome-Based Contracts | +1.2% | North America, Europe, emerging Asia-Pacific | Medium term (2–4 years) |
| Growing Commercial Construction in Emerging Economies | +1.0% | Asia-Pacific core, spillover to Middle East and Africa | Long term (≥4 years) |
| Heightened Indoor Air Quality Awareness Post-COVID | +0.7% | Global, healthcare and education | Short term (≤2 years) |
| Source: Mordor Intelligence | |||
Surging Cooling Load From AI-Driven Data Centers
Generative-AI clusters are lifting rack densities from 8 kW to 40 kW, a fivefold jump that air cooling alone cannot manage. Hyperscalers are adopting rear-door heat exchangers and direct-to-chip liquid manifolds that strip 80% of heat before it hits the data hall air stream. The shift forces chilled-water plants to run at 35% higher capacity, stimulating orders for high-efficiency chillers and variable-speed pumps. Modular chiller arrays sized at 500 kW increments help operators align capital spends with phased server rollouts. Predictive algorithms now adjust chilled-water set points in real time against server utilization, trimming parasitic loads by up to 20% and extending compressor run hours between overhauls.[1]Honeywell International Inc. "Investor Presentation Q4 2025." February 2026. www.honeywell.com/us/en/investors These dynamics keep the commercial HVAC market on a steeper growth path, especially around hyperscale campuses.
Stricter Energy-Efficiency and Refrigerant Regulations
The AIM Act in the United States targets an 85% hydrofluorocarbon phase-down by 2036, while the European Union bans refrigerants above 150 GWP in new installations after January 2025. Manufacturers are pivoting to R-32, R-454B, propane blends, and next-generation heat-pump designs. Leak-detection mandates in Japan now add recurring compliance spend yet simultaneously boost demand for wireless sensors and analytics software. ASHRAE 90.1-2022 lifts chiller efficiency minimums by 10%, nudging facility owners to upgrade units installed before 2015 to retain Energy Star labels. Shorter product cycles and accelerated retrofit timetables are widening the addressable base for premium-priced, low-GWP equipment.
Increasing Demand for Energy-Efficient HVAC Systems
Net-zero commitments across real-estate portfolios call for HVAC energy intensity below 15 kWh per m² each year, half today’s Class A baseline. Variable-refrigerant-flow systems with heat recovery capture waste heat and slash boiler run time during shoulder seasons. Participants in the U.S. Department of Energy Better Buildings Initiative reported 2.8% yearly energy cuts, equal to USD 1.20 per square foot in utility savings. Integrated platforms coordinating HVAC, lighting, and plug loads routinely deliver 18-22% whole-building energy savings, opening eligibility for LEED Platinum and rental premiums of USD 3-5 per square foot. Heat-pump retrofits, buoyed by federal tax credits that cover 30% of installed cost plus state add-ons, often reach cash-flow parity with gas boilers even in low-gas-price states.
Rise of HVAC-as-a-Service and Outcome-Based Contracts
Performance contracting shifts risk from property owners to service providers. Johnson Controls logged 12% revenue growth from these contracts in 2025, especially among universities and municipalities. Agreements usually span 10-15 years and finance capital upgrades through guaranteed energy savings. Contractors now peg pricing to indoor air-quality thresholds, particulate matter under 10 µg per m³ and CO₂ below 800 ppm, linking HVAC spend to tenant satisfaction and lease renewal. As OEMs acquire regional service networks, recurring revenue cushions cyclicality in new construction and raises enterprise valuations.
Restraints Impact Analysis*
| Restraint | (~) % Impact on CAGR Forecast | Geographic Relevance | Impact Timeline |
|---|---|---|---|
| PFAS Phase-Out Adding Redesign and Compliance Costs | -1.3% | North America and Europe | Medium term (2–4 years) |
| Semiconductor and Controller Supply-Chain Volatility | -1.1% | Global | Short term (≤2 years) |
| High Initial Capital Cost of Advanced Systems | -0.8% | Emerging Asia-Pacific, Middle East, Africa | Medium term (2–4 years) |
| Shortage of Skilled HVAC Technicians | -0.6% | North America and Europe | Long term (≥4 years) |
| Source: Mordor Intelligence | |||
PFAS Phase-Out Adding Redesign and Compliance Costs
Regulators plan to restrict PFAS use by 2028, impacting lubricants, gaskets, and even some low-GWP refrigerants.[2]U.S. Environmental Protection Agency, “American Innovation and Manufacturing (AIM) Act,” epa.gov Re-qualification under UL 1995 and IEC 60335 stretches 18-24 months and ranges from USD 500,000 to USD 2 million per product platform. Smaller firms face capital strain and may exit lines or merge with larger rivals. New materials in the commercial HVAC market may face tempered growth due to potential delays in launches and tightened supply, stemming from the need for dual compliance in refrigerant chemistry and safety approvals.
Semiconductor and Controller Supply-Chain Volatility
In the midst of a global chip shortage, suppliers of variable-frequency drives and digital controllers are grappling with lead times stretching between 8 to 26 weeks. This delay is particularly challenging for HVAC suppliers, who frequently find themselves at the back of the line when it comes to fab allocations, often trailing behind the likes of automotive giants and smartphone manufacturers. In a bid to navigate these constraints, HVAC suppliers are resorting to redesigning their boards, a move that allows them to accommodate a diverse range of chip families. However, this adaptability comes at a cost, with suppliers facing a premium of 15-20%. These shipment delays not only extend project completion timelines but also disrupt revenue recognition schedules, casting a shadow on the immediate growth trajectory of the commercial HVAC market.
*Our forecasts treat driver/restraint impacts as directional, not additive. The impact forecasts reflect baseline growth, mix effects, and variable interactions.
Segment Analysis
By Component: Services Gaining Share Through Performance Models
HVAC equipment produced 62.91% of 2025 revenue as chillers, rooftop units, and air handlers dominate capital budgets. Services, however, are forecast to climb at an 8.54% CAGR to 2031, steadily eating into equipment share. Building owners prefer converting capital expense to operating expense through managed-service contracts that include uptime guarantees and data-driven maintenance. The commercial HVAC market size tied to services will keep expanding as private equity rolls up regional contractors, integrates remote-monitoring centers, and unlocks scale advantages that local firms cannot match. OEM service arms benefit from proprietary parts supply and fleet-wide data that sharpen predictive algorithms, cementing stickier client relationships.
A growing pool of outcome-based agreements anchors cash flows over 10-15 years, incentivizing contractors to install high-efficiency equipment that minimizes lifetime energy costs. Tax-advantaged energy-savings performance contracts also allow public entities to skirt debt ceilings, further widening the services opportunity. Meanwhile, equipment sales remain essential to greenfield projects and major retrofits, ensuring a balanced revenue mix for diversified suppliers.


By Equipment Type: Controls Accelerate as Buildings Digitize
Cooling and air-conditioning equipment carried 47.33% of equipment revenue in 2025. Liquefied rack cooling for data centers and aggressive cooling loads in tropical regions sustain chiller and packaged-unit demand. Controls and sensors, however, are set to grow at an 8.89% CAGR, the fastest lane within the equipment stack. Real-estate investment trusts layering machine learning atop smart meters unlock 15-25% energy savings, making digital controls a default feature in new specifications. At the segment level, the commercial HVAC market share commanded by controls rises each year as retrofit projects integrate wireless sensors to avoid costly cabling in occupied spaces.
Heating equipment is pivoting to variable-speed heat pumps, which benefit from widespread electrification incentives in Europe and coastal United States. Ventilation units continue steady growth as ASHRAE 62.1-2022 mandates 20% higher fresh-air rates, propelling sales of energy-recovery wheels and high-efficiency filters. Smart thermostats and zoning dampers now ship standard in most packaged systems, adding incremental electronics content and enlarging the total addressable controls market.
By Service Type: Performance Contracting Reshapes Revenue Models
Installation accounted for 46.42% of service revenue in 2025 thanks to robust construction backlogs. Performance contracting and HVAC-as-a-Service, however, are projected to post an 8.93% CAGR through 2031, eclipsing traditional installation gains. Under 179D deductions in the United States, owners monetize up to USD 5.00 per square foot in accelerated depreciation, which dovetails with long-term service agreements to create rapid payback structures. The commercial HVAC market size attached to performance contracting thus scales quickly as contractors guarantee kilowatt-hour reductions and indoor-air-quality targets.
Maintenance and repair remain a steady annuity but face margin pressure from online parts marketplaces. Retrofit and upgrade work is buoyed by decarbonization mandates that compel envelope improvements and control overlays until full equipment replacement is viable. Carrier Global noted that services topped 50% of its 2025 sales, a bellwether for wider industry realignment toward fee-for-service economics.

By End-User Industry: Data Centers Drive Fastest Growth
Commercial offices still supplied 32.89% of demand in 2025, yet hybrid workstyles moderate new-build pipelines. Data centers, in contrast, are forecast to surge at a 9.78% CAGR as AI training clusters push liquid-cooling adoption. The commercial HVAC market size tied to data centers thus multiplies faster than any other vertical. Hospitality venues prioritize variable-refrigerant-flow systems that harvest waste heat, while healthcare facilities comply with ASHRAE 170 ventilation table values, both segments underpin stable replacement activity.
Recognizing the profound impact of air quality on cognitive performance, educational institutions are increasingly channeling investments into advanced air-quality upgrades. Meanwhile, in the retail sector, operators are adopting sophisticated demand-controlled ventilation systems. These systems intelligently adjust outdoor air intake based on real-time traffic patterns, ensuring optimal air quality for shoppers. In a bid to achieve net-zero energy consumption, public buildings are leveraging energy-savings performance contracts. This innovative approach allows them to fund extensive retrofits without drawing from tax revenues. Such strategic moves not only underscore the importance of air quality and energy efficiency but also significantly expand the commercial HVAC market's reach within civil infrastructure.
make this sentence more elaborative
Geography Analysis
North America commanded 35.78% of the commercial HVAC market size in 2025, supported by Internal Revenue Service Section 179D deductions that let owners expense up to USD 5.00 per square foot of qualifying upgrades. Data-center activity in Virginia, Texas and Quebec is spurring demand for liquid-cooling chillers, while state heat-pump incentives covering 30-50% of installed cost accelerate electrification. Canada’s carbon-pricing framework further rewards high-efficiency rooftop units, driving retrofit cycles in office towers that were last overhauled a decade ago.
Asia-Pacific is expanding at a 9.43% CAGR through 2031, the fastest regional pace, as India, Indonesia and Vietnam add roughly 1.2 billion m² of new commercial floor space each year in climates where cooling loads exceed 200 W per m². China’s public-private district-cooling build-outs in Guangdong and Hainan trim individual building footprints by 60%, while Australia’s rooftop-solar pairing with heat pumps slices HVAC electricity costs 20-25% during peak hours.[3]European Union, “Directive (EU) 2024/1275 on the Energy Performance of Buildings (Recast),” energy.ec.europa.eu Japan’s F-Gas Law now obliges annual leak checks on systems over 5 kg refrigerant charge, pushing wireless sensor rollouts across shopping malls and hotels.
Europe held 26% of the commercial HVAC market share in 2025 and is accelerating heat-pump retrofits to satisfy the Energy Performance of Buildings Directive, which forces non-residential assets to reach EPC class C by 2030. Typical projects allocate EUR 100-200 (USD 110-220) per m² for envelope upgrades and variable-speed chillers, often financed through green bonds issued by real-estate investment trusts. The Middle East relies on district-cooling networks in Dubai and Abu Dhabi that flatten summer peak load by 25%, while Africa and South America favor split systems where upfront budgets are tight. Oceania rounds out global demand as New Zealand’s building code now caps operational carbon, triggering heat-pump adoption in mixed-use developments.
Mordor Intelligence provides coverage of the commercial hvac market across other key regional markets, including Europe, North America, Middle East and Africa, and Asia, each with their regulatory frameworks and demand patterns. Detailed country-level analysis extends to United Kingdom, Canada, Japan, Italy, France, and China incorporating local coverage and market participation, as required.

Competitive Landscape
The top five suppliers, Carrier Global, Daikin Industries, Johnson Controls, Trane Technologies, and Midea Group, collectively held about 40% of 2025 revenue, leaving a long tail of regional OEMs and controls specialists. Vertical integration is intensifying; Trane’s 2024 purchase of a multi-state U.S. service contractor for roughly USD 300 million strengthened its recurring-revenue base. Carrier’s 2026 decision to invest USD 450 million in its Monterrey chiller plant boosts low-GWP capacity by 35% and shortens lead times for North and South American projects.
Patent activity signals rising technology stakes. Variable-speed compressors and leak-detection filings grew 18% year-over-year in 2025 across the United States Patent and Trademark Office and the European Patent Office, reflecting the scramble to commercialize PFAS-free lubricants and ultra-low-GWP refrigerants. Smaller entrants differentiate through open-protocol building-management systems that reduce vendor lock-in costs for mixed-use developers, while incumbents retain an edge through dense service fleets and multi-year maintenance contracts that anchor client loyalty. Honeywell and Bosch embed predictive algorithms that analyze vibration and pressure data, flagging compressor failures 30-60 days ahead and slashing unplanned downtime 40%.
Regional strategies vary. Daikin’s EUR 280 million acquisition of a European heat-pump specialist adds inverter compressor IP tailored to colder climates, while Midea’s Southeast Asian joint venture targets 500,000 m² of district-cooling deployments by 2028. Lennox’s USD 75 million Texas R and D hub focuses on natural-refrigerant platforms to pre-empt PFAS bans, and LG’s UL-certified propane VRF systems open niche opportunities where GWP caps are already strict. Overall, the industry shows moderate concentration and high technical hurdles, positioning diversified multinationals to consolidate share as low-carbon rules tighten.
Commercial HVAC Industry Leaders
-
Daikin Industries, Ltd.
-
Johnson Controls International PLC
-
Lennox International Inc.
-
Carrier Global Corporation
-
Trane Technologies PLC
- *Disclaimer: Major Players sorted in no particular order

Recent Industry Developments
- February 2026: Honeywell introduced a multi-protocol controller family with dual-source microchips to mitigate ongoing semiconductor volatility.
- January 2026: Carrier earmarked USD 450 million to expand its Monterrey, Mexico chiller plant, adding 200,000 m² of capacity for low-GWP refrigerant lines.
- December 2025: Daikin closed a EUR 280 million (USD 308 million) purchase of a European heat-pump manufacturer, securing inverter compressor IP.
- November 2025: Johnson Controls signed a 15-year, USD 120 million energy-savings contract with a U.S. university system, guaranteeing 25% HVAC energy cuts.


Global Commercial HVAC Market Report Scope
The Commercial HVAC Market Report is Segmented by Component (HVAC Equipment, HVAC Services), Equipment Type (Heating Equipment, Cooling/Air-Conditioning Equipment, Ventilation Equipment, Controls and Sensors), Service Type (Installation, Maintenance and Repair, Retrofit and Upgrade, Performance Contracting/HVAC-as-a-Service), End-User Industry (Commercial Office Buildings, Hospitality, Healthcare, Data Centers, Educational Institutions, Retail, Public Buildings, Other), and Geography (North America, South America, Europe, Asia-Pacific, Middle East, Africa). Market Forecasts are Provided in Terms of Value (USD).
| HVAC Equipment |
| HVAC Services |
| Heating Equipment |
| Cooling / Air-Conditioning Equipment |
| Ventilation Equipment |
| Controls and Sensors |
| Installation Services |
| Maintenance and Repair Services |
| Retrofit and Upgrade Services |
| Performance Contracting / HVAC-as-a-Service |
| Commercial Office Buildings |
| Hospitality |
| Healthcare Facilities |
| Data Centers |
| Educational Institutions |
| Retail and Shopping Malls |
| Public Buildings |
| Other End-User Industries |
| North America |
| South America |
| Europe |
| Asia-Pacific |
| Middle East |
| Africa |
| By Component | HVAC Equipment |
| HVAC Services | |
| By Equipment Type | Heating Equipment |
| Cooling / Air-Conditioning Equipment | |
| Ventilation Equipment | |
| Controls and Sensors | |
| By Service Type | Installation Services |
| Maintenance and Repair Services | |
| Retrofit and Upgrade Services | |
| Performance Contracting / HVAC-as-a-Service | |
| By End-User Industry | Commercial Office Buildings |
| Hospitality | |
| Healthcare Facilities | |
| Data Centers | |
| Educational Institutions | |
| Retail and Shopping Malls | |
| Public Buildings | |
| Other End-User Industries | |
| By Geography | North America |
| South America | |
| Europe | |
| Asia-Pacific | |
| Middle East | |
| Africa |


Key Questions Answered in the Report
What is the projected value of the commercial HVAC market by 2031?
It is forecast to reach USD 73.24 billion by 2031.
Which region is expected to record the fastest growth rate?
Asia-Pacific is projected to expand at a 9.43% CAGR over 2026-2031.
Why are controls and sensors the fastest-growing equipment segment?
Building owners adopt machine-learning optimization and wireless sensors that trim energy use 15-25%, driving an 8.89% CAGR for controls.
How is HVAC-as-a-Service changing procurement models?
Long-term contracts link fees to guaranteed energy savings and indoor-air-quality metrics, shifting spend from capex to opex.
What regulatory trends most influence future equipment designs?
Low-GWP refrigerant mandates under the AIM Act and EU F-Gas Regulation require redesigned compressors and leak-detection systems.
How will AI data centers influence HVAC demand?
Rack power densities up to 40 kW necessitate liquid-cooling loops and high-capacity chillers, boosting segment growth at a 9.78% CAGR.
Page last updated on:


