Cheese Market Size and Share
Market Overview
| Study Period | 2021 - 2031 |
|---|---|
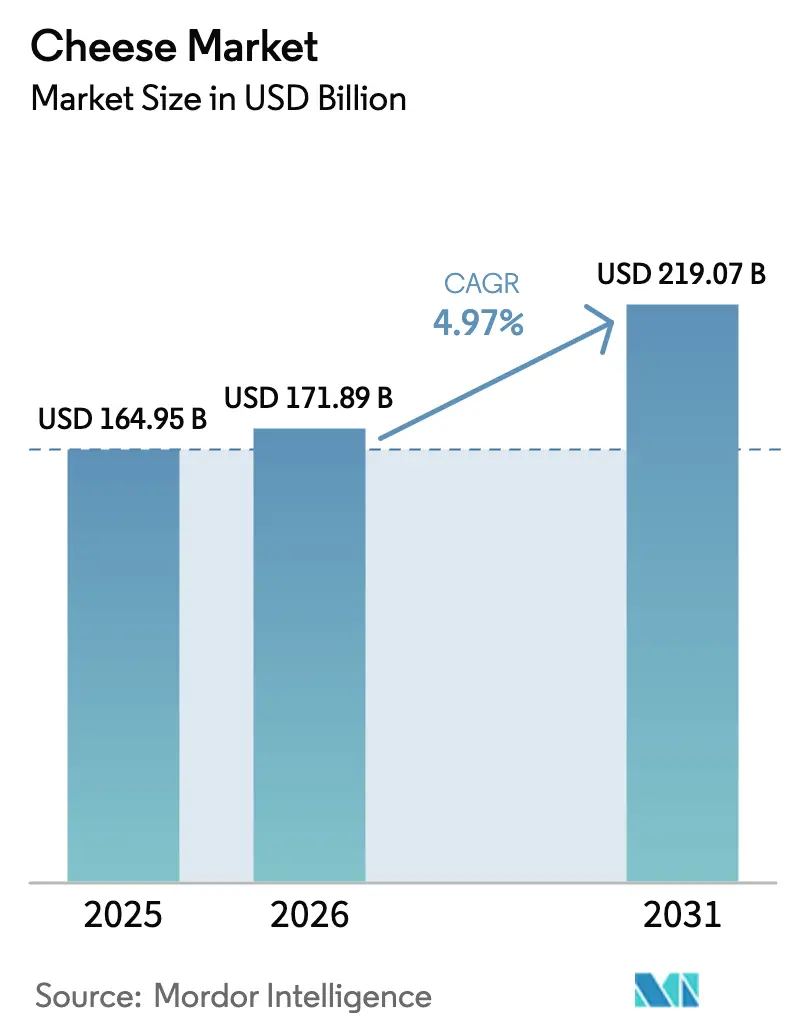
| Market Size (2026) | USD 171.89 Billion |
| Market Size (2031) | USD 219.07 Billion |
| Growth Rate (2026 - 2031) | 4.97% CAGR |
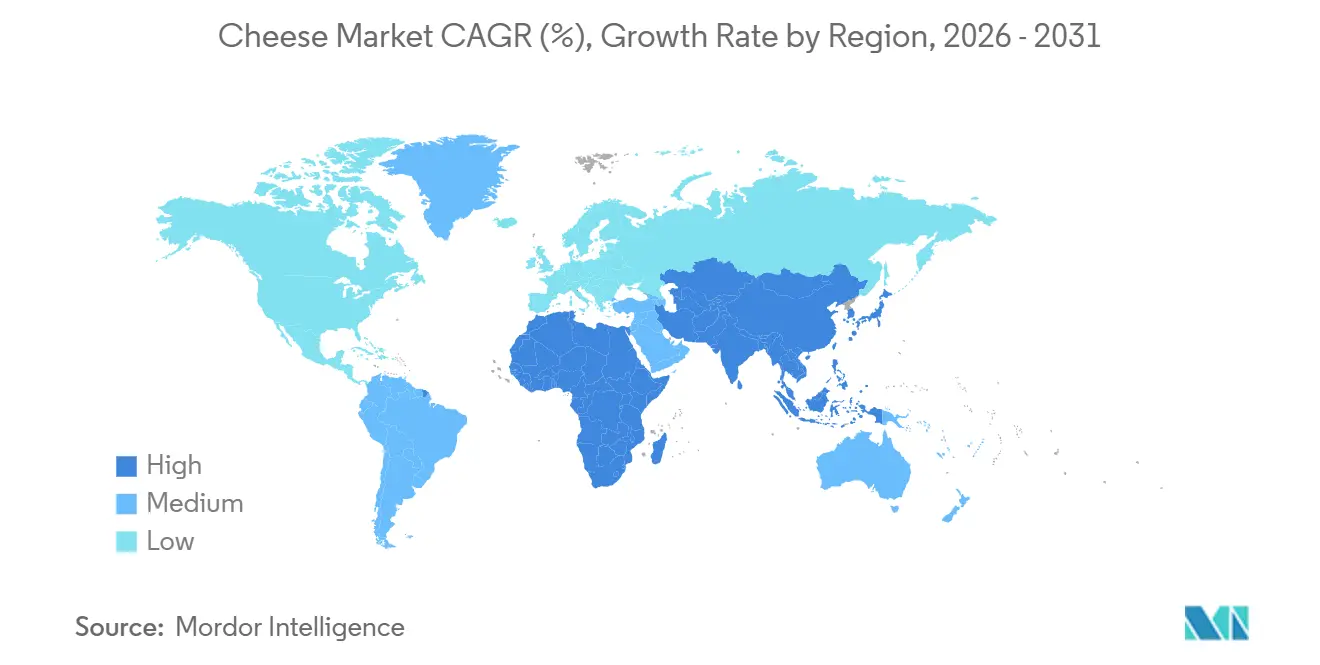
| Fastest Growing Market | Asia-Pacific |
| Largest Market | Europe |
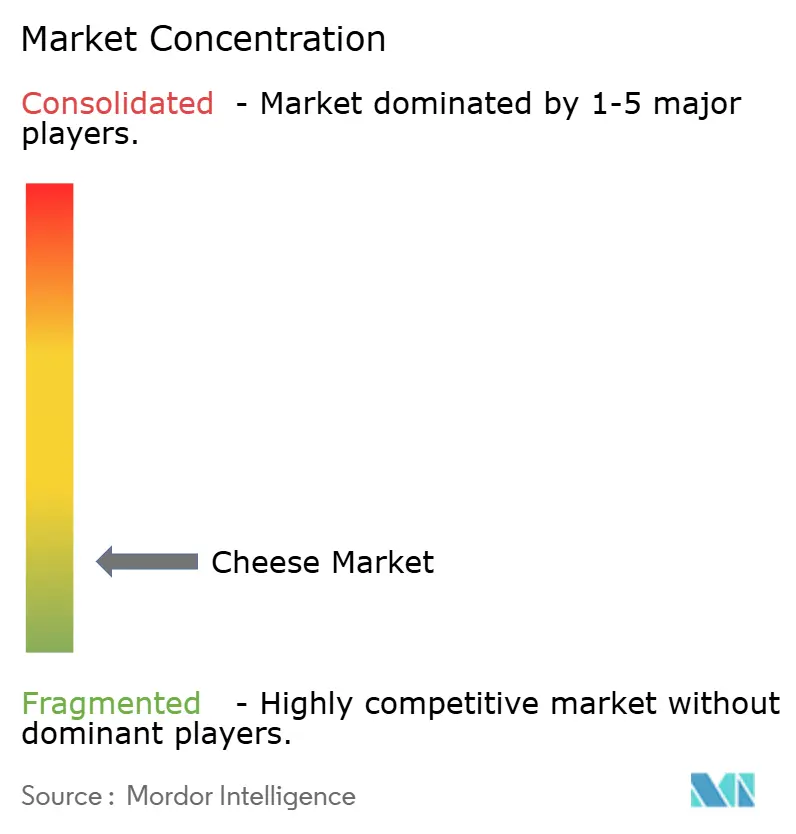
| Market Concentration | Low |
Major Players *Disclaimer: Major Players sorted in no particular order Image © Mordor Intelligence. Reuse requires attribution under CC BY 4.0. | |
Cheese Market Analysis by Mordor Intelligence
The cheese market size is projected to expand from USD 164.95 billion in 2025 and USD 171.89 billion in 2026 to USD 219.07 billion by 2031, registering a compound annual growth rate (CAGR) of 4.97% between 2026 to 2031. This growth highlights the steady expansion of the market. Factors such as robust urbanization, increasing disposable incomes, and changing protein preferences, particularly in the Asia-Pacific region, are driving consumption beyond traditional cooking uses to include on-the-go snacking, premium entertaining, and convenience-focused foodservice menus. Innovations in formats, such as sliced, shredded, and baked cheese snacks, have enhanced portion control for restaurants, improved shelf appeal in retail settings, and reduced labor requirements in institutional kitchens. Additionally, sustainability efforts are directing investments toward low-emission feed additives, carbon-neutral processing methods, and fiber-based packaging that minimizes plastic usage while maintaining shelf life. The competitive landscape remains intense, as no single player holds pricing power. Multinational corporations, regional cooperatives, and artisanal producers are focusing on differentiation through provenance, technology, or cost leadership to achieve balanced growth in both volume and value within the global cheese market.
Key Report Takeaways
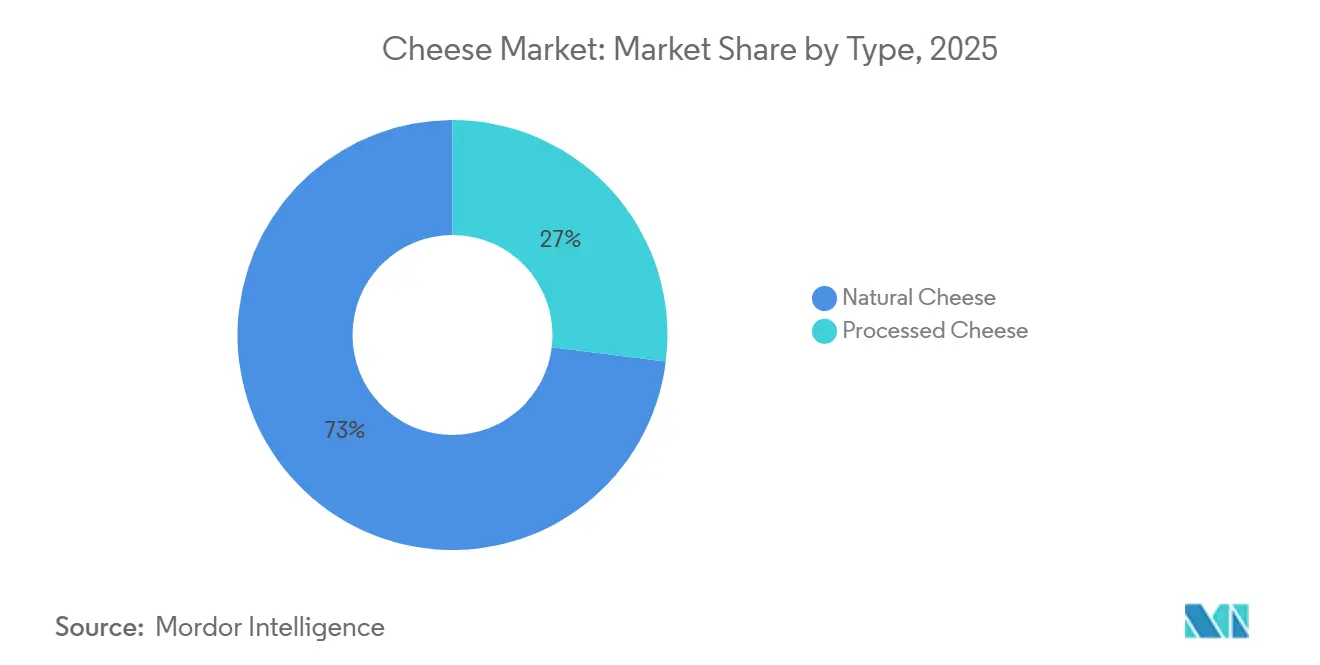
- By type, natural cheese captured 73.03% of the global cheese market share in 2025, whereas processed cheese is forecast to expand at a 5.24% CAGR through 2031.
- By milk source, cow milk dominated with 53.01% contribution to the global cheese market size in 2025, while goat milk cheese is set to advance at a 6.34% CAGR to 2031.
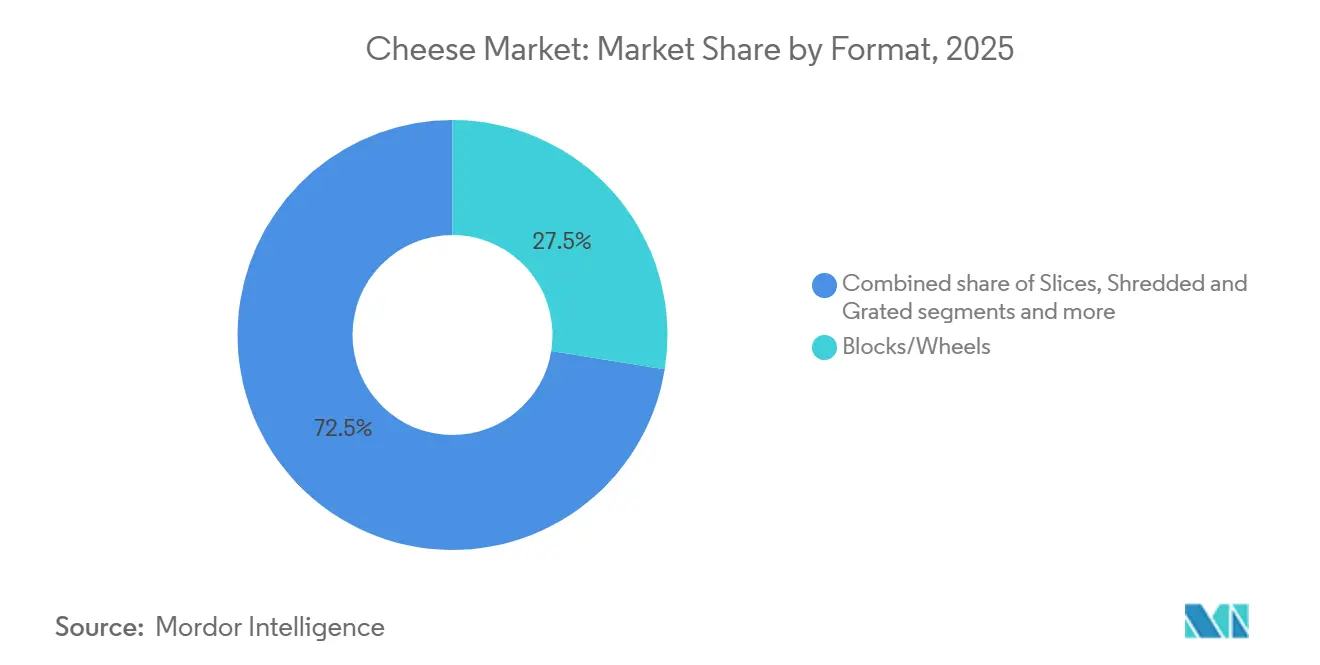
- By format, blocks and wheels accounted for 27.54% of the global cheese market size in 2025, yet sliced cheese leads growth at a 6.34% CAGR through 2031.
- By distribution channel, retail held 63.53% of the global cheese market share in 2025, while foodservice is rising fastest at a 5.61% CAGR to 2031.
- By geography, Europe led revenue with a 27.32% share of the global cheese market in 2025, but Asia-Pacific is expanding at the highest 6.89% CAGR through 2031.
Note: Market size and forecast figures in this report are generated using Mordor Intelligence’s proprietary estimation framework, updated with the latest available data and insights as of January 2026.
Global Cheese Market Trends and Insights
Drivers Impact Analysis*
| Driver | (~) % Impact on CAGR Forecast | Geographic Relevance | Impact Timeline |
|---|---|---|---|
| Growth in cheese varieties and specialty types | +1.2% | Global, with premium segments in North America and Europe | Medium term (2-4 years) |
| Sustainability concerns influencing demand for eco-friendly cheese products | +0.8% | Europe and North America, spillover to Asia-Pacific | Long term (≥ 4 years) |
| Popularity of ready-to-eat and convenience foods | +1.5% | Global, strongest in Asia-Pacific and North America | Short term (≤ 2 years) |
| Advancements in cheese ripening and flavor enhancement technology | +0.6% | Europe and North America, technology transfer to emerging markets | Medium term (2-4 years) |
| Premiumization trend boosting demand for aged and artisanal cheeses | +1.0% | North America, Europe, and affluent Asia-Pacific urban centers | Medium term (2-4 years) |
| Increasing product visibility through new formats | +0.7% | Global, with rapid adoption in foodservice channels | Short term (≤ 2 years) |
| Source: Mordor Intelligence | |||


Growth in cheese varieties and specialty types
The growing demand for specialty cheese varieties is transforming value pools as consumers increasingly opt for options like feta, halloumi, and aged Gouda instead of standard choices such as mozzarella and cheddar. This shift is particularly evident in North America, where specialty cheese sales recorded year-over-year growth in 2025, outpacing the overall category growth by a factor of three. Retailers are expanding shelf space for curated cheese assortments, often positioning them alongside charcuterie and crackers to encourage complementary purchases. In Europe, a similar trend is observed, with protected designation of origin cheeses such as Parmigiano-Reggiano and Roquefort using their authenticity to command price premiums of 40 percent to 60 percent over generic hard and blue cheeses. Smaller producers are leveraging direct-to-consumer channels to bypass traditional distribution markups, allowing them to retain margins that would otherwise go to wholesalers. In response, larger companies are acquiring artisanal brands or launching premium sub-brands to protect their market share in the fastest-growing premium price segments.
Sustainability concerns influencing demand for eco-friendly cheese products
Environmental considerations are significantly shaping sourcing and packaging strategies, with dairy cooperatives increasingly adopting regenerative agriculture practices to reduce methane emissions from cattle. In 2025, Fonterra announced its plan to transition 30% of its New Zealand supplier base to low-emission feed additives by 2028, with the goal of achieving a 15% reduction in Scope 3 emissions. Furthermore, the European Union LIFE (L’Instrument Financier pour l’Environnement) program allocated EUR 45 million (USD 48 million) in grants in 2024 to support pilot projects for carbon-neutral cheese production facilities in France and the Netherlands, reflecting strong regulatory backing for decarbonization efforts [1]Source: Eurostat, “Italy unmatched in pasta production and exports,” ec.europa.eu. On the packaging front, innovation remains critical as single-use plastics face bans in several jurisdictions. In 2025, Arla Foods introduced a fiber-based wrapper for sliced cheese, which reduced plastic content by 60% while maintaining the 90-day shelf life required for export markets. However, these sustainability initiatives come with substantial upfront capital costs, posing challenges for smaller producers. This financial strain may lead to increased industry consolidation, as achieving compliance with sustainability standards increasingly demands economies of scale.
Popularity of ready-to-eat and convenience foods
The demand for grab-and-go cheese formats is increasing as busy consumers prioritize convenience without compromising their protein intake. Products such as string cheese, cheese cubes, and portion-controlled snack packs experienced an 18% growth in volume during 2025, with Asia-Pacific markets driving significant growth due to the expansion of modern retail channels. Kraft Heinz introduced a line of single-serve cheese and cracker combinations in Japan and South Korea in early 2025, capturing an 8% share of the ambient snacking category within six months. Foodservice operators are also adopting pre-portioned formats to reduce labor costs and minimize waste. A 2024 survey of United States quick-service restaurants found that 72% had transitioned to pre-sliced or pre-shredded cheese to enhance kitchen efficiency during peak hours. This trend has created a dual demand, with bulk formats catering to price-sensitive institutional buyers, while premium single-serve options target on-the-go consumers willing to pay a 30% to 40% premium for convenience.
Advancements in cheese ripening and flavor enhancement technology
Precision fermentation and microbial engineering are enabling producers to accelerate aging processes and enhance flavor complexity without extending production cycles. Agroscope, a Swiss research institute, published findings in 2024 indicating that specific Lactobacillus strains can reduce the ripening time for Emmental cheese by 25% while maintaining traditional flavor profiles. Similarly, the Leibniz Institute for Food Systems Biology in Germany developed a rapid-aging technique in 2025 using controlled humidity and temperature oscillations, which has since been licensed to three European cheesemakers. These innovations reduce working-capital requirements by shortening inventory holding periods, a significant advantage in an industry where aged cheeses can tie up capital for 12 to 36 months. However, adoption remains inconsistent; artisanal producers resist technology-driven methods, arguing they undermine terroir-based differentiation, while industrial players consider them essential for meeting rising demand without proportional capacity expansion.
Restraints Impact Analysis*
| Restraint | (~) % Impact on CAGR Forecast | Geographic Relevance | Impact Timeline |
|---|---|---|---|
| Regulatory challenges in food safety, adulteration, and labeling | -0.6% | Global, with acute pressure in Europe and North America | Medium term (2-4 years) |
| Health concerns related to high fat and calorie content | -0.9% | North America and Europe, emerging in Asia-Pacific | Long term (≥ 4 years) |
| Lack of standardization in regional cheese quality and type definitions | -0.4% | Emerging markets in Asia-Pacific, Latin America, and Middle East and Africa | Medium term (2-4 years) |
| Hygiene and traceability issues in farm-to-table supply chains | -0.5% | South Asia, Southeast Asia, and parts of Latin America | Short term (≤ 2 years) |
| Source: Mordor Intelligence | |||
Regulatory challenges in food safety, adulteration, and labeling
Divergent regulatory frameworks across jurisdictions increase compliance costs, disproportionately affecting exporters and smaller producers. In 2024, the U.S. Food and Drug Administration issued updated guidance requiring country-of-origin labeling for all imported cheeses, adding an estimated USD 0.15 per kilogram in labeling and documentation costs [2]Source: U.S. Food & Drug Administration, “Food Traceability Rule: Critical Tracking Events (CTEs) and Key Data Elements (KDEs),” fda.gov. Similarly, the European Food Safety Authority tightened limits on Listeria monocytogenes in soft cheeses in 2025, necessitating more frequent testing and compelling several French producers to upgrade aging facilities with improved sanitation systems. Adulteration remains a significant concern in price-sensitive markets; for instance, India's Food Safety and Standards Authority found palm oil substitution in 18% of processed cheese samples tested during a 2024 inspection, leading to recalls and diminishing consumer trust [3]Source: Food Safety and Standards Authority of India (FSSAI), “Food Safety And Standards (Labelling And Display) Regulations,” fssai.gov.in. Labeling disputes also remain contentious, particularly regarding terms like "natural" and "artisanal," which lack standardized definitions and often result in accusations of greenwashing.
Health concerns related to high fat and calorie content
Consumers are increasingly aware of the risks associated with cardiovascular diseases, prompting them to pay closer attention to saturated fat and sodium levels in their diets. This trend is particularly evident in developed markets where per capita cheese consumption exceeds 15 kilograms annually. In 2025, the World Health Organization (WHO) reaffirmed its recommendation that saturated fat should account for less than 10 percent of total energy intake. A single 50-gram serving of aged cheddar can nearly reach this limit. In response, several producers introduced reduced-fat cheese variants; however, these often compromise the texture and flavor intensity that are key to premium positioning. For example, Lactalis launched a 30 percent reduced-fat Président Brie in 2025, but initial sales data showed that a 40 percent price discount was required to match the sales volume of full-fat versions, which negatively impacted profitability. Sodium reduction presents additional challenges, as salt is critical for microbial control and flavor development during the aging process. These health-related challenges are most significant in North America and Europe, where obesity rates remain high, but they are also beginning to emerge in urban Asia-Pacific markets as Western dietary habits become more prevalent.
*Our forecasts treat driver/restraint impacts as directional, not additive. The impact forecasts reflect baseline growth, mix effects, and variable interactions.
Segment Analysis
By Type: Natural Cheese Dominates but Processed Variants Gain Ground
In 2025, natural cheese accounted for 73.03% of the market share, underscoring a strong consumer preference for dairy products that undergo minimal processing. This preference highlights the growing demand for products perceived as more natural and wholesome. On the other hand, processed cheese is anticipated to grow at a Compound Annual Growth Rate (CAGR) of 5.24% through 2031. This growth is primarily driven by clean-label reformulations, which appeal to health-conscious consumers by offering transparency in ingredients while maintaining the convenience features that are crucial for adoption in the foodservice industry. Mozzarella continues to dominate as the largest sub-segment within natural cheese, supported by the increasing consumption of pizza in Asia-Pacific markets. This trend is further bolstered by the expansion of quick-service restaurant chains in the region.
Parmesan and other hard cheeses are experiencing significant benefits from premiumization trends, with aged variants commanding retail prices that are approximately 50% higher than those of commodity mozzarella. Feta and other brined cheeses are becoming increasingly popular in Mediterranean and Middle Eastern cuisines, reflecting a shift in consumer preferences toward diverse and authentic flavors. Meanwhile, ricotta and cottage cheese are gaining traction among fitness-focused consumers who prioritize high-protein, low-fat options in their diets. Cream cheese, while showing stagnant growth in mature markets, is witnessing rapid expansion in Asia due to the growing popularity of Western-style breakfasts in the region.

By Milk Source: Cow Milk Leads While Goat Milk Surges
Cow milk accounted for 53.01% of the cheese market in 2025, primarily due to its cost efficiency and the presence of well-established supply chains. This dominance underscores the widespread availability and affordability of cow milk, making it the preferred choice for large-scale cheese production. In contrast, goat milk cheese is experiencing a compound annual growth rate (CAGR) of 6.34%. This growth is attributed to increasing consumer demand for its digestibility benefits and its positioning as a premium product. Goat cheese typically commands retail prices 30% to 50% higher than cow milk cheese, a premium linked to its perceived superior nutritional value and the artisanal methods used in its production.
Buffalo milk cheese, primarily represented by mozzarella di bufala, occupies a niche yet profitable segment within the cheese market. Italian exports of buffalo milk cheese to the Asia-Pacific region increased by 19% year-over-year in 2025. This growth is supported by the rising preference among affluent consumers in countries such as China and Japan for authentic Mediterranean products. Meanwhile, sheep milk cheese production remains concentrated in Southern Europe and the Middle East, where traditional varieties such as Pecorino Romano and feta are protected by geographic indications. These geographic protections play a crucial role in preserving the authenticity of these cheeses but also limit the potential for significant expansion in supply.
By Format: Sliced Cheese Gains as Convenience Trumps Cost
Blocks and wheels accounted for 27.54% of the market share in 2025, driven by institutional buyers and cost-conscious consumers who prioritize cost efficiency per kilogram. At the same time, sliced cheese is projected to grow at a Compound Annual Growth Rate (CAGR) of 6.34%, as both foodservice operators and households increasingly adopt portion-controlled formats to save on labor and reduce waste. Pre-sliced cheese eliminates the need for cutting equipment and minimizes waste, particularly in quick-service restaurants where speed and consistency are critical. A 2025 survey of United States sandwich chains revealed that 68% had fully transitioned to pre-sliced cheese, reporting a 12% reduction in labor costs and a 15% decrease in product waste.
Shredded and grated cheese is also experiencing strong growth, fueled by rising pizza and pasta consumption. However, the use of anti-caking agents to prevent clumping has faced criticism from clean-label advocates. Spreads and cubes represent smaller but rapidly growing segments, with spreads benefiting from the increasing popularity of snacking and cubes appealing to parents seeking convenient protein options for children's lunchboxes. Within this category, cheese sticks, a sub-segment of cubes and sticks, recorded a 22% increase in volume in 2025, with significant growth driven by Asia-Pacific markets as Western snacking habits gained traction in the region.

By Distribution Channel: Retail Leads but Foodservice Accelerates
In 2025, retail channels accounted for 63.53% of the total cheese volume, emphasizing the critical role of cheese as a household staple across diverse consumer groups. The foodservice segment is experiencing consistent growth, with a compound annual growth rate (CAGR) of 5.61%. This growth is largely attributed to the recovery in restaurant traffic and the expansion of quick-service restaurant (QSR) chains that prominently feature cheese-focused menu offerings. Supermarkets and hypermarkets remain the dominant retail sub-channel, leveraging private-label programs to improve profit margins. Additionally, these outlets are introducing curated specialty cheese sections aimed at attracting higher-income consumers, further solidifying their leadership in the market.
Convenience stores are steadily increasing their market share in urban areas, where single-serve and grab-and-go formats align with the preferences of busy, time-constrained consumers. Online retail, which saw substantial growth during the COVID-19 pandemic, has continued to maintain high penetration levels. This trend is particularly notable for specialty and imported cheeses, which are often less accessible in physical retail stores. A 2025 analysis indicated that online channels accounted for 12% of cheese sales in the United States, marking a significant rise from 6% in 2020.
Geography Analysis
In 2025, Europe led the global cheese market, accounting for 27.32% of the total share. This dominance is rooted in its long-standing consumption traditions and the Protected Designation of Origin (PDO) frameworks, which provide regional producers with pricing advantages. Germany, France, Italy, and the Netherlands collectively contributed over 60% of European production, each specializing in unique cheese varieties that reflect local terroir and production methods. However, growth in the region is slowing as per-capita consumption approaches saturation and health concerns over saturated fats influence dietary preferences. Regulatory oversight remains significant, with the European Food Safety Authority (EFSA) enforcing strict microbial limits and the European Union's Farm to Fork strategy targeting a 20% reduction in food waste by 2030. Producers are responding by investing in shelf-life extension technologies, while sustainability-focused innovations, such as carbon-neutral production and biodegradable packaging, are gaining traction. Post-Brexit trade disruptions in the United Kingdom have increased supply chain costs, while Eastern European countries like Poland are expanding production capacity to meet both domestic and export demand.
The Asia-Pacific region is the fastest-growing cheese market, with a compound annual growth rate (CAGR) of 6.89% projected through 2031. This growth is driven by urbanization, rising disposable incomes, and the adoption of Western dietary habits. China is the standout market, with per-capita cheese consumption tripling between 2020 and 2025 due to the proliferation of pizza and burger chains and the expansion of modern retail. In India, traditional paneer consumption remains robust, while Western-style cheese adoption is concentrated in urban areas and among younger consumers. Japan and South Korea are mature markets, where demand is shifting toward premium imported varieties and fusion products that combine cheese with traditional ingredients. Improvements in cold-chain infrastructure across Southeast Asia are unlocking demand, although price sensitivity remains a challenge in lower-income markets such as Indonesia and the Philippines. Australia and New Zealand are net exporters, leveraging pasture-based production systems that command sustainability premiums in Asian export markets.
Other regions are also contributing to the global cheese market's growth. North America held a significant share in 2025, with the United States as the largest contributor, where per-capita cheese consumption exceeded 17 kilograms annually. The region is characterized by high foodservice penetration, with quick-service restaurants accounting for nearly 40% of cheese volume. Mexico is experiencing rapid growth, driven by traditional queso fresco consumption and increasing urban adoption of processed cheese. In Canada, bilingual labeling requirements and provincial trade barriers fragment distribution, raising costs for national brands. Additionally, updated guidance from the U.S. Food and Drug Administration (FDA) on country-of-origin labeling has increased compliance costs for importers, while tariff uncertainties complicate long-term sourcing strategies for multinational producers. South America is steadily expanding, with Brazil and Argentina as key markets. Brazil's cheese consumption is rising as middle-class growth drives demand for both traditional requeijão and imported European varieties. Argentina benefits from a strong dairy farming base and exports significant volumes of hard cheeses to neighboring countries and Europe, although economic instability and currency fluctuations pose challenges. In the Middle East and Africa, the market is fragmented. Gulf Cooperation Council (GCC) countries rely heavily on imports, with demand driven by expatriate populations and tourism. Meanwhile, North African markets such as Egypt and Morocco have established local production but face challenges in maintaining quality consistency.

Competitive Landscape
The global cheese market is highly fragmented, with multinational corporations, regional cooperatives, and artisanal producers competing across various price and quality segments. Large-scale players, including Groupe Lactalis, The Kraft Heinz Company, and Arla Foods amba, leverage vertical integration and multi-country operations to achieve cost efficiencies. However, these companies face challenges in replicating the authenticity and storytelling that drive the premiumization of smaller, terroir-focused brands.
Competitive strategies vary significantly by segment. In the commodity cheese segment, companies prioritize procurement efficiency and maximizing capacity utilization. Conversely, specialty cheese varieties focus on differentiation through provenance, aging techniques, and sensory attributes, enabling them to command price premiums of 40% to 60%. Emerging opportunities are evident in plant-based cheese alternatives and hybrid products combining dairy and non-dairy ingredients. However, these segments remain in the early stages of development and face challenges related to taste and texture, which hinder their mainstream adoption.
Technological advancements are reshaping the cheese market. Leading companies are adopting precision fermentation to reduce aging times and implementing blockchain-based traceability systems to enhance food safety. For instance, Fonterra Co-operative Group Limited's 2025 pilot project in Thailand demonstrated that end-to-end supply chain visibility could reduce recall costs by 60%. Additionally, disruptors such as direct-to-consumer artisanal brands are bypassing traditional distribution channels to capture margins through e-commerce. Regional cooperatives in emerging markets are scaling production to compete with multinational players on price. Innovation in cheese-ripening technology is accelerating, as evidenced by an 18% year-over-year increase in patent filings in 2025, with European and North American applicants leading the way. Regulatory compliance is also becoming a critical differentiator. Producers implementing robust traceability systems and obtaining certifications such as ISO 22000 are gaining preferential access to export markets and institutional buyers.
Cheese Industry Leaders
Groupe Lactalis SA
FrieslandCampina NV
Arla Foods amba
Fonterra Co-operative Group Ltd
Saputo Inc.
- *Disclaimer: Major Players sorted in no particular order

Recent Industry Developments
- March 2025: Paras Dairy, a subsidiary of VRS Foods, launched a new cheese brand, Galacia. The brand offers mozzarella cheese in various formats like cheese blocks, shredded cheese, cheese dip, and others. The products are available across North, West, and South India.
- March 2025: Cheese manufacturer Sargento launched sliced American cheese and shredded cheese, along with crackers for snacking. The company partnered with Mondeléz International for this product's launch.
- September 2024: RELCO, a Kovalus company, has formed a strategic partnership with Milky Mist Dairy Food Private Limited, a major player in India's private dairy sector. This partnership involves establishing India's largest Cheddar cheese manufacturing plant.
- May 2024: Atalanta launched a new cheese brand, Cracking Good, featuring traditional cheeses from the British Isles. The initial product line includes Mature Irish Cheddar, Extra Mature Scottish Cheddar, and Vintage English Cheddar, produced using grass-fed milk.


Research Methodology Framework and Report Scope
Market Definitions and Key Coverage
Our study defines the global cheese market as all dairy-based natural and processed cheeses produced for retail, food-service, or industrial use, valued at ex-factory prices and stated in USD. According to the latest Mordor Intelligence publication, the market is valued at USD 163.83 billion in 2025 and is forecast to reach USD 210.15 billion by 2030.
Scope exclusion: Plant-based cheese analogs, whey powders, and standalone cheese ingredient blends are excluded.
Segmentation Overview
- By Type
- Natural Cheese
- Mozzarella
- Feta
- Ricotta
- Cottage
- Cream
- Parmesan
- Others
- Processed Cheese
- Natural Cheese
- By Milk Source
- Cow
- Goat
- Buffalo
- Others
- By Format
- Blocks/Wheels
- Slices
- Shredded and Grated
- Spreads
- Cubes and Sticks
- Others
- By Distribution Channel
- Foodservice (HoReCa)
- Retail
- Supermarkets and Hypermarkets
- Convenience Stores
- Specialist Retailers
- Online Retail
- Others
- By Geography
- North America
- United States
- Canada
- Mexico
- Rest of North America
- Europe
- Germany
- United Kingdom
- Italy
- France
- Spain
- Netherlands
- Poland
- Belgium
- Sweden
- Rest of Europe
- Asia-Pacific
- China
- India
- Japan
- Australia
- Indonesia
- South Korea
- Thailand
- Singapore
- Rest of Asia-Pacific
- South America
- Brazil
- Argentina
- Colombia
- Chile
- Peru
- Rest of South America
- Middle East and Africa
- South Africa
- Saudi Arabia
- United Arab Emirates
- Nigeria
- Egypt
- Morocco
- Turkey
- Rest of Middle East and Africa
- North America
Detailed Research Methodology and Data Validation
Primary Research
Mordor analysts interviewed processors, ingredient technologists, HoReCa buyers, and regional distributors on five continents to validate production yields, fat-content price ladders, retail turnover ratios, and upcoming plant start-ups, thereby closing gaps flagged during desk work.
Desk Research
We began with open datasets such as FAO milk production, USDA Dairy Production, Eurostat PRODCOM, and UN Comtrade trade codes to benchmark supply volumes and cross-border flows. Industry bodies, including the European Dairy Association and the U.S. IDFA, added consumption and pricing context, while peer-reviewed journals helped confirm nutrition-driven demand themes. Company 10-Ks, investor decks, and press releases supplied brand-level ASP trends, and paid feeds like D&B Hoovers plus Dow Jones Factiva provided timely channel sentiment and new capacity alerts. The sources named are illustrative; many other reputable publications were also reviewed.
Market-Sizing & Forecasting
A top-down construct converts country milk output and trade balances into cheese production potential. Then, selective bottom-up checks on processor sales and sampled ASP × volume estimates refine totals. Core variables include raw-milk availability, utilization rates, retail price indices, food-service traffic, and per-capita intake trends. Demand to 2030 is projected through multivariate regression and scenario analysis, with gaps in processor data bridged using region-specific utilization proxies before final triangulation.
Data Validation & Update Cycle
Model outputs undergo variance screens against historic series; any anomalies trigger reruns and fresh expert calls before senior review sign-off. Reports refresh annually, with interim updates issued when material regulatory or supply shocks emerge.
Why Mordor's Cheese Baseline Earns Decision-Maker Trust
Published estimates often diverge because firms apply different scopes, pricing levels, and refresh cadences.
One global consultancy pegs 2024 value at USD 204.7 billion, while a statistical platform places 2025 revenue at USD 258.2 billion.
Benchmark comparison
| Market Size | Anonymized source | Primary gap driver |
|---|---|---|
| USD 163.83 B (2025) | Mordor Intelligence | - |
| USD 204.7 B (2024) | Global Consultancy A | Includes plant-based cheese and retail margins |
| USD 258.19 B (2025) | Industry Data Platform B | Uses average retail selling prices and sporadic updates |
The comparison highlights how disciplined scope selection, price normalization, and a documented update cycle let Mordor offer a balanced, transparent baseline that executives can rely on.


Key Questions Answered in the Report
What is the current value of the global cheese market?
The global cheese market size stands at USD 171.89 billion in 2026.
How fast will the market grow through 2031?
The global cheese market is forecast to expand at a 4.97% CAGR, reaching USD 219.07 billion by 2031.
Which cheese type holds the largest share?
Natural cheese leads with 73.03% of global cheese market share as of 2025.
Which region is growing the fastest?
Asia-Pacific is projected to post a 6.89% CAGR through 2031, the highest regional growth rate.
What channel is expanding more quickly—retail or foodservice?
What channel is expanding more quickly - retail or foodservice?
Page last updated on:


