Tahini Market Size and Share
Market Overview
| Study Period | 2021 - 2031 |
|---|---|
| Market Size (2026) | USD 453.65 Million |
| Market Size (2031) | USD 541.96 Million |
| Growth Rate (2026 - 2031) | 3.62% CAGR |
| Fastest Growing Market | Asia Pacific |
| Largest Market | Middle East and Africa |
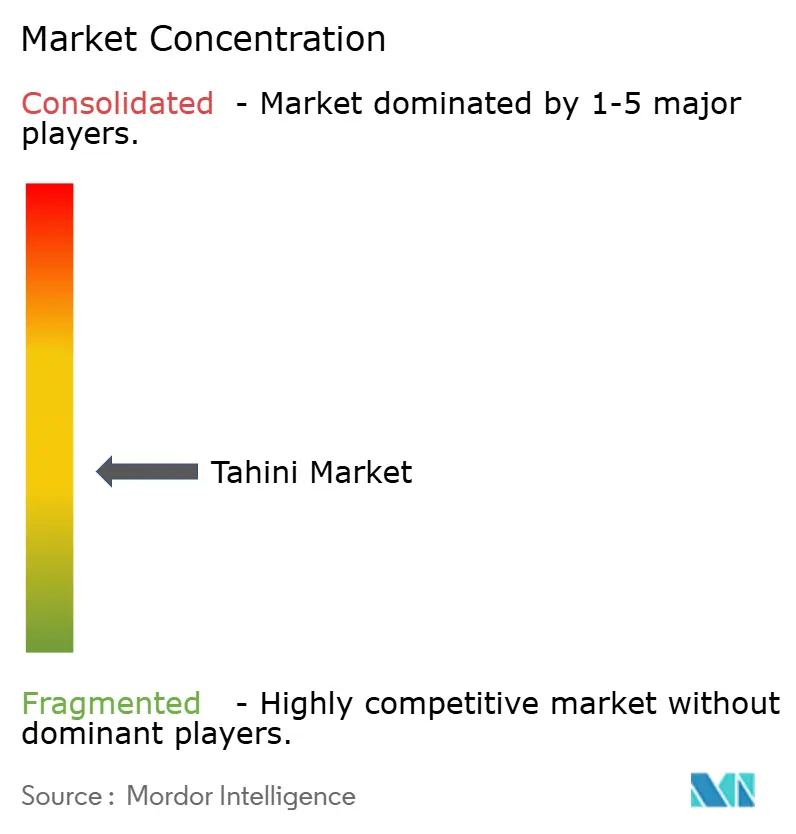
| Market Concentration | Medium |
Major Players
*Disclaimer: Major Players sorted in no particular order Image © Mordor Intelligence. Reuse requires attribution under CC BY 4.0. |
|
Tahini Market Analysis by Mordor Intelligence
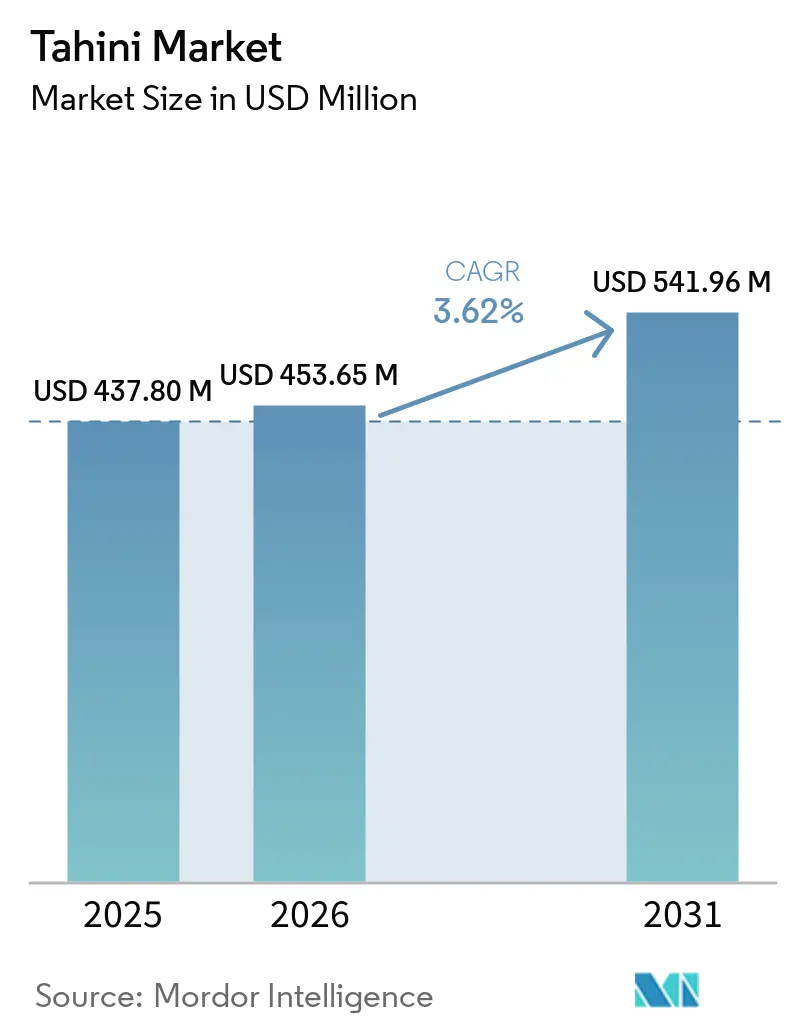
Tahini market size in 2026 is estimated at USD 453.65 million, growing from 2025 value of USD 437.8 million with 2031 projections showing USD 541.96 million, growing at 3.62% CAGR over 2026-2031. Momentum reflects rising global acceptance of Middle-Eastern cuisine, a wider shift toward plant-based foods, and consumers’ growing interest in nutrient-dense spreads that are free from extensive processing. Demand is further supported by the ingredient’s 25% protein content, naturally occurring calcium and magnesium, and its compatibility with vegan, gluten-free, and clean-label diets. Growth avenues include premium organic variants, convenient squeeze-bottle formats, and high-pressure processing that extends shelf life without preservatives. Meanwhile, expanding e-commerce penetration, flavor experimentation, and social-media food trends are broadening the product’s reach into new demographics and meal occasions.
Key Report Takeaways
- By flavor, unflavored tahini led with 73.85% of the tahini market share in 2025, while flavored variants are forecast to grow at a 4.34% CAGR through 2031.
- By nature, conventional products held 86.78% of the tahini market size in 2025; organic tahini is projected to expand at a 6.05% CAGR through 2031.
- By packaging, jar formats accounted for 48.12% of the tahini market size in 2025, whereas squeeze bottles will rise at a 5.12% CAGR between 2026-2031.
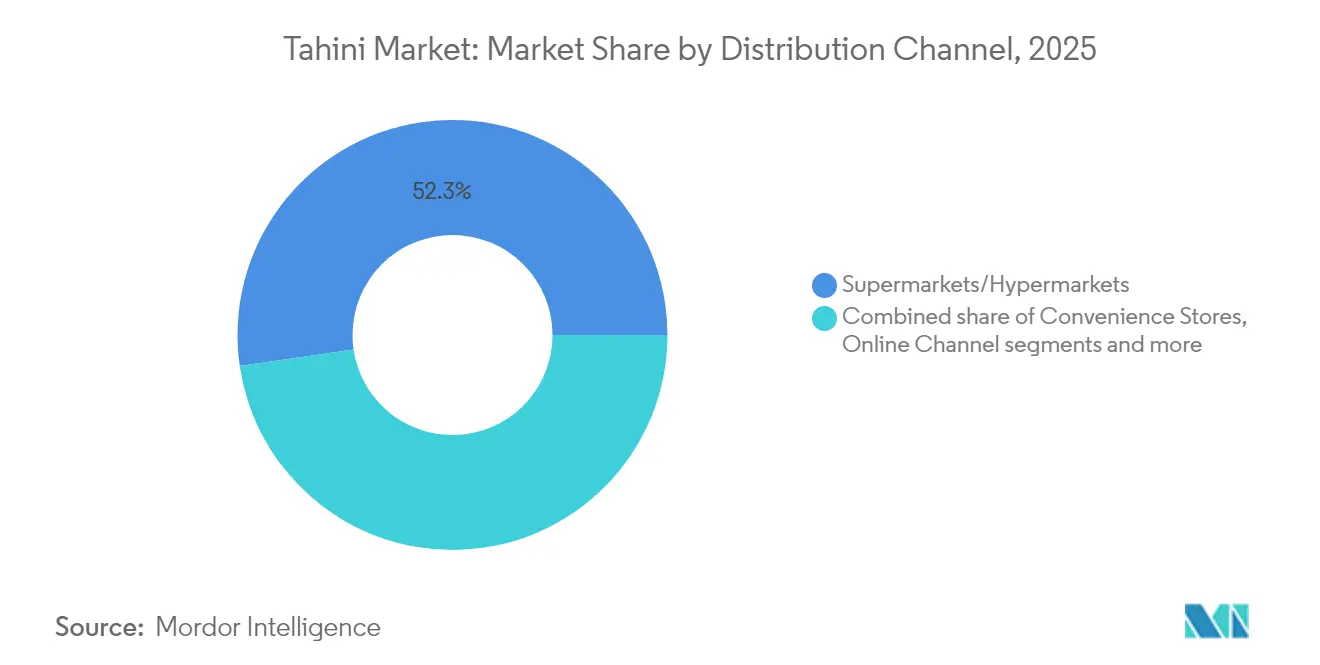
- By distribution channel, supermarkets and hypermarkets commanded 52.30% revenue share in 2025, but online retail is advancing fastest at a 6.60% CAGR through 2031.
- By geography, the Middle East and Africa captured 39.20% revenue share in 2025; Asia-Pacific will post the highest regional CAGR at 4.01% through 2031.
Note: Market size and forecast figures in this report are generated using Mordor Intelligence’s proprietary estimation framework, updated with the latest available data and insights as of 2026.
Global Tahini Market Trends and Insights
Drivers Impact Analysis*
| Driver | (~) % Impact on CAGR Forecast | Geographic Relevance | Impact Timeline |
|---|---|---|---|
| Rising popularity of Middle Eastern cuisine globally | +0.8% | North America and Europe, spill-over to Asia-Pacific | Medium term (2-4 years) |
| Growth in plant-based spreads and vegan diets | +0.7% | Global, with concentration in North America and Europe | Long term (≥ 4 years) |
| Retail penetration via e-commerce and gourmet grocery chains | +0.5% | Global, early gains in urban centers | Short term (≤ 2 years) |
| Adoption of high-pressure processing to extend shelf-life | +0.3% | North America and Europe core markets | Medium term (2-4 years) |
| Innovations in flavor and packaging | +0.4% | Global, with premium positioning in developed markets | Medium term (2-4 years) |
| Availability of organic, clean-label and additive-free variants | +0.6% | North America and Europe, expanding to Asia-Pacific | Long term (≥ 4 years) |
| Source: Mordor Intelligence | |||


Rising Popularity of Middle-Eastern Cuisine Globally
The globalization of Middle Eastern culinary traditions creates sustained demand for authentic tahini across non-traditional markets, with restaurants and food service establishments driving initial adoption before retail penetration accelerates. Hummus, a popular Middle Eastern dip, acts as a gateway, introducing consumers to tahini. While traditionally used in Middle Eastern dishes, tahini is now finding its way into smoothies, salad dressings, and baked goods. Social media's food culture and endorsements from celebrity chefs are amplifying this shift, particularly among health-conscious consumers. Saudi Arabia, welcoming 29.7 million international tourists in 2024, is witnessing a surge in tahini demand [1]Source: Travel and Tour World, "Saudi Arabia, Qatar, Turkey, Egypt, Oman, Kuwait, UAE, and Jordan Ignite a Middle East Tourism Boom Set to Become a Three Hundred Fifty Billion US Dollar Powerhouse by the End of the Decade: New Report", www.travelandtourworld.com. Tourists exposed to local cuisines develop a taste for tahini and seek it out upon returning home. Additionally, immigrants from the Middle East are bridging cultural gaps, making tahini consumption more mainstream. Fusion cuisine is further integrating tahini into local dishes. Given these trends, tahini is transitioning from a specialty ingredient to a staple in pantries across developed economies.
Growth in Plant-based Spreads and Vegan Diets
Plant-based dietary adoption accelerates tahini demand as consumers seek protein-rich alternatives to animal-derived spreads, with tahini's 25% protein content positioning it favorably against traditional nut butters. The growing adoption of vegan diets and the increasing demand for plant-based spreads are driving the tahini market.According to a report by the Plant Based Foods Association (PBFA), the plant-based food market in the United States reached a value of USD 8.1 billion in 2023 [2]Source: Good Food Institute, "2023 State of the Industry Report Plant based: Meat, Seafood, Eggs and Dairy", www.gfi.org. The rising awareness of the health benefits associated with vegan diets, including reduced risks of chronic diseases, is also contributing to the increased demand for tahini as a versatile and nutritious spread. As per the Centers for Disease Control and Prevention, around 129 million Americans grapple with at least one major chronic ailment, including heart disease, cancer, diabetes, obesity, and hypertension [3]Source: Center for Disease Control and Prevention, "Chronic Disease Prevalence in the US: Sociodemographic and Geographic Variations by Zip Code Tabulation Area", www.cdc.gov Furthermore, the United Nations Food and Agriculture Organization (FAO) has highlighted the role of plant-based diets in achieving global sustainability goals, which aligns with the growing consumer preference for tahini and other plant-based products.
Retail Penetration Via E-commerce and Gourmet Grocery Chains
Digital commerce platforms are significantly transforming the market for specialty tahini brands. By enabling direct-to-consumer relationships, these platforms eliminate the reliance on traditional retail gatekeepers, allowing brands to achieve higher profit margins on their premium products. At the same time, gourmet grocery chains are strategically positioning tahini within their curated specialty food sections. This approach not only enhances the brand's image but also supports premium pricing by associating tahini with high-quality artisanal and international products. Moreover, online platforms are providing smaller tahini producers with the opportunity to access national markets without requiring an extensive distribution network. This accessibility is driving increased brand diversity and fostering innovation within the tahini category. Additionally, the advanced data analytics capabilities of digital channels equip brands with valuable insights into consumer preferences.
Adoption of High-pressure Processing to Extend Shelf-life
The adoption of high-pressure processing (HPP) is emerging as a significant driver in the tahini market. HPP is a non-thermal food preservation method that uses high pressure to inactivate pathogens and spoilage microorganisms, thereby extending the shelf life of products without compromising their nutritional value or sensory qualities. This technology is particularly beneficial for tahini, as it helps maintain its natural flavor, texture, and nutritional profile while ensuring food safety. The growing consumer demand for clean-label and minimally processed foods has further fueled the adoption of HPP in the tahini market. Additionally, manufacturers are leveraging HPP to reduce the use of artificial preservatives, aligning with the increasing preference for healthier and more natural food products. As a result, the integration of high-pressure processing is expected to play a pivotal role in driving the growth of the tahini market during the forecast period.
Restraints Impact Analysis*
| Restraint | (~) % Impact on CAGR Forecast | Geographic Relevance | Impact Timeline |
|---|---|---|---|
| Competition from alternative seed and nut butters | -0.4% | Global, particularly North America and Europe | Medium term (2-4 years) |
| Price volatility of sesame seeds | -0.6% | Global, with acute impact on price-sensitive markets | Short term (≤ 2 years) |
| Allergen concerns related to sesame | -0.3% | North America and Europe regulatory markets | Long term (≥ 4 years) |
| Limited consumer awareness in non-Middle Eastern regions | -0.2% | Asia-Pacific and South America emerging markets | Long term (≥ 4 years) |
| Source: Mordor Intelligence | |||
Competition from Alternative Seed and Nut Butters
The tahini market faces significant restraint due to the growing competition from alternative seed and nut butters. Products such as almond butter, peanut butter, sunflower seed butter, and cashew butter are gaining popularity among consumers. These alternatives often offer similar nutritional benefits, such as high protein and healthy fat content, while catering to diverse taste preferences. Additionally, many of these products are marketed as allergen-free or suitable for specific dietary needs, such as gluten-free or vegan diets, further increasing their appeal. The rising availability of these alternatives in retail stores and online platforms has intensified competition, posing a challenge to the growth of the tahini market during the forecast period. Moreover, the aggressive marketing strategies adopted by manufacturers of alternative seed and nut butters have further heightened the competitive landscape. This growing competition from alternative seed and nut butters is expected to remain a significant challenge for the tahini market throughout the forecast period.
Price Volatility of Sesame Seeds
The price volatility of sesame seeds acts as a significant restraint in the tahini market. Sesame seed prices are highly susceptible to fluctuations due to various factors, including unpredictable weather conditions, geopolitical tensions, and supply chain disruptions. These factors can lead to inconsistent raw material costs, impacting tahini production and pricing strategies. Additionally, the dependency on specific regions for sesame seed cultivation further exacerbates the issue, as any adverse events in these areas can directly influence global supply and prices. Such volatility poses challenges for manufacturers in maintaining stable profit margins and meeting consumer demand effectively. Furthermore, the lack of alternative raw materials for tahini production increases the reliance on sesame seeds, intensifying the impact of price fluctuations. This unpredictability also affects long-term planning and investment decisions for market players, as they face difficulties in forecasting costs and revenues.
*Our forecasts treat driver/restraint impacts as directional, not additive. The impact forecasts reflect baseline growth, mix effects, and variable interactions.
Segment Analysis
By Flavor: Unflavored dominance drives authenticity
Traditional unflavored tahini dominated the tahini market, holding a significant 73.85% share in 2025. This reflects its widespread consumer trust and versatility as an ingredient that seamlessly transitions between savory and sweet applications. Restaurants, particularly those producing hummus at scale, heavily rely on unflavored tahini for its consistent quality, rich texture, and adaptability in large-scale food preparation. Additionally, home cooks value it as a pantry staple that enhances the flavor and texture of sauces, baked goods, and smoothies, making it an essential component in both professional and household kitchens.
Flavored tahini varieties, on the other hand, are gaining traction, recording a 4.34% CAGR and showing strong potential for growth. These variants are increasingly entering mainstream snack segments, driven by innovative offerings such as chocolate-tahini spreads, cinnamon-infused packs, and honey-based breakfast toppings. The growing demand for unique and diverse flavor profiles among consumers is expected to accelerate the adoption of flavored tahini, positioning it as a key player in the evolving snack and breakfast markets. Flavored tahini appeals to health-conscious consumers seeking indulgent yet nutritious options, and its versatility allows it to be incorporated into a variety of applications, including spreads, toppings, and even standalone snacks.


By Nature: Organic positioning captures health-conscious growth
In 2025, conventional SKUs continue to dominate the tahini market, accounting for a significant 86.78% of the market share. This dominance is attributed to their widespread availability across various distribution channels and their competitive pricing, which appeals to a broad consumer base. Conventional tahini products are often perceived as a cost-effective option, making them a preferred choice for both individual consumers and foodservice providers. Their established presence in the market ensures steady demand, supported by consistent supply chains and strong brand recognition among consumers.
On the other hand, organic tahini lines are emerging as a high-growth segment within the market. Although they currently hold a smaller share, organic tahini is projected to grow at an impressive 6.05% CAGR through 2031, outpacing the overall category's growth. This growth is driven by increasing consumer preference for healthier and sustainably sourced products, as well as rising awareness of organic certifications. Organic tahini appeals to health-conscious consumers and those seeking premium-quality products, often commanding higher price points. As a result, manufacturers are expanding their organic product portfolios to cater to this growing demand, further fueling the segment's expansion.
By Packaging: Convenience formats challenge traditional jars
Glass jars dominated the tahini market with a significant 48.12% revenue share in 2025. Their widespread adoption is attributed to their compatibility with existing shelf infrastructures, which simplifies storage and display for retailers. Additionally, glass jars are often perceived as premium packaging, effectively communicating authenticity and quality to consumers. This packaging format also aligns with the growing consumer preference for sustainable and recyclable materials, further solidifying its position in the market. Glass jars also provide excellent product visibility, allowing consumers to assess the quality and texture of tahini before purchase, which enhances trust and drives purchasing decisions.
On the other hand, squeeze bottles are emerging as a strong contender, projected to achieve a notable 5.12% CAGR through 2031. This growth is driven by the increasing demand for convenience among consumers who prioritize mess-free and precise application. Squeeze bottles cater to this need, making it easier to drizzle tahini onto toast, salads, and grilled vegetables without spills or waste. Their user-friendly design and portability make them particularly appealing to busy households and on-the-go consumers, contributing to their rising popularity in the tahini market. Furthermore, the controlled dispensing offered by squeeze bottles reduces product wastage, making them an economical choice for consumers.
By Distribution Channel: Digital transformation accelerates specialty access
Supermarkets and hypermarkets accounted for 52.30% of global retail sales in the tahini market in 2025. These channels have become the preferred choice for consumers due to their ability to cater to weekly grocery shopping needs while offering a wide range of products under one roof. Their extensive physical presence and accessibility allow them to reach a broad shopper base, making them a dominant distribution channel for tahini. Additionally, the convenience of in-store promotions, bulk purchase options, and the ability to physically inspect products further enhance their appeal to consumers seeking quality and value.
However, the online channel is rapidly gaining traction in the tahini market, growing at a 6.60% CAGR. This channel provides consumers with an extensive selection of tahini products, including niche and specialty options that may not be readily available in physical stores. Online platforms also offer detailed product information, such as the origin of the tahini, stone-grinding methods used in production, and pesticide testing results, which cater to the increasing demand for transparency and informed purchasing decisions. The convenience of home delivery, flexible payment options, and the ability to compare prices further contribute to the growing popularity of online channels among tahini consumers.
Geography Analysis
In 2025, the Middle East and Africa region commands a dominant 39.20% market share, bolstered by tahini's deep-rooted cultural significance in traditional cuisines and well-established supply chains linking sesame-producing nations to processing hubs. Lebanon, Syria, and Turkey not only stand out as primary consumers but also as key re-exporters. Here, traditional stone-grinding techniques are employed, ensuring authentic flavor profiles that fetch premium prices on the global stage. The region's growth remains unwavering despite facing political turbulence in pivotal markets, largely fueled by global diaspora communities championing authentic Middle Eastern tahini brands. These diaspora communities not only sustain export demand but also contribute to the global recognition of Middle Eastern tahini as a high-quality product.
Asia-Pacific is on a rapid ascent, projected to grow at a 4.01% CAGR through 2031. This surge is largely attributed to swift urbanization, a burgeoning middle class, and a heightened health consciousness among consumers gravitating towards premium, nutrient-rich food. Japan spearheads the regional trend, seamlessly weaving tahini into both traditional and avant-garde dishes, which has further popularized its use in fusion cuisines. Meanwhile, China's vast populace and rising disposable incomes hint at a promising market future, even if current per-capita consumption lags. The increasing awareness of tahini's nutritional benefits and its versatility in various recipes is expected to drive its adoption across the region.
North America and Europe, while mature markets, witness steady growth. This is fueled by health-savvy consumers, a rising appreciation for Middle Eastern cuisine, and a shift towards plant-based diets, with tahini emerging as a sought-after alternative to conventional nut butters. The FDA's classification of sesame as a major allergen presents a dual-edged sword: while it poses challenges, brands that navigate these regulations stand to capture a larger market share, leaving non-compliant counterparts under regulatory scrutiny. Additionally, the growing demand for allergen-free and clean-label products in these regions provides an opportunity for compliant brands to differentiate themselves and cater to niche consumer segments.


Competitive Landscape
The tahini market demonstrates moderate fragmentation, with a concentration index of 4 out of 10. This level of fragmentation indicates substantial opportunities for both established players and new entrants to gain market share by employing differentiation strategies and expanding their geographic presence. The market's competitive landscape is shaped by a mix of traditional and modern players, each leveraging unique strengths to appeal to diverse consumer preferences. The evolving nature of the market creates a dynamic environment where companies can explore various strategic approaches to establish and strengthen their foothold.
Traditional Middle Eastern producers, such as Haitoglou Bros SA and Al Wadi Al Akhdar SAL, maintain a strong presence by emphasizing authentic positioning and leveraging well-established distribution networks. These companies benefit from their heritage and expertise in producing high-quality tahini, which resonates with consumers seeking traditional and authentic products. Their ability to maintain consistency in quality and authenticity has allowed them to retain a loyal customer base while also exploring opportunities to expand into new markets.
On the other hand, North American brands like Soom Foods and Mighty Sesame Co. focus on premium positioning and innovative marketing strategies to attract health-conscious consumers. These brands emphasize the nutritional benefits of tahini and incorporate modern convenience into their product offerings, such as squeezable packaging and organic certifications. By aligning their products with current health and wellness trends, these companies are successfully carving out a niche in the market. The competitive dynamics of the tahini market reflect a balance between traditional authenticity and modern convenience, providing multiple pathways for market participants to achieve growth and differentiation.
Tahini Industry Leaders
-
Haitoglou Bros SA
-
Halwani Bros Co. Ltd
-
Prince Tahini Ltd
-
Al Wadi Al Akhdar SAL
-
Sunshine International Foods Inc.
- *Disclaimer: Major Players sorted in no particular order

Recent Industry Developments
- June 2025: Merter Gida Ltd. Sti., announced the launch of its latest innovation: a Hazelnut Spread with Cocoa and Tahini Honey Mixture - a delicious, all-natural product crafted with only four premium ingredients. The spread combines the rich flavor of hazelnuts and cocoa with the nourishing qualities of tahini and natural honey, offering a wholesome alternative to conventional spreads.
- August 2023: Seed + Mill, a US-based company specializing in halva and tahini, has unveiled its latest product: an organic spicy tahini, now conveniently packaged in a squeeze bottle. Crafted from hulled and roasted sesame seeds, Seed + Mill's organic spicy tahini is infused with red hot chili, sweet paprika, and paprika extract. This new offering is not only non-GMO and gluten-free but also caters to vegan and kosher diets.


Global Tahini Market Report Scope
Tahini is a condiment made from toasted ground hulled sesame seeds, oil, and sometimes salt, particularly famous in the Middle East. The global tahini market is segmented by geography into North America, Europe, Asia-Pacific, South America, and Middle East and Africa. For each segment, the market sizing and forecasts have been done based on value (in USD million).
| Flavored |
| Unflavored |
| Conventional |
| Organic |
| Jars |
| Squeeze Bottles |
| Sachets and Pouches |
| Supermarkets and Hypermarkets |
| Convenience Stores |
| Specialty and Gourmet Stores |
| Online Retail |
| Others |
| North America | United States |
| Canada | |
| Mexico | |
| Rest of North America | |
| Europe | United Kingdom |
| Germany | |
| Spain | |
| France | |
| Italy | |
| Netherlands | |
| Sweden | |
| Poland | |
| Belgium | |
| Rest of Europe | |
| Asia-Pacific | China |
| Japan | |
| India | |
| South Korea | |
| Australia | |
| Thailand | |
| Indonesia | |
| Singapore | |
| Rest of Asia-Pacific | |
| South America | Brazil |
| Argentina | |
| Chile | |
| Peru | |
| Columbia | |
| Rest of South America | |
| Middle East and Africa | Saudi Arabia |
| United Arab Emirates | |
| South Africa | |
| Nigeria' | |
| Egypt | |
| Morocco | |
| Turkey | |
| Rest of Middle East and Africa |
| By Flavor | Flavored | |
| Unflavored | ||
| By Nature | Conventional | |
| Organic | ||
| By Packaging | Jars | |
| Squeeze Bottles | ||
| Sachets and Pouches | ||
| By Distribution Channel | Supermarkets and Hypermarkets | |
| Convenience Stores | ||
| Specialty and Gourmet Stores | ||
| Online Retail | ||
| Others | ||
| By Geography | North America | United States |
| Canada | ||
| Mexico | ||
| Rest of North America | ||
| Europe | United Kingdom | |
| Germany | ||
| Spain | ||
| France | ||
| Italy | ||
| Netherlands | ||
| Sweden | ||
| Poland | ||
| Belgium | ||
| Rest of Europe | ||
| Asia-Pacific | China | |
| Japan | ||
| India | ||
| South Korea | ||
| Australia | ||
| Thailand | ||
| Indonesia | ||
| Singapore | ||
| Rest of Asia-Pacific | ||
| South America | Brazil | |
| Argentina | ||
| Chile | ||
| Peru | ||
| Columbia | ||
| Rest of South America | ||
| Middle East and Africa | Saudi Arabia | |
| United Arab Emirates | ||
| South Africa | ||
| Nigeria' | ||
| Egypt | ||
| Morocco | ||
| Turkey | ||
| Rest of Middle East and Africa | ||


Key Questions Answered in the Report
What is the current size of the tahini market?
The tahini market is valued at USD 453.65 million in 2026 and is projected to reach USD 541.96 million by 2031.
Which region leads the tahini market?
The Middle East and Africa region leads with 39.20% revenue share because tahini is deeply embedded in local cuisines.
Which distribution channel is growing the fastest?
Online retail posts the highest growth, expanding at a 6.60% CAGR as consumers shift grocery purchases to digital platforms.
Why are squeeze bottles gaining popularity?
Squeeze bottles align with consumer demand for convenient, mess-free application and support portion control, leading to a 5.12% forecast CAGR.
Page last updated on:


