
Dairy Cream Market Size and Share
Market Overview
| Study Period | 2021 - 2031 |
|---|---|
| Market Size (2026) | USD 11.37 Billion |
| Market Size (2031) | USD 13.67 Billion |
| Growth Rate (2026 - 2031) | 3.76 % |
| Fastest Growing Market | Asia Pacific |
| Largest Market | Europe |
| Market Concentration | Medium |
Major Players
*Disclaimer: Major Players sorted in no particular order Image © Mordor Intelligence. Reuse requires attribution under CC BY 4.0. |
|
Dairy Cream Market Analysis by Mordor Intelligence
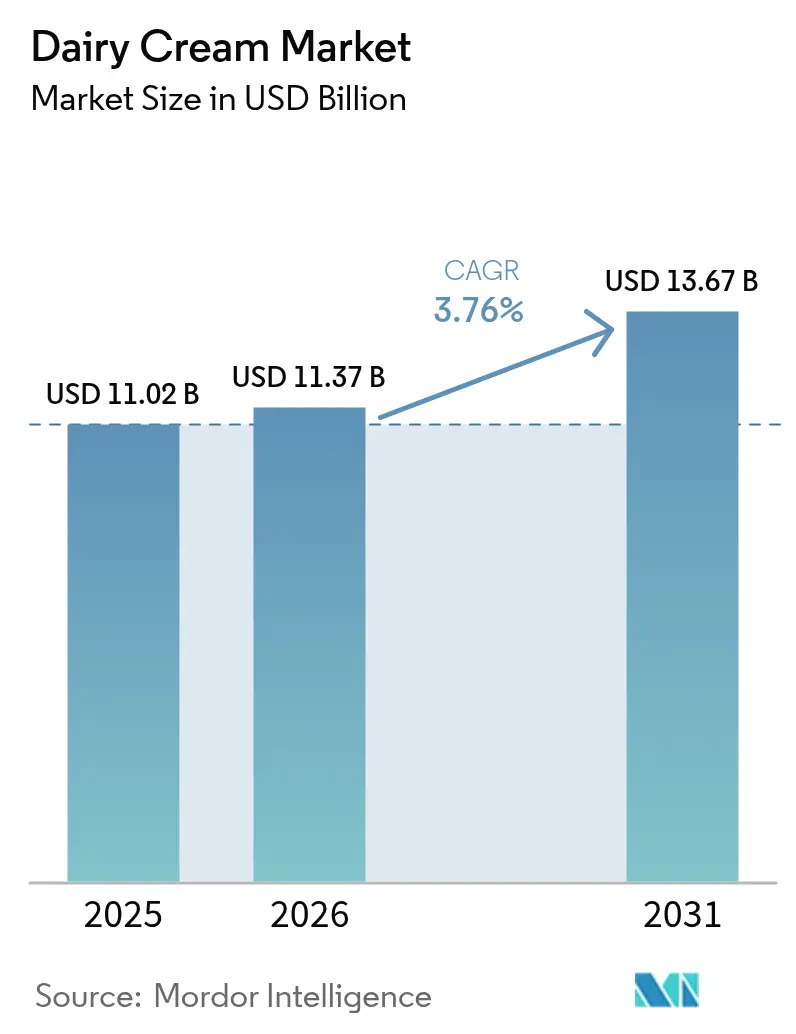
The dairy cream market size was valued at USD 11.02 billion in 2025, increased to USD 11.37 billion in 2026, and is projected to reach USD 13.67 billion by 2031, growing at a compound annual growth rate (CAGR) of 3.76% during the forecast period. This steady growth is primarily driven by the rising demand for premium, natural, and versatile dairy ingredients that enhance texture, flavor, and sensory appeal in food and beverages. The increasing consumption of convenience foods, the expansion of the foodservice and café culture, and a growing preference for indulgent culinary experiences are key factors supporting cream utilization across various end-use applications. Additionally, sustainability initiatives, clean-label trends, and animal welfare considerations are influencing purchasing behavior, prompting manufacturers to develop ethically sourced and environmentally responsible products.
Key Report Takeaways
- By product type, Fresh Cream led with 38.92% of the dairy cream market share in 2025, while Whipping Cream is forecast to expand at a 6.63% CAGR to 2031, buoyed by bakery and café uptake.
- By packaging, Cartons accounted for 43.23% of 2025 sales, whereas Glass Jars show the fastest projected growth at 6.54% through 2031 as premium brands chase circular-economy mandates.
- By distribution channel, Off-Trade represented 72.32% of value in 2025; however, On-Trade is set to rise at 5.81% annually with hotels and restaurants rebuilding post-pandemic menus.
- By geography, Europe held 32.11% of the value in 2025, but Asia-Pacific is projected to grow quickest at 7.12% a year on the back of China’s self-sufficiency push and India’s cooperative distribution strength.
Note: Market size and forecast figures in this report are generated using Mordor Intelligence’s proprietary estimation framework, updated with the latest available data and insights as of 2026.
Global Dairy Cream Market Trends and Insights
Drivers Impact Analysis*
| Driver | (~) % Impact on CAGR Forecast | Geographic Relevance | Impact Timeline |
|---|---|---|---|
| Rising demand for convenience foods | +0.8% | Global, with concentration in North America, Western Europe, and urban Asia-Pacific | Medium term (2-4 years) |
| Sustainability and animal welfare initiatives | +0.5% | Europe and North America core, expanding to Australia and New Zealand | Long term (≥ 4 years) |
| Innovation in product formulations | +0.7% | Global, led by Europe and North America; spillover to Asia-Pacific premium segments | Long term (≥ 4 years) |
| Growth of foodservice and cafe culture | +0.8% | Asia-Pacific core, expanding in Middle East and South America urban centers | Medium term (2-4 years) |
| Technological advancements in cream processing | +0.6% | Global, with early adoption in Europe, North America, and developed Asia-Pacific markets | Medium term (2-4 years) |
| Premiumization of dairy products | +0.6% | Europe, North America, and affluent Asia-Pacific metros (Shanghai, Tokyo, Singapore) | Long term (≥ 4 years) |
| Source: Mordor Intelligence | |||
Rising demand for convenience foods
The increasing demand for convenience foods is driving growth in the global dairy cream market, as consumers prioritize time-efficient meal solutions without sacrificing taste or quality. Factors such as fast-paced urban lifestyles, dual-income households, and changing dietary preferences have boosted the consumption of ready-to-eat (RTE), ready-to-cook (RTC), and packaged meal options, which often utilize dairy cream for its ability to enhance texture, richness, and flavor stability. Dairy cream serves a vital functional role in processed food formulations by improving mouthfeel, emulsification, and consistency, making it a key ingredient in the development of convenience-focused products. Furthermore, the growth of chilled and frozen food categories, along with advancements in UHT and long-shelf-life cream processing technologies, has allowed manufacturers to incorporate cream into packaged foods while ensuring product safety and stability. Food producers are increasingly using cream in sauces, meal kits, instant mixes, and dessert bases to enhance sensory appeal and provide indulgent eating experiences in convenient formats.
Sustainability and animal welfare initiatives
Sustainability and animal welfare initiatives are becoming significant growth drivers in the global dairy cream market, influencing both consumer purchasing patterns and corporate strategies. Growing awareness of environmental concerns, including carbon emissions, water usage, and livestock treatment, has led consumers to prefer dairy products that adhere to responsible sourcing and ethical production practices. In response, dairy cream manufacturers are adopting regenerative agriculture methods, methane-reduction technologies, improved feed efficiency, and certified humane farming systems to enhance supply chain transparency and minimize environmental impact. Certifications such as organic, grass-fed, pasture-raised, and animal-welfare-approved labels are gaining importance, enabling brands to differentiate their cream products and support premium pricing strategies. Additionally, companies are incorporating sustainability commitments into packaging innovations by using recyclable cartons, reduced-plastic formats, and lower-emission processing technologies.
Innovation in Product Formulations
Innovation in product formulations remains a significant driver in the global dairy cream market, as manufacturers respond to evolving consumer expectations regarding quality, ethics, and functionality. Companies are increasingly launching differentiated cream variants to meet demands for better taste, enhanced performance, adherence to animal welfare standards, and clean-label attributes. Reformulation efforts focus on fat optimization, improved whipping stability, heat resistance, and extended shelf life, while incorporating ethical sourcing and sustainability claims to enhance brand appeal. For example, in August 2024, Waitrose introduced ‘free-range’ cream across its own-label range, including single, double, whipping, and extra thick cream. This initiative highlights the growing importance of animal welfare and transparent sourcing practices, which are becoming key factors influencing consumer purchasing decisions. Such innovations not only foster differentiation in a moderately concentrated market but also enable brands to achieve premium positioning and build stronger consumer loyalty.
Growth of foodservice and cafe Culture
The global dairy cream market is driven by the rapid expansion of foodservice outlets, specialty cafés, bakeries, and hospitality chains. Professional kitchens increasingly depend on high-performance cream products to enhance menu quality and maintain consistency. The growing popularity of café culture, premium dessert chains, and experiential dining concepts has further boosted the demand for cream with superior whipping stability, smooth texture, and visual appeal. As consumers dine out more frequently and seek indulgent, visually appealing food and beverages, foodservice operators are emphasizing the use of premium dairy ingredients that perform reliably under high-volume operations. For example, in October 2024, at FHA HoReca 2024, Anchor Food Professionals introduced the Infiniti Whipping Cream, designed to meet the evolving performance requirements of professional chefs and pâtissiers. Such product launches demonstrate how manufacturers are innovating to address foodservice needs, focusing on improved aeration, stability, and operational efficiency.
Restraints Impact Analysis*
| Restraint | (~) % Impact on CAGR Forecast | Geographic Relevance | Impact Timeline |
|---|---|---|---|
| Rising competition from plant-based cream alternatives | -0.5% | North America, Western Europe, and urban Asia-Pacific (Australia, Japan, South Korea) | Medium term (2-4 years) |
| Short shelf life of fresh dairy cream | -0.4% | Global, with acute impact in regions lacking cold-chain infrastructure (Sub-Saharan Africa, South Asia, Southeast Asia) | Short term (≤ 2 years) |
| Volatility in raw milk quality and supply | -0.3% | Global, with seasonal peaks in temperate regions (Europe, North America, Southern South America) | Short term (≤ 2 years) |
| Stringent food safety and quality regulations | -0.2% | Global, with highest compliance costs in Europe, North America, and developed Asia-Pacific markets | Long term (≥ 4 years) |
| Source: Mordor Intelligence | |||
Rising competition from plant-based cream alternatives
The growing competition from plant-based cream alternatives is a notable restraint on the dairy cream market, driven by shifting consumer preferences toward vegan, lactose-free, and environmentally perceived lower-impact options. Plant-based creams made from oat, almond, soy, coconut, and other botanical sources are achieving significant retail penetration. These products offer comparable texture and whipping functionality while appealing to flexitarian and dairy-averse consumers. Additionally, they are often promoted with claims of lower saturated fat content, sustainability, and ethical sourcing, which strongly attract younger and health-conscious demographics. For example, the Good Food Institute (GFI) reported that consumers in the United Kingdom purchased an average of 9.1 million plant-based products per week from major supermarkets during the early part of 2024 [1]Source: Good Food Institute (GFI), "Plant-based meat and milk are now mainstream choices for British consumers", gfieurope.org. This increasing adoption underscores a structural shift toward alternative dairy solutions, heightening competitive pressure on traditional cream manufacturers.
Short shelf life of fresh dairy cream
The short shelf life of fresh dairy cream poses a significant challenge in the global dairy cream market, as it necessitates stringent storage, transportation, and inventory management throughout the supply chain. Due to its high moisture and fat content, fresh cream is highly perishable and prone to microbial growth, spoilage, and quality deterioration if not consistently refrigerated. This reliance on an uninterrupted cold chain increases logistical complexity and operational costs for manufacturers, distributors, and retailers. Temperature fluctuations during storage or transit can result in product spoilage, financial losses, and reputational damage for brands. Additionally, the limited shelf life hinders geographic expansion into regions lacking developed refrigeration infrastructure, thereby restricting market penetration. Retailers must carefully manage stock rotation to minimize waste, which can reduce profit margins and limit opportunities for promotional activities.
*Our forecasts treat driver/restraint impacts as directional, not additive. The impact forecasts reflect baseline growth, mix effects, and variable interactions.
Segment Analysis
By Product Type: Fresh Cream Dominance Masks Whipping Cream Surge
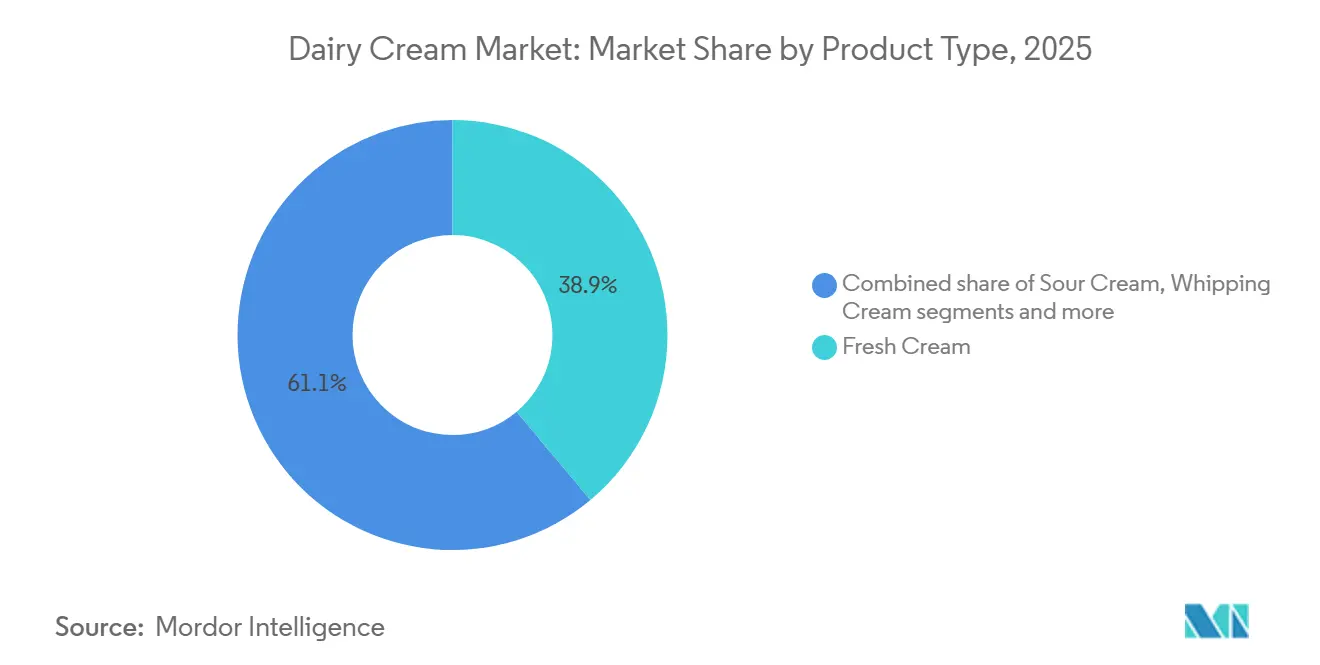
Fresh cream accounted for 38.92% of the dairy cream market in 2025, emerging as the leading product type due to strong consumer preference, its natural positioning, and superior functional performance. Its dominance is largely attributed to its perception as an authentic, minimally processed dairy product that aligns with clean-label and premium food trends. Consumers increasingly associate fresh cream with higher quality, richer taste, and better texture compared to processed or non-dairy alternatives, driving repeat purchases and fostering brand loyalty. Furthermore, advancements in pasteurization, packaging, and refrigerated distribution have improved product stability and availability across both developed and emerging markets, enhancing its market penetration.
Whipping cream is projected to grow at a CAGR of 6.63% through 2031, making it the fastest-growing segment within the dairy cream market. This growth is primarily driven by increasing demand for premium dairy ingredients that provide superior aeration, volume stability, and texture enhancement. Whipping cream offers functional benefits such as high overrun capacity, stable foam formation, and consistent structural performance, making it highly preferred in both professional and retail applications. Additionally, the growing consumer preference for visually appealing and indulgent food experiences is boosting its demand, as whipping cream enhances product aesthetics and sensory appeal.



By Packaging Type: Carton Efficiency Versus Glass Premiumization
Cartons accounted for 43.23% of the dairy cream packaging market share in 2025, establishing themselves as the leading packaging format. This dominance is attributed to their effective balance of product protection, convenience, and cost efficiency. Their widespread adoption is driven by their ability to preserve freshness and extend shelf life through advanced aseptic and multilayer barrier technologies, which are essential for maintaining cream quality. Cartons are lightweight, easy to store, and stackable, making them efficient for transportation and retail shelf management, thereby reducing handling complexities across supply chains. Additionally, cartons facilitate clear labeling, enhance branding visibility, and offer portion-controlled formats, improving consumer convenience and product differentiation. Sustainability considerations further bolster their position, as paper-based carton materials are increasingly viewed as more environmentally responsible compared to rigid plastic alternatives.
Glass jars are projected to grow at a CAGR of 6.54% through 2031, primarily driven by the rising premiumization trends within the dairy cream market. Glass packaging is widely regarded as a high-end, traditional, and purity-preserving format, enhancing product positioning in premium and artisanal segments. Consumers increasingly associate glass jars with superior quality, freshness retention, and minimal chemical interaction, which reinforces trust and brand credibility. This perception aligns closely with the clean-label movement and the demand for minimally processed, authentic dairy products. Glass provides excellent barrier properties, protecting cream from moisture, oxygen, and external contaminants without compromising taste or texture. Its reusability and recyclability further enhance its appeal among environmentally conscious consumers, supporting sustainability-focused purchasing decisions.
By Distribution Channel: Off-Trade Maturity Versus On-Trade Recovery
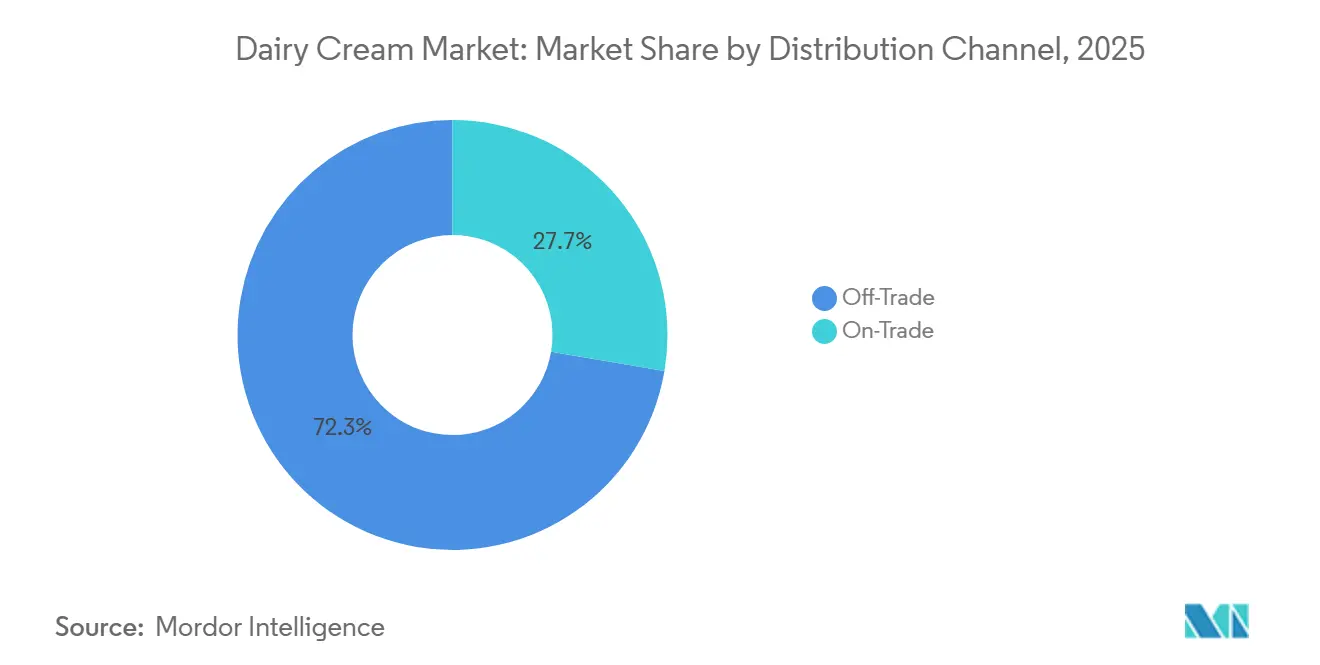
Off-trade channels accounted for 72.32% of the global dairy cream distribution share in 2025, maintaining their leading position due to extensive retail reach, product accessibility, and frequent consumer purchases. Supermarkets, hypermarkets, convenience stores, and online grocery platforms collectively ensure widespread availability of dairy cream products, providing consistent access for consumers in urban and semi-urban areas. The structured retail environment supports proper refrigeration and cold-chain management, which are critical for maintaining product quality and shelf life, thereby fostering consumer trust. Off-trade channels also enhance brand visibility, facilitate promotional campaigns, and offer diversified packaging formats catering to both household and bulk purchasers. The growth of organized retail networks and e-commerce grocery platforms has further strengthened this segment by offering convenience, doorstep delivery, and subscription-based purchasing options.
The on-trade segment is projected to grow at a CAGR of 5.81% through 2031, driven by the steady increase in food-away-from-home consumption and the recovery of the hospitality and foodservice industries globally. Restaurants, cafés, hotels, bakeries, and quick-service outlets are incorporating dairy cream into premium menu offerings, reflecting growing demand for indulgent and high-quality dining experiences. According to the United States Department of Agriculture (USDA), per capita food-away-from-home (FAFH) purchases reached a record high of USD 4,275 in 2024, underscoring the structural shift toward dining and beverage consumption outside the home [2]Source: United States Department of Agriculture (USDA), "Food Service Industry", usda.gov. This trend directly supports dairy cream demand within on-trade establishments, as cream-based ingredients enhance menu differentiation, product richness, and presentation appeal. Additionally, the rapid expansion of specialty cafés, dessert chains, and premium beverage outlets has increased institutional procurement of whipping and fresh cream in bulk formats.
Geography Analysis
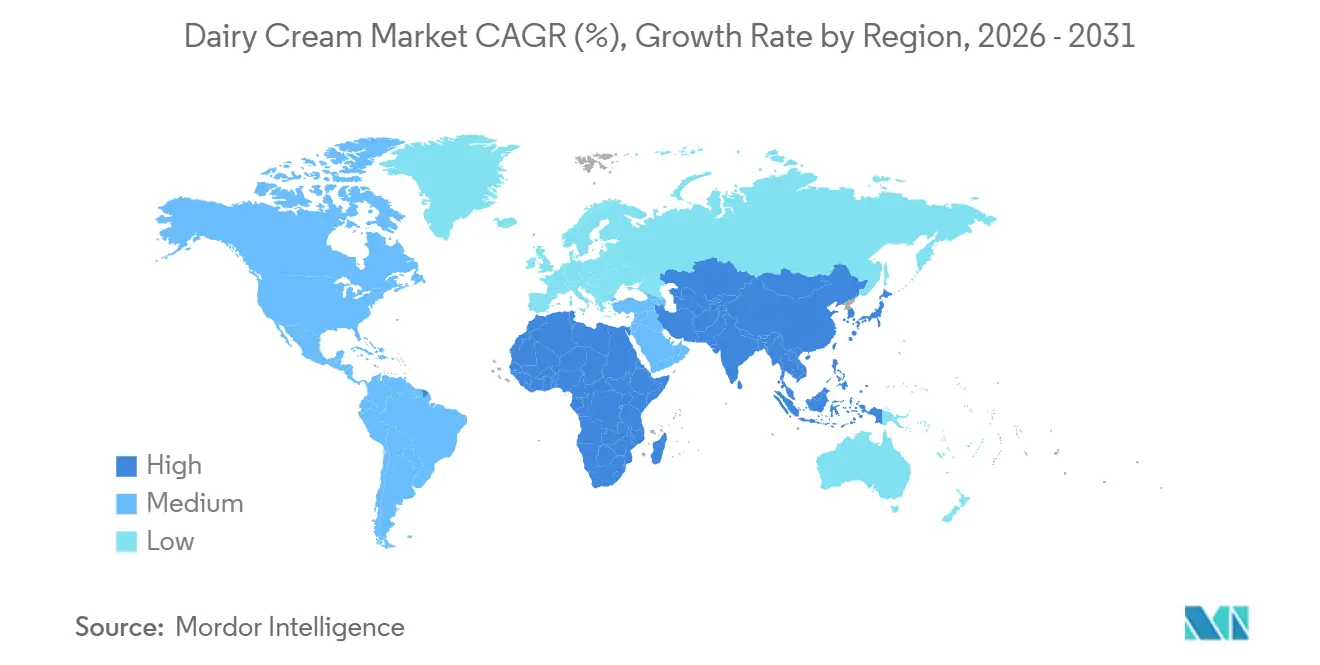
Europe is projected to retain 32.11% of the global dairy cream market share in 2025, maintaining its leadership position due to its well-established dairy infrastructure, strong milk production base, and deep-rooted dairy consumption culture. The region's dominance is primarily driven by Germany, which, according to the German Federal Statistical Office, produced approximately 32.1 million tons of cow’s milk in 2024, making it the largest milk producer in Europe [3]Source: German Federal Statistical Office, "Germany largest EU milk producer" destatis.de. This substantial raw milk availability ensures stable cream extraction capacity and supports large-scale processing operations. Additionally, key markets such as the United Kingdom, France, Italy, and Spain significantly contribute to regional demand, supported by strong culinary traditions, advanced dairy processing technologies, and premium dairy product consumption patterns.
Asia-Pacific is forecast to grow at a CAGR of 7.12% through 2031, emerging as the fastest-growing regional market. The region's growth is driven by the rapid modernization of dairy supply chains, increasing cold-chain penetration, and the rising adoption of Western-style bakery and café culture. Expanding organized retail networks and improvements in domestic milk processing capacities are further enhancing market accessibility. Additionally, the growing middle-class population, increasing disposable incomes, and changing dietary preferences are fueling demand for dairy cream products. Innovation in Ultra-High Temperature (UHT) and long-shelf-life cream products has enabled broader distribution across diverse climatic conditions, ensuring product availability in remote areas and further accelerating the region's growth momentum.
North America, South America, and the Middle East & Africa collectively account for the remaining share of global dairy cream demand, each driven by distinct structural factors. North America benefits from advanced dairy technology, strong foodservice integration, and stable milk production systems. The region also sees increasing demand for specialty cream products driven by evolving consumer preferences and the growth of the premium food segment. South America leverages its expanding dairy farming sector and growing processing capabilities to strengthen regional supply. Rising investments in modern dairy infrastructure and government initiatives to support the dairy industry are further boosting the market. Meanwhile, the Middle East and Africa region is experiencing gradual growth, supported by improving cold-chain infrastructure, the expansion of the hospitality sector, and increasing reliance on imported and locally processed dairy cream products.

Regulatory Landscape
Regulatory landscape for dairy cream centers on safety, identity standards, and import controls that vary by market but converge on hygiene and traceability. In the United States, standards of identity are defined in 21 CFR Part 131 for heavy cream (minimum 36% milkfat) and light cream (18% to 30% milkfat). The FDA signaled modernization in July 2025 to revoke 18 dairy standards of identity, while FSMA traceability rules reinforce documentation and audit-ready cold-chain practices for cream in retail and foodservice channels.
Internationally, CODEX STAN 288-1976 remains a reference framework for cream definitions and permitted additives. Canada administers dairy access under the Export and Import Permits Act with defined quotas for 2026-2027, and the US CBP continues to implement Dairy Tariff-Rate Quotas with updates in March 2026. The European Commission's December 2025 Food and Feed Safety Simplification Package likewise signals regulatory streamlining, alongside US FDA 2026 transparency priorities, collectively nudging manufacturers toward enhanced labeling, documentation, and compliance alignment.
Competitive Landscape
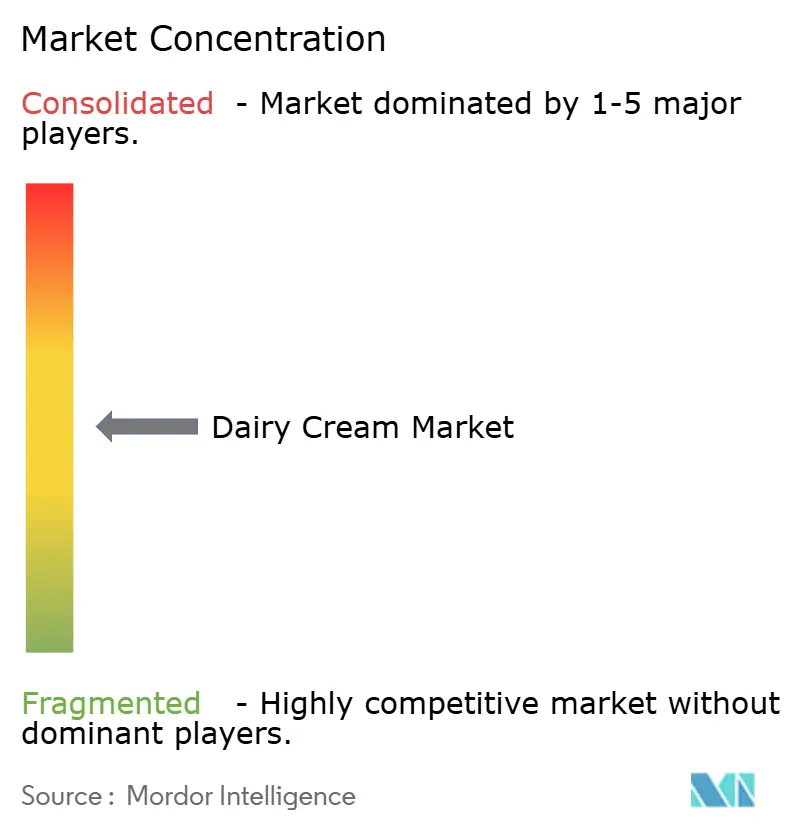
The global dairy cream market is moderately concentrated, featuring a combination of multinational dairy corporations and prominent regional cooperatives competing across retail and foodservice channels. Key players in the market include Groupe Lactalis S.A., Danone S.A., Nestlé S.A., Arla Foods amba, and Dairy Farmers of America Inc. These companies utilize vertically integrated supply chains, extensive milk procurement networks, and robust brand portfolios to sustain their competitive edge. Their global reach, advanced processing capabilities, and diverse product ranges enable them to serve both premium and mass-market segments, contributing to market stability while maintaining competitive dynamics.
Strategic differentiation in the dairy cream market increasingly focuses on product innovation and format diversification. Leading companies are introducing ambient-stable and UHT cream formats to expand into regions with limited cold-chain infrastructure, thereby broadening their distribution networks. Additionally, there is a rising focus on organic, grass-fed, and regenerative-agriculture-certified cream products aimed at affluent and environmentally conscious consumers. Hybrid dairy-plant formulations are also gaining traction, allowing manufacturers to cater to flexitarian consumers seeking reduced dairy content while preserving functional performance and sensory quality. These innovations are reshaping competitive strategies and enabling companies to address shifting consumer preferences effectively.
Sustainability and technological advancements remain integral to competitive strategies in the market. Leading players are prioritizing initiatives such as reducing carbon footprints, mitigating methane emissions in dairy farming, adopting recyclable and low-impact packaging, and implementing traceable sourcing systems to enhance brand credibility. Furthermore, the digitalization of supply chains, automation in cream separation and fat standardization processes, and the use of AI-driven quality monitoring systems are improving operational efficiency and ensuring product consistency.
Dairy Cream Industry Leaders
-
Groupe Lactalis S.A.
-
Danone S.A.
-
Nestlé S.A.
-
Arla Foods amba
-
Dairy Farmers of America Inc.
- *Disclaimer: Major Players sorted in no particular order

Market Opportunities and Future Outlook
Shelf-life extension and cold-chain resilience open whitespace for cream distribution beyond mature cold-chain corridors. A June 2026 Technical Readiness Level 8 update by Arbok International describes vacuum-based pasteurization enabling high microbial reduction at 7 to 20 C, supporting decentralized processing. On-farm pulsed electric field intervention models being studied in 2026 propose potential to reduce logistics dependency. Membrane filtration technologies, including ultrafiltration, nanofiltration, and reverse osmosis, are being explored to recover side streams and standardize dairy fractions, enabling targeted cream formats such as professional whipping creams and reduced-fat variants.
Policy and market structure anchors exist, with the European Commission's December 2025 Food and Feed Safety Simplification Package and US FDA 2026 transparency priorities highlighting a shift toward reformulation, labeling upgrades, and documentation-driven differentiation across retail and foodservice channels. Together with an off-trade share of 72.32 percent in 2025 and record US food-away-from-home purchases in 2024, these signals create opportunities to balance premium performance, cleaner labels, and more resilient logistics through cream-based portfolios.
Recent Industry Developments
- April 2026: Groupe Lactalis completed the acquisition of Fonterra's consumer business, expanding its footprint across Oceania, South and Southeast Asia, and the Middle East to 50 production sites. The deal strengthens scale and route-to-market for cream and adjacent dairy categories in multiple high-consumption regions.
- March 2026: Danone announced a strategic joint venture in Argentina with Arcor, integrating operations across eleven plants, supporting broader manufacturing and distribution capabilities for value-added dairy lines that include creams.
- December 2024: Fonterra introduced Anchor Easy Bakery Cream at the China International Import Expo (CIIE) in Shanghai, made with 100% New Zealand dairy. The launch targets professional bakery use cases and reinforces product specialization for performance attributes, supporting premiumization and foodservice-focused differentiation in a key Asia-Pacific market.


Research Methodology Framework and Report Scope
Market Definition and Coverage
For this study, the market covers dairy-based cream sold for household use and commercial food use, measured in value at the prices realized across key sales channels and packaging formats. The coverage is global, and it includes common dairy cream types used for cooking, whipping, and as ingredients.
Scope exclusions: Non-dairy creamers and plant-based cream alternatives are excluded from this market size.
Segmentation Overview
-
By Product Type
- Fresh Cream
- Thickened Cream/Heavy Cream
- Whipping Cream
- Sour Cream
- Other Cream Types
-
By Packaging Type
- Cartons
- Plastic Tubs
- Glass Jars
- Others
-
By Distribution Channel
- On-Trade
-
Off-Trade
- Supermarkets/Hypermarkets
- Convenience Stores
- Online Retail Stores
- Other Distribution Channels
-
By Geography
-
North America
- United States
- Canada
- Mexico
- Rest of North America
-
Europe
- Germany
- United Kingdom
- Italy
- France
- Spain
- Netherlands
- Poland
- Belgium
- Sweden
- Rest of Europe
-
Asia-Pacific
- China
- India
- Japan
- Australia
- Indonesia
- South Korea
- Thailand
- Singapore
- Rest of Asia-Pacific
-
South America
- Brazil
- Argentina
- Colombia
- Chile
- Peru
- Rest of South America
-
Middle East and Africa
- South Africa
- Saudi Arabia
- United Arab Emirates
- Nigeria
- Egypt
- Morocco
- Turkey
- Rest of Middle East and Africa
-
North America
Data Sources, Market Sizing, and Validation
Desk Research
Desk research was used to build the starting model structure and to check whether the assumptions track real-world dairy supply and demand signals. We leaned on public sources such as FAOSTAT for dairy production indicators, USDA and EU Commission agriculture dashboards for milk and dairy category context, national statistics offices for household food spending direction, and UN Comtrade for trade flows, where cream-related dairy lines help explain availability.
To connect market value to pricing and packaging reality, we also reviewed company filings and investor presentations for dairy portfolios and route-to-market signals, alongside trade association updates and reputable press on changes in regulations, labeling, and cold-chain expansion. In a few cases, paid subscriptions were used for company financial intelligence, patent lookups, and shipment-level trade views to confirm directionally what we saw in public datasets. These sources are illustrative only, and many other references were used to collect, validate, and clarify the final analysis.
Primary Interviews and Surveys
Primary work focused on checking how cream demand is actually formed across retail and foodservice, and on confirming which product definitions are used in different regions. We spoke with a mix of dairy processors, distributors, foodservice buyers, and category specialists across major regions, so gaps from desk research could be filled, and key assumptions (such as pricing progression and channel mix) could be stress-tested before finalization.
Distribution of primary research fieldwork respondents
| Company type | Respondent position | Region |
|---|---|---|
| Top tier: 29% | CXOs: 14% | APAC: 47% |
| Mid tier: 57% | Functional/Unit leaders: 26% | EMEA: 34% |
| Smaller Players: 14% | Managers: 60% | Americas: 19% |
Market-Sizing & Forecasting
Sizing starts from a top-down build where dairy production and trade indicators are used to reconstruct the regional cream availability pool, then filtered through channel presence (on-trade versus off-trade) and a typical product mix to arrive at value. Once the demand pool is shaped, it is converted into market value using a pricing structure that reflects packaging formats and the expected premium for higher fat and specialty cream types.
To keep totals realistic, we corroborate with selective bottom-up approximations, such as supplier revenue sanity checks, sampled price points by channel, and volume-to-value cross-checks where credible packaging and distribution shares are available. Inputs that typically matter include raw milk availability and seasonality, foodservice demand direction (especially bakery, beverages, and cooking), retail penetration of chilled dairy, average realized prices by cream type, and shifts toward premium and clean-label cream. For forecasting, scenario analysis was used so the base path reflects what industry participants expect for milk supply tightness, cost pass-through, and channel recovery, and then upside and downside cases test how quickly pricing and the consumption mix could move.
Data Validation & Update Cycle
Outputs are checked against independent signals, such as regional dairy production trends, trade movement direction, and whether the implied per-capita usage looks reasonable for cream-heavy consumption markets. When a region or year shows a sharp jump, the drivers are re-tested, and interview follow-ups are triggered to confirm whether it is a real shift (for example, foodservice reopening effects or price inflation) or a modeling artifact.
Before sign-off, the model goes through multi-step analyst review, including variance checks on pricing, volume direction, and channel weights, and then a final consistency scan across all regions. Reports are refreshed annually, and interim updates are made when material events alter milk supply, trade access, or price setting. Right before delivery, a last pass is completed so clients receive the most current view available at that time.
Mordor Intelligence's Dairy Cream Market Size Versus Other Published Estimates
Published market values for dairy cream often do not match, even when the headline label looks similar, because the underlying inclusions and pricing logic can change from one estimate to the next. Differences usually come from what is treated as cream versus adjacent categories, which sales channels are counted, and whether the estimate is built from a realistic demand pool or from broader dairy spending proxies.
Non-dairy creamers and plant-based cream alternatives sit outside Mordor Intelligence's scope, and that single exclusion can create a large spread when other estimates blend dairy and non-dairy under one cream umbrella. Gaps also show up when a source uses aggressive price escalation, applies currency conversion timing that amplifies inflation years, or does not reconcile the final number with observable signals like dairy output, trade direction, and channel mix changes.
Benchmark comparison
| Source | Market Size | Gaps in Research Methodology |
|---|---|---|
| Mordor Intelligence | USD 11.37 B (2026) | |
| Industry Publisher A | USD 30.12 B (2024) | Uses a broader framing that can implicitly pull in adjacent cream and ingredient spending, and the value level suggests higher average price assumptions that are not clearly tied back to channel mix or dairy supply constraints. |
| Data Aggregator B | USD 16.71 B (2024) | Often compiles manufacturer-side production and revenue views, which can count a wider set of cream-related products and may not consistently align the same cream-type definitions and retail versus foodservice splits across regions. |
Taken together, the spread is mainly explained by scope overlap with adjacent categories and by how pricing is carried forward across years. By keeping the scope tied to dairy cream only and by cross-checking the implied value against production, trade, and channel signals, the final number stays traceable to clear steps that can be repeated when market conditions change.


Key Questions Answered in the Report
How big will the dairy cream market be by 2031?
It is projected to reach USD 13.67 billion by 2031, growing at a 3.76% CAGR from 2026.
Which product type is growing quickest?
Whipping Cream is forecast to expand at 6.63% annually through 2031 as artisanal bakeries and cafés scale in Asia and the Middle East.
Why are glass jars gaining share?
Premium brands adopt glass to signal quality and comply with European deposit-return mandates, driving a 6.54% CAGR for the format.
Which region offers the fastest growth?
Asia-Pacific leads with a projected 7.12% CAGR as China ramps up self-sufficient UHT cream output and India expands cooperative distribution.
Page last updated on:


 Your data is secure and never sold or shared.


