
Milk Powder Market Size and Share
Market Overview
| Study Period | 2021 - 2031 |
|---|---|
| Market Size (2026) | USD 36.45 Billion |
| Market Size (2031) | USD 43.95 Billion |
| Growth Rate (2026 - 2031) | 3.81 % |
| Fastest Growing Market | Middle East and Africa |
| Largest Market | Asia Pacific |
| Market Concentration | Low |
Major Players *Disclaimer: Major Players sorted in no particular order Image © Mordor Intelligence. Reuse requires attribution under CC BY 4.0. | |
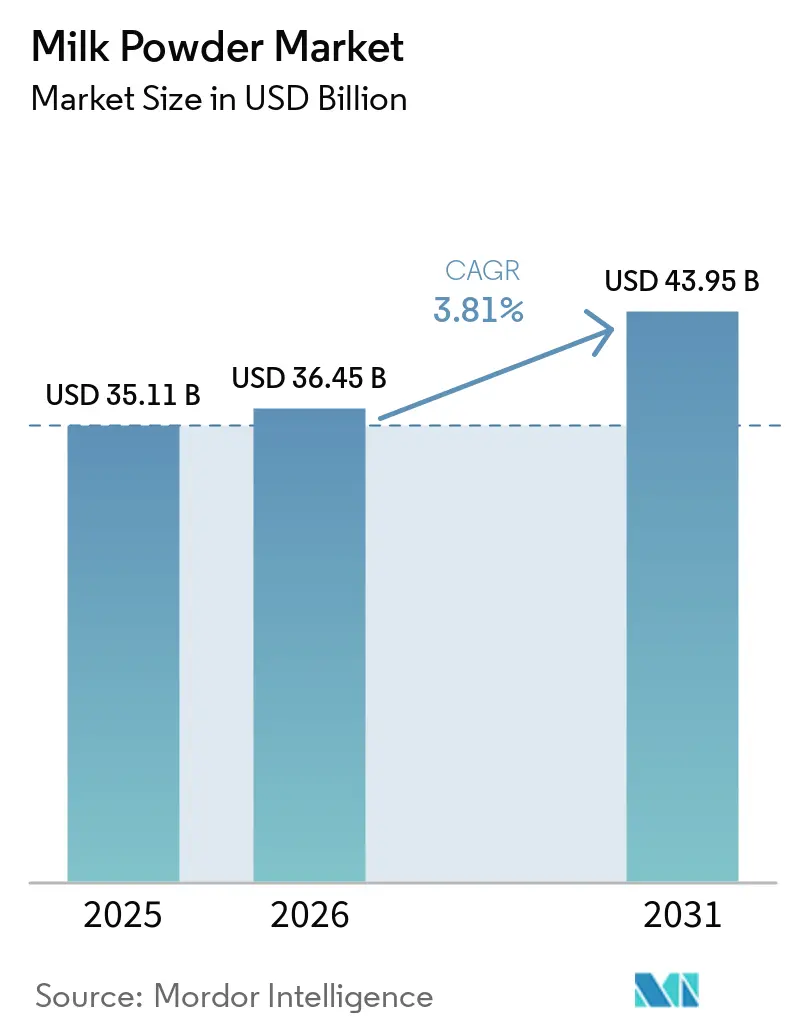
Milk Powder Market Analysis by Mordor Intelligence
The milk powder market size is expected to grow from USD 35.11 billion in 2025 to USD 36.45 billion in 2026 and is forecast to reach USD 43.95 billion by 2031 at 3.81% CAGR over 2026-2031. Milk powder, a dehydrated form of liquid milk, is extensively utilized across various industries, including infant formula, confectionery, bakery products, beverages, and nutritional supplements. Its long shelf life, ease of storage, and transportation advantages make it a preferred choice among manufacturers and consumers alike. The market's growth is primarily driven by the increasing demand for convenient and long-lasting dairy products, particularly in regions with limited access to fresh milk. Rising health consciousness among consumers has further fueled the demand for milk powder, especially for fortified and organic variants that cater to specific dietary needs. The growing adoption of milk powder in emerging economies, where it serves as a cost-effective alternative to liquid milk, is another significant factor contributing to market expansion. Additionally, the food and beverage industry is increasingly incorporating milk powder into its products to enhance nutritional value and improve product stability
Key Report Takeaways
- By product type, dairy milk powder held 62.68% of the milk powder market share in 2025; non-dairy alternatives record the fastest CAGR at 3.92% to 2031.
- By distribution channel, retail commanded 55.72% of the milk powder market size in 2025, whereas foodservice is projected to expand at 4.85% CAGR through 2031.
- By packaging, flexible pouches led with 37.58% revenue share in 2025; single-serve sachets are forecast to grow at 4.60% CAGR.
- By geography, Asia-Pacific contributed 41.62% of 2025 revenue, while the Middle East and Africa are set to advance at 4.90% CAGR to 2031.
Note: Market size and forecast figures in this report are generated using Mordor Intelligence’s proprietary estimation framework, updated with the latest available data and insights as of 2026.
Market Trends and Insights
Drivers Impact Analysis of Milk Powder Market*
| DRIVER | (~) % IMPACT ON CAGR FORECAST | GEOGRAPHIC RELEVANCE | IMPACT TIMELINE |
|---|---|---|---|
| Surging demand for infant fomrula | +0.6% | North America and Europe, expanding to Asia-Pacific | Long term (≥ 4 years) |
| Population growth and urbanization | +0.5% | Asia-Pacific core, spill-over to Middle East and Africa | Long term (≥ 4 years) |
| Advancements in dairy processing technology boost milk powder quality and efficiency | +0.4% | Global, led by North America and Europe | Medium term (2-4 years) |
| Use in processed foods such as ready meals, desserts, and beverages | +0.3% | North America and Europe, emerging in Asia-Pacific | Short term (≤ 2 years) |
| Research and development investments in recombined UHT dairy beverages fueling industrial demand | +0.4% | Global, concentrated in developed markets | Medium term (2-4 years) |
| High-protein lifestyle trend boosting skim milk powder in sports nutrition category | +0.5% | North America and Europe, expanding globally | Short term (≤ 2 years) |
| Source: Mordor Intelligence | |||
Surging demand for infant fomrula
Global infant formula demand intensifies as regulatory frameworks evolve to support market resilience and nutritional adequacy. In 2025, the FDA unveiled its Long-Term National Strategy aimed at bolstering the resilience of the U.S. infant formula market. The strategy introduces fresh measures to prevent contamination and offers incentives to manufacturers, encouraging diversification in light of recent supply chain disruptions. These measures are designed to ensure a more robust and reliable supply chain, minimizing the risk of shortages and enhancing consumer confidence. Simultaneously, technological advancements in premium formulations are making waves. A case in point is Nestlé's debut of NAN Sinergity, which boasts six human milk oligosaccharides. This move underscores how a super-premium positioning not only commands higher margins but also caters to specific nutritional needs, addressing the growing demand for specialized infant nutrition. The blend of regulatory backing and innovative strides is fueling a demand growth that's not just tethered to traditional demographic influences but also driven by evolving consumer preferences and health-conscious choices.
Population growth and urbanization
As urbanization rises in emerging markets, it fuels a structural demand growth, with increased access to packaged dairy products and a boost in disposable income steering choices towards premium nutrition. According to a UN-Habitat report, Asia is home to 54% of the world's urban population, amounting to over 2.2 billion individuals. Projections suggest that by 2050, Asia's urban populace will grow by an additional 1.2 billion, reflecting a 50% increase[1]Source: UN-Habitat, “Asia and the Pacific Region”, www.unhabitat.org. This rapid urbanization in the Asia-Pacific is not just creating dense consumer hubs but also bolstering infrastructure, paving the way for cold-chain distribution networks vital for penetrating the milk powder market. Urban consumers, especially in regions where fresh milk faces availability challenges due to infrastructural constraints, are showing a pronounced willingness to pay more for convenience and nutritional advantages. This demographic evolution lays down robust growth foundations, transcending fleeting economic cycles and fostering predictable demand patterns. Such patterns, in turn, bolster long-term capacity planning and investment strategies.
Advancements in dairy processing technology boost milk powder quality and efficiency
Processing innovation enhances product quality and reduces operational costs by optimizing nutrient retention and extending shelf life through precision manufacturing techniques. SPX FLOW uses advanced milk fractionation technology, applying microfiltration, ultrafiltration, and nanofiltration. This approach preserves nutritional components, facilitates diverse milk separations, minimizes waste, and enhances product value. These advancements enable manufacturers to efficiently separate milk into various components, such as proteins, fats, and minerals, creating a wide range of high-value products. These technological strides allow manufacturers to craft specialized formulations tailored to specific nutritional needs while maintaining cost competitiveness with traditional methods. Additionally, manufacturers expand production possibilities by integrating precision fermentation capabilities, creating unique protein profiles that cater to evolving consumer demands and differentiate their offerings in a crowded marketplace.
Use in processed foods such as ready meals, desserts, and beverages
Food manufacturers are increasingly integrating milk powder into a variety of product categories, aiming to boost nutritional profiles and prolong shelf life. This trend is driven by the versatility of milk powder, which can be used in products ranging from baked goods and confectionery to beverages and infant nutrition. Thanks to advanced processing technologies, manufacturers can now overcome solubility constraints, incorporating milk powder into applications once deemed unsuitable, such as high-protein beverages and ready-to-eat meals. Concurrently, a rising trend towards clean-label products is fueling the preference for familiar dairy ingredients over synthetic substitutes, as consumers increasingly seek transparency and natural components in their food. This widespread industrial adoption not only shields producers from the unpredictable swings of the consumer market but also paves the way for lucrative opportunities in specialized formulations, including functional foods and premium product lines.
Restraints Impact Analysis of Milk Powder Market*
| RESTRAINT | (~) % IMPACT ON CAGR FORECAST | GEOGRAPHIC RELEVANCE | IMPACT TIMELINE |
|---|---|---|---|
| Lactose intolerance and allergies | -0.4% | Global, with higher impact in Asia-Pacific | Long term (≥ 4 years) |
| Volatile global dairy commodity prices caused by climate-linked supply shocks | -0.6% | Global, particularly affecting export-dependent regions | Short term (≤ 2 years) |
| Stringent EU antibiotic residue limits restricting imports of certain milk powders | -0.3% | Europe and export markets to Europe | Medium term (2-4 years) |
| Storage and transportation challenges hinder milk powder distribution | -0.2% | Global, concentrated in emerging markets | Medium term (2-4 years) |
| Source: Mordor Intelligence | |||
Lactose intolerance and allergies
Milk powder faces significant challenges due to lactose intolerance and milk allergies, which act as major restraints in this market. According to the National Institutes of Health (NIH), approximately 68% of the global population is affected by lactose intolerance [2]Source: National Institute of Health, “Definition & Facts for Lactose Intolerance”, www.niddk.nih.gov. This condition limits the consumption of dairy-based products, including milk powder, as individuals with lactose intolerance experience difficulty digesting lactose, a sugar found in milk and dairy products. Furthermore, milk allergies, particularly prevalent among children, further reduce the potential consumer base for milk powder. The Frontiers Report 2024 identifies Cow's Milk Allergy (CMA) as one of the most common food allergies in children, with a prevalence of 1.8% among children aged 1 to 5 in the United States [3]Source: Frontiers, “The future of cow’s milk allergy – milk ladders in IgE-mediated food allergy”, www.frontiersin.org. These health concerns have led to a growing consumer preference for non-dairy alternatives, such as plant-based milk powders, which are perceived as healthier and more suitable for individuals with lactose intolerance or milk allergies. Additionally, regulatory bodies worldwide are increasingly emphasizing the need for clear and accurate labeling of allergens in food products. This regulatory focus adds to the operational challenges for manufacturers, as they must ensure compliance with stringent labeling requirements while maintaining product quality and market competitiveness.
Volatile global dairy commodity prices caused by climate-linked supply shocks
Volatile global dairy commodity prices, particularly in the milk powder market, are significantly influenced by climate-linked supply shocks. Unpredictable weather patterns, such as droughts, floods, and extreme temperatures, have disrupted milk production in key dairy-producing regions. These disruptions lead to inconsistent supply levels, creating price instability in the market. Additionally, climate change has impacted feed availability and quality, further straining milk production. Such supply-side challenges have made it difficult for producers to maintain steady output, thereby intensifying price fluctuations. This volatility poses a major restraint for the milk powder market, affecting both producers and consumers by increasing uncertainty and complicating long-term planning and investment decisions. Moreover, the global dairy industry is heavily reliant on specific regions for milk production, such as New Zealand, the European Union, and the United States. When these regions face climate-related disruptions, the ripple effects are felt across the global supply chain. For instance, drought conditions in New Zealand, a leading exporter of milk powder, have historically resulted in reduced export volumes, driving up prices in international markets.
*Our forecasts treat driver/restraint impacts as directional, not additive. The impact forecasts reflect baseline growth, mix effects, and variable interactions.
Milk Powder Market Segment Analysis
By Product Type:
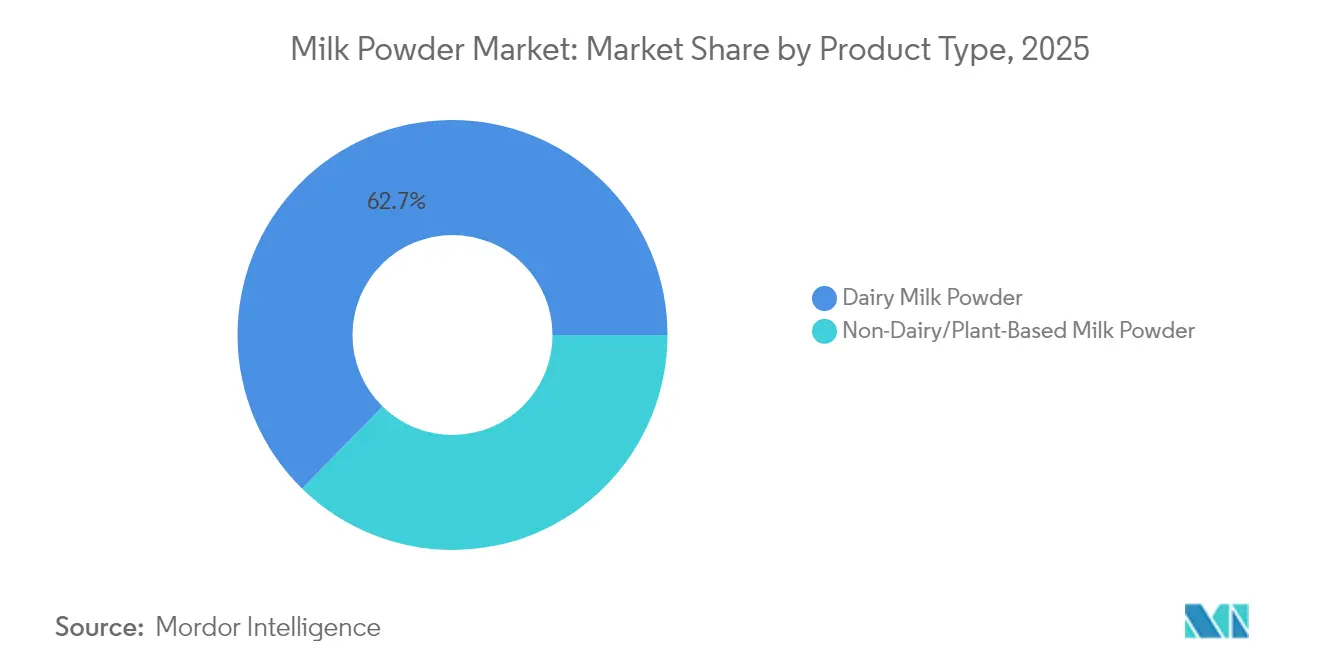
Dairy Milk Powder Dominates, Plant-Based Alternatives Gain TractionIn 2025, dairy milk powder dominated the milk powder market, accounting for a significant 62.68% share. This dominance can be attributed to its widespread use in various applications, including infant formula, bakery products, confectionery, and beverages. Dairy milk powder's long shelf life, ease of transportation, and nutritional benefits make it a preferred choice among consumers and manufacturers alike. Additionally, the segment benefits from the growing demand for protein-enriched diets and the increasing consumption of ready-to-eat and processed foods. Emerging markets, particularly in Asia-Pacific, are witnessing a surge in demand for dairy milk powder due to rising disposable incomes and changing dietary patterns. Furthermore, advancements in processing technologies and the availability of fortified dairy milk powders are expected to sustain the segment's growth during the forecast period.
On the other hand, non-dairy alternatives, such as plant-based milk powders, are experiencing rapid growth, with a projected CAGR of 3.92% through 2031. This growth is driven by rising consumer preferences for vegan and lactose-free products, along with increasing awareness of environmental sustainability. Plant-based milk powders, derived from sources like soy, almond, and oat, are gaining traction due to their health benefits and suitability for individuals with dietary restrictions. The segment's expansion is further supported by innovation in product offerings, such as flavored and fortified variants, which cater to diverse consumer preferences. Additionally, the growing adoption of plant-based diets, supported by marketing campaigns and endorsements from health and wellness influencers, is fueling demand. The increasing availability of plant-based milk powders in mainstream retail channels and their incorporation into various food and beverage applications are expected to drive further growth in this segment.



By Packaging Format:
Single-Serve Innovation Drives GrowthIn 2025, flexible pouches dominated the packaging segment of the milk powder market, accounting for a significant 37.58% revenue share. These pouches are widely preferred due to their lightweight nature, convenience, and ability to preserve the product's freshness for an extended period. Additionally, flexible pouches are cost-effective and environmentally friendly, as they use less material compared to rigid packaging options. Their versatility in accommodating various sizes and quantities makes them a popular choice among manufacturers and consumers alike, driving their substantial market share. Furthermore, the growing adoption of flexible pouches in e-commerce channels, where durability and ease of transportation are critical, has further bolstered their demand.
Single-serve sachets, on the other hand, are projected to grow at a CAGR of 4.60% during the forecast period. These sachets cater to the increasing demand for portion-controlled and on-the-go consumption, particularly among urban consumers and working professionals. The convenience of single-serve sachets, coupled with their affordability, has made them a preferred option for individual servings. Additionally, single-serve sachets are gaining traction in emerging markets, where affordability and accessibility are critical factors influencing consumer choices. Their compact size and ease of disposal align with the growing consumer preference for sustainable and practical packaging solutions. Moreover, the rising trend of health-conscious consumers seeking precise portion sizes has further fueled the demand for single-serve sachets, positioning them as a growing segment in the milk powder market.
By Distribution:
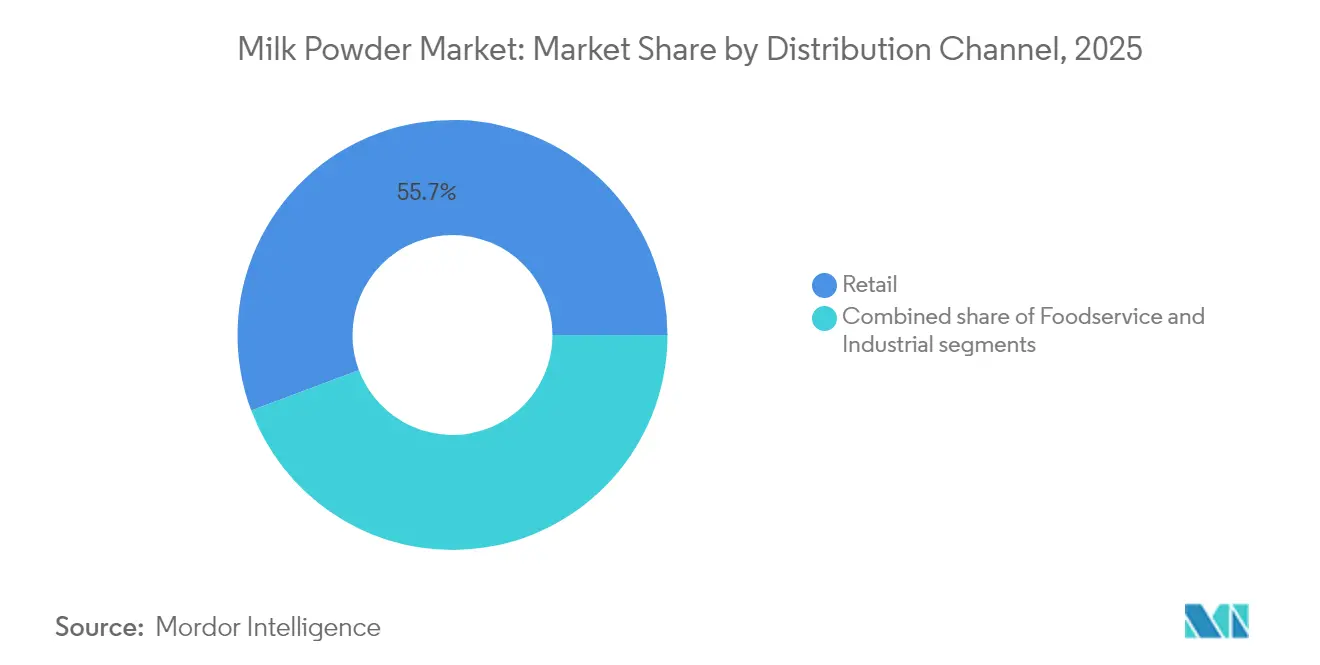
Retail Leads, Foodservice SurgesIn 2025, the retail segment accounted for a significant 55.72% share of the milk powder market. This dominance can be attributed to the increasing demand for milk powder among households, driven by its longer shelf life and convenience compared to liquid milk. Retailers have also been expanding their product offerings, including organic and fortified milk powder variants, to cater to evolving consumer preferences. The growing penetration of e-commerce platforms has further boosted the retail segment, making milk powder more accessible to a broader consumer base. Additionally, the rising trend of purchasing packaged and branded food products has contributed to the segment's growth, as consumers increasingly prioritize quality and safety in their food choices.
Meanwhile, the foodservice sector is projected to grow at a CAGR of 4.85% through 2031. This growth is fueled by the rising use of milk powder in the preparation of various food and beverage products, such as bakery items, desserts, and beverages, within the foodservice industry. The sector benefits from the cost-effectiveness and ease of storage associated with milk powder, which makes it a preferred choice for restaurants, cafes, and catering services. Furthermore, the increasing number of quick-service restaurants (QSRs) and the growing popularity of ready-to-eat and ready-to-drink products have amplified the demand for milk powder in this segment. The foodservice sector is also leveraging innovations in product formulations, such as lactose-free and plant-based milk powder alternatives, to meet the diverse dietary preferences of consumers.
Geography Analysis
APAC Milk Powder Market
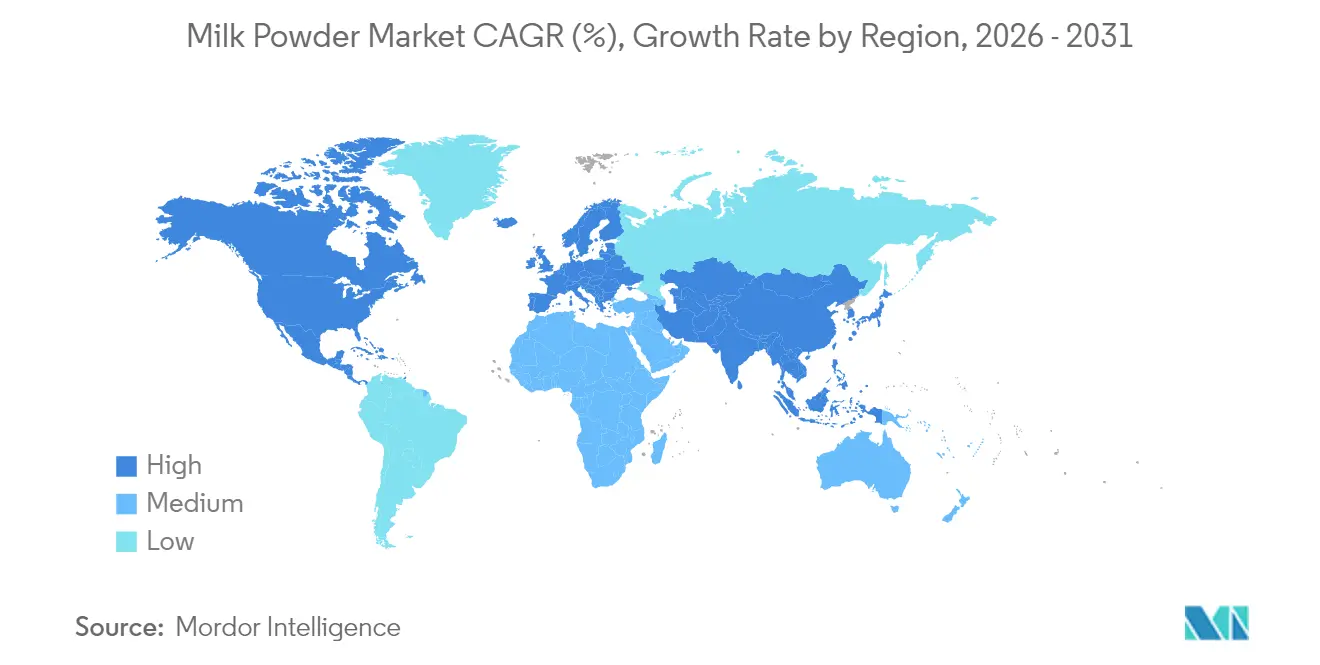
In 2025, the Asia-Pacific region secures a dominant 41.62% market share in the milk powder market, driven by several key factors. The region's demographic expansion, coupled with rising disposable incomes, has significantly increased consumer purchasing power, enabling greater access to packaged dairy products, including milk powder. Urbanization trends further amplify this demand, as urban consumers increasingly prefer convenient and shelf-stable dairy options. Additionally, China's regulatory landscape is undergoing significant changes, with the introduction of new national food safety standards and restrictions on the use of milk powder in shelf-stable milk. While these regulations create short-term disruptions, they also elevate quality standards, benefiting producers who comply with these stringent requirements and positioning them for long-term growth in the market.
MEA Milk Powder Market
The Middle East and Africa region is experiencing the fastest growth in the milk powder market, with a projected CAGR of 4.90% through 2031. This rapid growth is underpinned by ongoing economic development and substantial improvements in infrastructure, which are critical for the efficient distribution and consumption of dairy products. As disposable incomes rise and urbanization progresses, the demand for milk powder and other dairy products is expected to grow steadily. Furthermore, government initiatives aimed at enhancing food security and promoting local dairy production are likely to support the market's expansion in this region, creating opportunities for both domestic and international players.
The Americas and Europe Milk Powder Market
North America and Europe exhibit stable growth patterns, reflecting the maturity of their respective milk powder markets. These regions benefit from well-established supply chains, high consumer awareness, and consistent demand for dairy products. However, growth opportunities remain limited compared to emerging markets. In contrast, South America presents a promising landscape for the milk powder market, driven by economic development and the expansion of the middle-class population. As consumers in this region increasingly seek nutritional enhancement products, the demand for milk powder is expected to rise. Additionally, the region's growing focus on improving dairy production capabilities and expanding export opportunities further supports market growth.

Regulatory Landscape
Milk powder trade and quality compliance are anchored in international food standards and national standards of identity. The Codex Alimentarius Standard for Milk Powders and Cream Powder (CXS 207-1999, last amended 2023) remains a key reference for composition and labeling in cross-border trade, and the Codex Alimentarius Commission adopted additional international food standards during its 49th session held July 6 to 10, 2026. This reinforced Codex as a benchmark used in WTO SPS and TBT alignment.
In major importing markets, compliance is shaped by region-specific entry rules and domestic definitions. In the European regulatory context, Commission Delegated Regulation (EU) 2025/637 (January 2025) amended requirements tied to the entry of specific dairy and composite products into the EU, and the European Union (Dehydrated Preserved Milk) (Amendment) Regulations 2025 (S.I. No. 622/2025) came into operation on June 14, 2026, affecting compliance expectations for dehydrated preserved milk categories. In the United States, FDA standards of identity such as 21 CFR 131.147 define dry whole milk powder composition (including a milkfat range), while broader food safety obligations are influenced by the FSMA traceability rule timeline. The FDA extended the compliance date for additional traceability recordkeeping by 30 months to July 20, 2028.
Value Chain Analysis
The milk powder value chain starts with raw milk production (cooperatives and large farms), followed by collection and chilling, and then industrial processing into powders through standardization, evaporation, and spray drying. Packaging follows into formats such as flexible pouches, cans/tins, bulk bags, and single-serve sachets. Large processors and brand owners such as Nestle, Fonterra, Lactalis, FrieslandCampina, Danone, and Arla typically coordinate multi-origin sourcing, quality assurance, and formulation for downstream users across infant and follow-on formula, bakery and confectionery, recombined dairy beverages, and nutrition and sports supplements.
International trade remains central because powder is the preferred form for long-distance dairy movement. Major export supply is centered on New Zealand, the European Union, and the United States, supplying deficit markets in Asia and parts of the Middle East and North Africa. Key bottlenecks include seasonal milk supply volatility, energy-intensive drying, processing capacity constraints at plants, and logistics disruptions that can raise transit risk and cost on maritime routes. Recent supply-chain actions also highlight resilience and sustainability priorities: Nestle published its inaugural Dairy Plan in June 2026, covering 130,000 farmers and 200 suppliers and reporting a 26% net greenhouse gas reduction by 2025 versus 2018. Separately, The a2 Milk Company reported in April 2026 that manufacturing backlogs and heightened customs and quality testing affected label infant milk formula availability in China in 4Q26, illustrating how regulatory scrutiny and capacity utilization can ripple into finished powder-linked categories.
Competitive Landscape
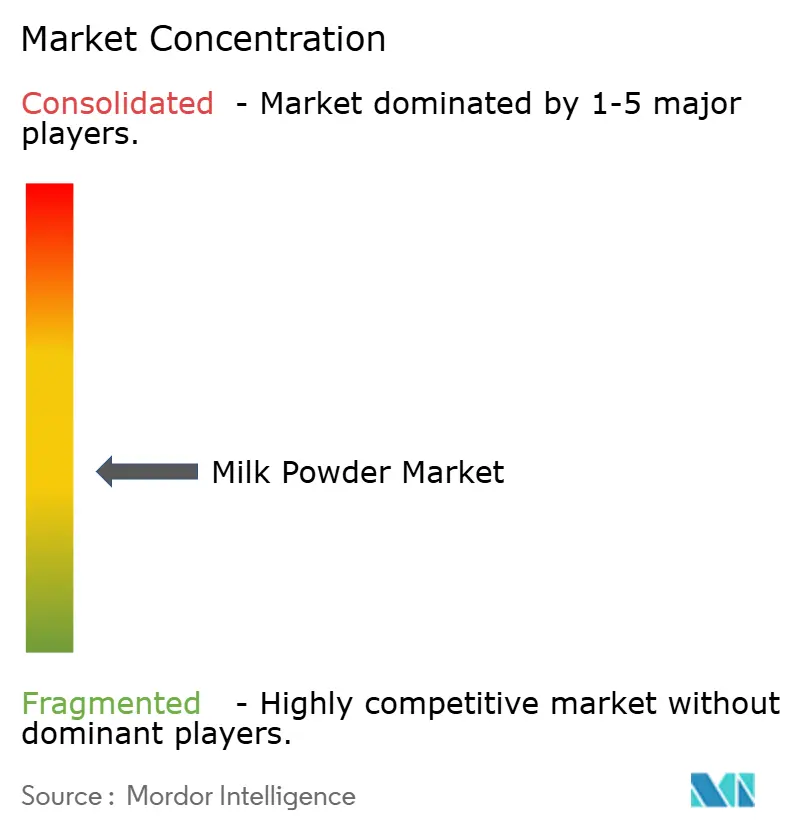
The milk powder market demonstrates a low level of concentration. Prominent market players in the market includes Arla Foods Amba, Fonterra Co-operative Group, Nestle S.A., Danone S.A., Groupe Lactalis. This fragmented competitive landscape indicates the presence of numerous players, creating opportunities for strategic consolidations. Such consolidations enable companies to achieve operational scale advantages, streamline processes, and enhance their market presence. The fragmented nature of the market also fosters innovation and competition, as companies continuously strive to differentiate themselves and capture a larger share of the market. These dynamics make the competitive landscape both challenging and opportunistic for market participants.
Market leaders in the milk powder industry leverage vertical integration capabilities to strengthen their supply chains and reduce operational costs. By controlling multiple stages of the value chain, these companies ensure efficiency and maintain consistent product quality. Geographic diversification is another critical strategy employed by leading players to sustain their competitive positioning. Expanding their presence across multiple regions allows them to mitigate risks associated with market-specific challenges, such as regulatory changes or economic fluctuations, while capitalizing on growth opportunities in emerging markets. These strategies collectively enable leading companies to adapt to evolving market dynamics and maintain their dominance.
In contrast, smaller players focus on specialized segments or regional markets to establish their foothold. Their deep understanding of local consumer preferences and market conditions allows them to offer tailored products and services, providing a competitive advantage. By targeting niche markets and leveraging their local expertise, these companies differentiate themselves from larger competitors and build strong customer loyalty. This dual approach, where market leaders focus on scale and diversification while smaller players emphasize specialization and regional strengths, contributes to the dynamic and competitive nature of the milk powder market.
Milk Powder Industry Leaders
Arla Foods amba
Nestlé S.A.
Danone S.A.
Groupe Lactalis
Fonterra Co-operative Group
- *Disclaimer: Major Players sorted in no particular order
Milk Powder Market Companies Covered in this Report
- Nestle S.A.
- Fonterra Co-operative Group Ltd
- Danone S.A.
- Groupe Lactalis
- Arla Foods amba
- Saputo Inc.
- Royal FrieslandCampina N.V.
- Dairy Farmers of America, Inc.
- Inner Mongolia Yili Industrial Group Co., Ltd.
- Gujarat Cooperative Milk Marketing Federation (Amul)
- Abbott Laboratories
- Morinaga Milk Industry Co.
- Hochdorf Holding AG
- Westland Milk Products
- Valio Oy
- Valley Milk LLC
- Royal A-ware Food Group
- Almarai Company
- Olam Food Ingredients
- Parag Milk Foods Ltd.

Market Opportunities and Future Outlook
Opportunities are emerging in capacity additions and import-substitution programs in deficit markets, alongside quality and efficiency upgrades in powder manufacturing. Algeria has commissioned large-scale dairy processing capacity, including powder-focused facilities, to reduce reliance on imported milk powder. Investment programs in other regions are also increasing powder output and modernizing plants. Darigold commenced operations at its Pasco, Washington facility in June 2025 to produce butter and powdered milk using milk from regional farms. In 2026, Alvoar Lacteos announced new powder-led modernization and expansion plans in Brazil (Batalha, Alagoas), and Verka (Milkfed Punjab) outlined upgrades for its Ferozepur facility that includes a milk powder plant.
A second opportunity area is plant-level digitization and faster functionality testing that reduces rework, improves batch consistency, and shortens release cycles for industrial customers such as infant nutrition, beverages, and bakery. In May 2026, Bioeconomy Science Institute and AgResearch signed a commercial deal with a dairy company to deploy an AI-assisted near-infrared spectroscopy tool that measures milk powder functionality on the factory floor, replacing multi-day laboratory testing. Alongside equipment-side improvements such as membrane filtration cascades and energy-efficiency upgrades for drying, these moves support premiumization in specialized powders (fortified, high-protein, and application-specific powders) while also addressing cost and compliance pressures across global supply chains.
Recent Industry Developments in Milk Powder Market
- April 2026: Lactalis finalized the acquisition of Fonterra's consumer and associated businesses, adding 16 manufacturing facilities across Australia, New Zealand, Sri Lanka, Malaysia, Indonesia, and Saudi Arabia. The expanded footprint strengthens Lactalis ability to serve regional demand for dairy staples, including milk powders and recombination inputs, while increasing control over processing and packaging capacity across Oceania and parts of Asia and the Middle East.
- October 2025: Arla Foods implemented high-temperature electric heat pump technology at its AKAFA site in Denmark to reduce emissions from spray drying operations by an estimated 1,500 tonnes of CO2 annually. Electrifying a major energy load in powder-related processing supports lower-carbon ingredients supply and provides a replicable pathway for other drying-intensive plants within Arla and the broader sector.
- August 2024: Arla Foods announced a strategic partnership with French cooperative Sodiaal to produce Arla branded Early Life Nutrition products for China and other markets, alongside a plan to discontinue ARINCO B2B infant nutrition production in early 2026. The move realigns manufacturing and sourcing for infant nutrition-linked powders, tightening focus on scalable partner production and continuity of supply into key import markets.


Milk Powder Market Report Scope and Research Methodology
Market Definition and Coverage
This market covers the value of milk powder sold for food and beverage use, across dairy-based powders and plant-based milk powders, counted at the point of commercial sale in each region.
Scope exclusions: It excludes fresh liquid milk and in-home preparation costs, and it does not count downstream retail or foodservice markups beyond the product sale.
Segments Covered in This Report
- By Type
- Dairy Milk Powder
- Whole Milk Powder (WMP)
- Skim Milk Powder (SMP)
- Others (Fat-Filled Milk Powder, A2 and Specialty Nutritional Powders, etc.)
- Non-Dairy/Plant-Based Milk Powder
- Soy Milk Powder
- Almond Milk Powder
- Coconut Milk Powder
- Oat and Other Cereal-Based Powders
- Dairy Milk Powder
- By Distribution Channel
- Retail
- Supermarkets/Hypermarkets
- Convenience and Grocery Stores
- Online Retail
- Other Distribution Channel
- Foodservice
- Industrial
- Infant and Follow-on Formula
- Bakery and Confectionery
- Dairy-based Beverages and Recombination
- Nutritional and Sports Supplements
- Others (Ready-Made Meals, cosmetics, etc.)
- Retail
- By Packaging Format
- Flexible Pouches
- Cans and Tins
- Bulk Bags
- Single-Serve Sachets
- Geography
- North America
- United States
- Canada
- Mexico
- Rest of North America
- Europe
- Germany
- United Kingdom
- France
- Italy
- Spain
- Netherlands
- Sweden
- Poland
- Belgium
- Rest of Europe
- Asia-Pacific
- China
- India
- Japan
- South Korea
- Australia
- Indonesia
- Thailand
- Singapore
- Rest of Asia-Pacific
- South America
- Brazil
- Argentina
- Chile
- Colombia
- Peru
- Rest of South America
- Middle East and Africa
- South Africa
- Saudi Arabia
- United Arab Emirates
- Egypt
- Nigeria
- Morocco
- Turkey
- Rest of Middle East and Africa
- North America
Data Sources, Market Sizing, and Validation
Desk Research
Desk research starts by building a factual base on milk production, trade flows, and price behavior, and then it is mapped to milk powder demand signals and end-use applications. We refer to public sources such as FAOSTAT, UN Comtrade, the USDA dairy and trade releases, Eurostat dairy statistics, and OECD-FAO outlook tables to understand supply, trade direction, and the pace of changes by region.
Alongside these, company annual reports, investor presentations, and association websites are used to capture capacity additions, product mix shifts, and channel movements like online retail penetration. For price and flow checks, we also use paid subscriptions that cover company financials and intelligence, import and export shipment-level records, and patent databases for formulation and fortification activity. These desk inputs are then used to set realistic ranges and to anchor interview questions before primary validation, and the sources named above are illustrative rather than exhaustive.
Primary Interviews and Surveys
Primary work is used to pressure-test the desk assumptions on how milk powder is priced, where it is traded, and how demand changes by application like infant formula and bakery. We speak with stakeholders across the value chain, including ingredient suppliers, dairy processors, distributors, retail and foodservice buyers, and technical roles involved in formulation, and we cover APAC, EMEA, and the Americas so regional differences in trade reliance and consumer use are not averaged out.
Distribution of primary research fieldwork respondents
| Company type | Respondent position | Region |
|---|---|---|
| Top tier: 28% | CXOs: 12% | APAC: 42% |
| Mid tier: 57% | Functional/Unit leaders: 28% | EMEA: 33% |
| Smaller Players: 15% | Managers: 60% | Americas: 25% |
Market-Sizing & Forecasting
Sizing is built using a top-down approach where production, import, and export data are used to reconstruct apparent consumption by region, and then it is converted into value using price series that reflect product mix. To keep the numbers grounded, we corroborate the totals with selective bottom-up approximations such as sampled supplier and channel roll-ups, plus ASP times volume checks for key applications.
Inputs that matter in this market include milk output and solids availability, milk powder trade volumes by HS codes, average export and import unit values, the share of usage into infant formula and recombined dairy beverages, and the pace of plant-based powder substitution where it is visible in retail and food manufacturing. When product splits are not directly reported, gaps are handled by using proxy shares from trade patterns, capacity announcements, and interview-led mix ranges, which are then normalized to the regional totals.
For forecasting, we use scenario analysis supported by short-run time series smoothing on prices, and demand drivers are adjusted using expert views on dairy farm economics, trade policy shifts, and consumer downtrading or premiumization. The final outlook is checked so that volume and value move in a believable way, especially in years with known commodity price swings.
Data Validation & Update Cycle
Outputs are validated through multiple checks that compare the model results against independent signals like trade balances, reported production capacity, and observed pricing movements in major exporting regions. If a region shows an unusual jump, the assumptions are reopened, interview notes are revisited, and clarifying calls are triggered until the variance is explained.
Before sign-off, the work goes through step-by-step analyst reviews that look for math errors, inconsistent unit conversions, and scope leakage across dairy and plant-based powders. Reports are refreshed annually, and interim updates are made when material events occur such as tariff changes, major capacity additions, or sharp commodity price resets, followed by a final pre-delivery pass so clients receive the latest view.
Mordor Intelligence's Milk Powder Market Sizing Compared With Other Published Estimates
Published market values for milk powder can look far apart because the underlying scope and pricing points are not always aligned, and the update timing can be different as well. Differences usually come from what gets counted as milk powder, the treatment of plant-based powders and adjacent dairy ingredients, and how trade-heavy regions are valued.
Some external estimates fold in broader dairy ingredient categories or apply faster price growth assumptions across the full forecast window, which can lift the total even when volumes are similar. The split is often explained by scope, since Mordor Intelligence counts dairy and plant-based milk powders as defined products across applications and channels, and it does not pull in nearby categories like generic dairy whiteners unless they are explicitly sold as milk powder.
Benchmark comparison
| Source | Market Size | Gaps in Research Methodology |
|---|---|---|
| Mordor Intelligence | USD 36.45 B (2026) | |
| Global Consultancy A | USD 38.86 B (2026) | This estimate appears to use a broader inclusion set and a higher growth path into the next decade, which can raise the base value if adjacent powder products or wider dairy ingredients are included under one heading. |
| Regional Consultancy B | USD 37.56 B (2024) | The year basis differs and the scope leans toward dairy-only type lists, which can shift the total depending on whether plant-based powders are excluded and how commodity price swings in 2024 are converted into USD. |
Looking across the three figures, the spread is mainly driven by what each publisher bundles into the product definition and how the base year is handled during price volatility. Our approach keeps the size traceable to production and trade signals, and then it is tightened through interviews so the final value can be repeated and explained with clear inputs.


Key Questions Answered in the Report
What is the current value of the milk powder market?
The milk powder market is valued at USD 36.45 billion in 2026 and is forecast to reach USD 43.95 billion by 2031.
Which region holds the largest milk powder market share?
Asia-Pacific leads with 41.62% of 2025 revenue, supported by expanding middle-class demand and evolving quality regulations.
What segment is growing fastest within the market?
Foodservice distribution posts the highest growth, projected at 4.85% CAGR through 2031 as cafés, bakeries, and restaurants adopt high-solubility powders.
How are packaging trends evolving?
Single-serve sachets are the fastest-growing format at 4.60% CAGR, driven by portability and portion-control preferences.
Page last updated on:


 Your data is secure and never sold or shared.


