Trail Mix Market Size and Share
Market Overview
| Study Period | 2021 - 2031 |
|---|---|
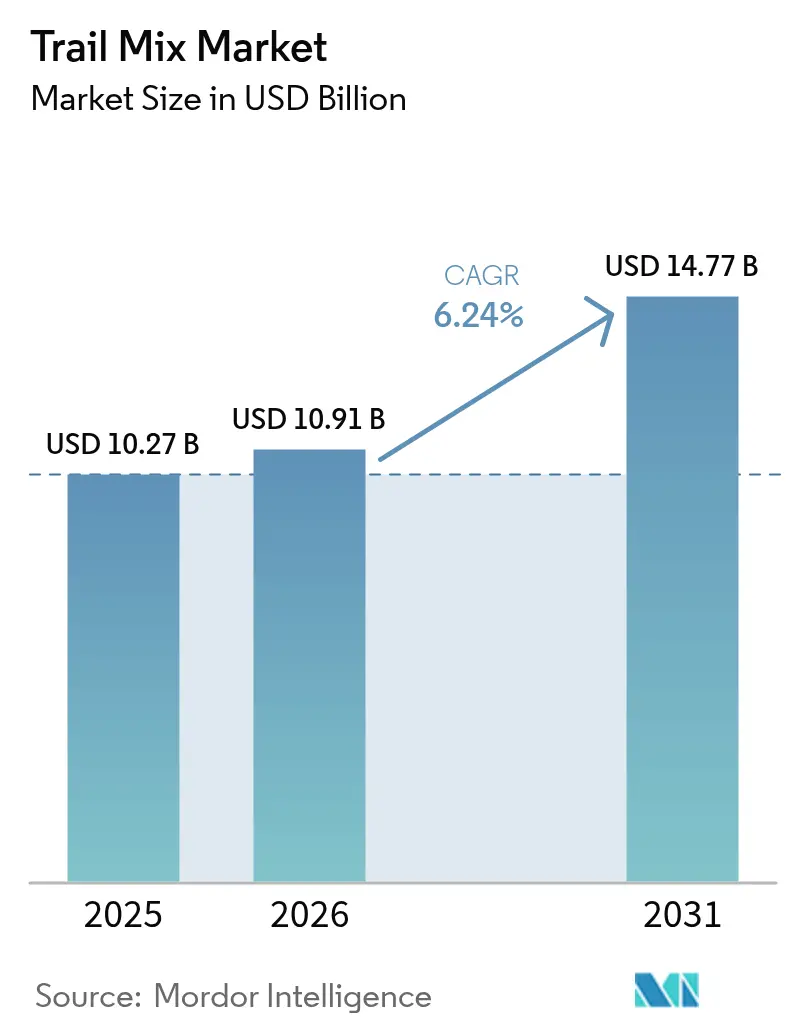
| Market Size (2026) | USD 10.91 Billion |
| Market Size (2031) | USD 14.77 Billion |
| Growth Rate (2026 - 2031) | 6.24% CAGR |
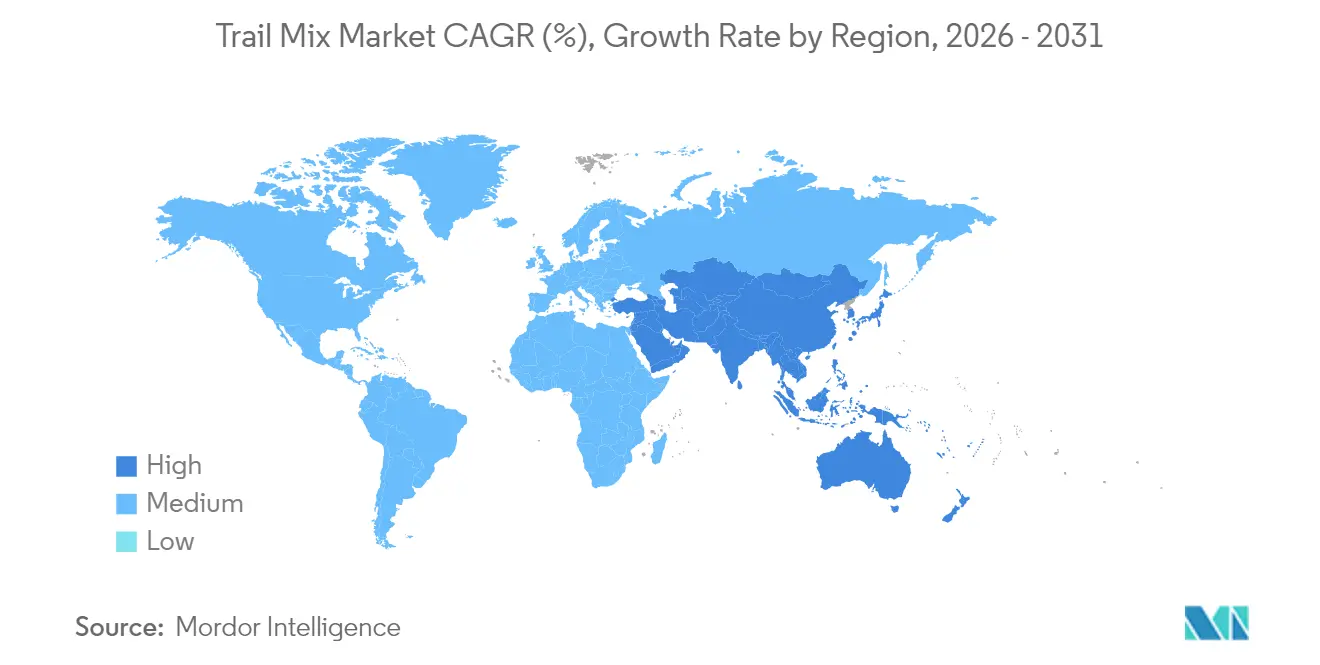
| Fastest Growing Market | Asia Pacific |
| Largest Market | North America |
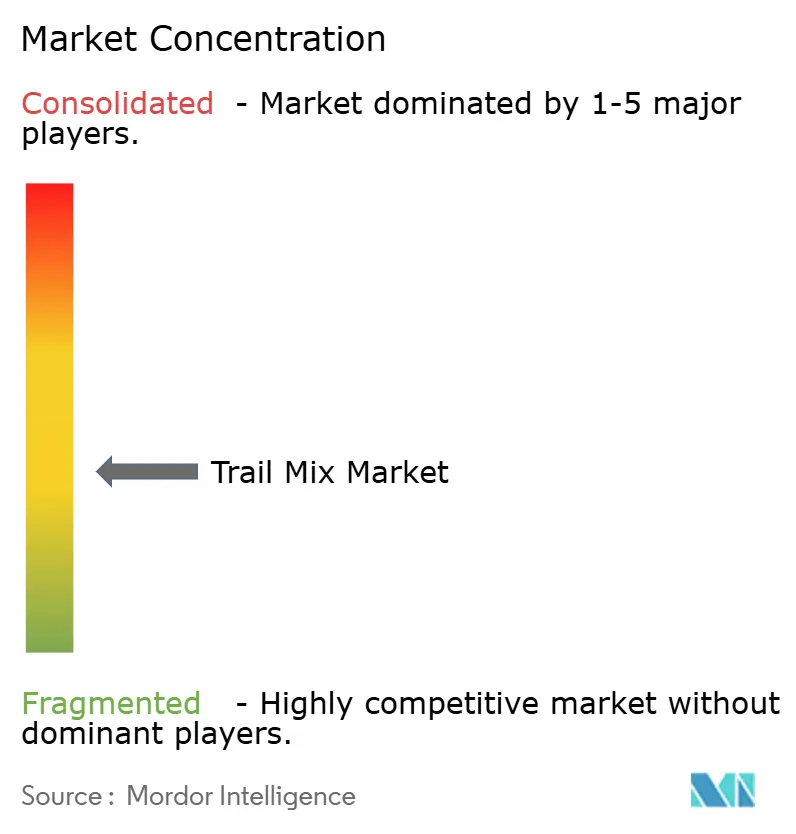
| Market Concentration | Medium |
Major Players
*Disclaimer: Major Players sorted in no particular order Image © Mordor Intelligence. Reuse requires attribution under CC BY 4.0. |
|
Trail Mix Market Analysis by Mordor Intelligence
trail mix market size in 2026 is estimated at USD 10.91 billion, growing from 2025 value of USD 10.27 billion with 2031 projections showing USD 14.77 billion, growing at 6.24% CAGR over 2026-2031.This trend highlights a significant shift towards functional snacking, driven by regulatory incentives favoring cleaner labels and digital platforms that streamline the producer-consumer connection. Emphasizing ingredient sourcing, up-cycling surplus agricultural outputs, and innovating packaging based on circular-economy principles bolster volume growth while safeguarding margins. Additionally, the U.S. Food and Drug Administration (FDA) has tightened its criteria for "healthy" claims, effective February 2025[1]Source: Federal Register," Food Labeling: Nutrient Content Claims; Definition of Term 'Healthy'", www.federalregister.gov. These new standards elevate sodium and added-sugar thresholds, subtly promoting trail mix formulations centered on whole fruits and nuts. Retailers are seizing these opportunities, dedicating more shelf space and utilizing end-cap displays to position trail mixes as guilt-free treats. As climate challenges increasingly impact nut yields, producers are turning to forward-contracting strategies. This shift is fostering closer partnerships between producers and retailers, helping to stabilize price fluctuations throughout much of 2025.
Key Report Takeaways
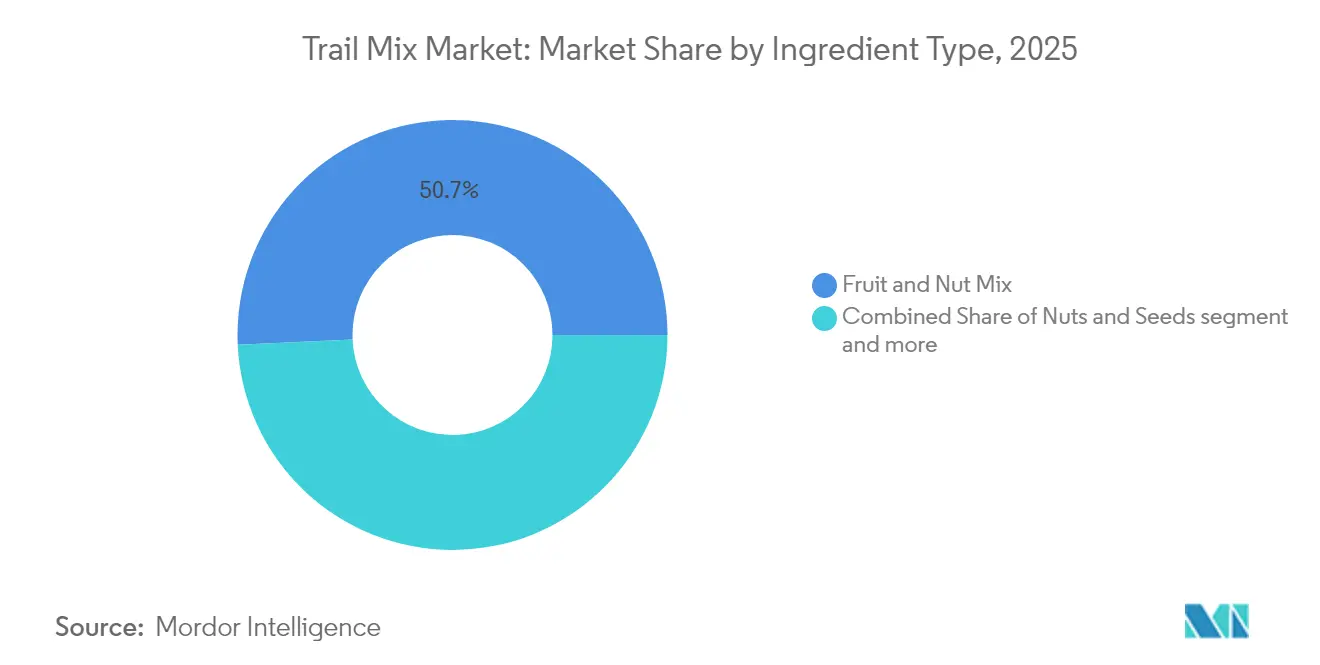
- By ingredient type, fruit and nut blends held 50.72% of the trail mixes market share in 2025, while the nuts and seeds line is forecast to log a 7.18% CAGR to 2031.
- By flavor, salted variants led with 32.18% revenue share in 2025; chocolate-coated blends are poised for the fastest 6.6% CAGR through 2031.
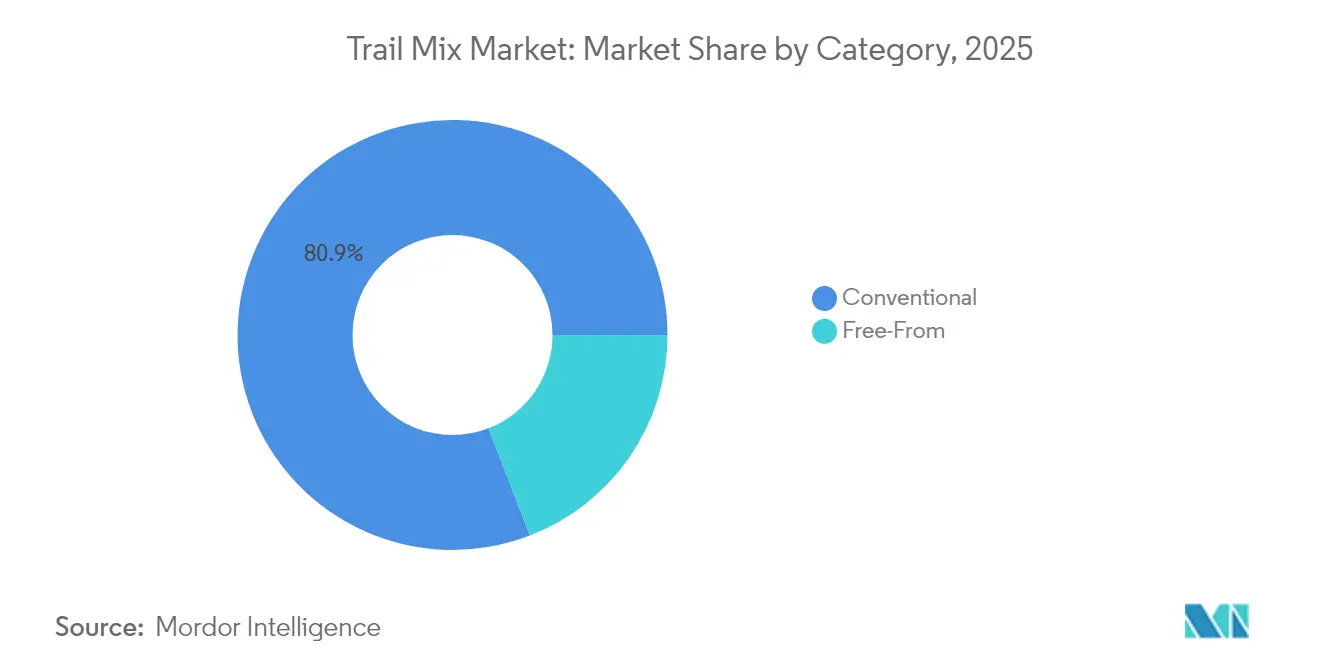
- By category, conventional products accounted for 80.86% of the trail mixes market size in 2025, whereas Free From options advance at a robust 10.11% CAGR between 2026-2031.
- By packaging, bottles and jars captured 58.97% share in 2025; pouches and sachets expanded at a 6.5% CAGR.
- By distribution channel, supermarkets/hypermarkets dominated with a 62.45% slice in 2025, but Online Retail Stores registered the strongest 7.15% CAGR through 2031.
- By geography, North America commanded 36.22% of the trail mixes market share in 2025; Asia-Pacific posts the highest 7.05% regional CAGR during the forecast horizon.
Note: Market size and forecast figures in this report are generated using Mordor Intelligence’s proprietary estimation framework, updated with the latest available data and insights as of 2026.
Global Trail Mix Market Trends and Insights
Drivers Impact Analysis*
| Driver | (~)% Impact on CAGR Forecast | Geographic Relevance | Impact Timeline |
|---|---|---|---|
| Shift toward reduced-sugar and healthier snacking | +1.8% | Global, with early adoption in North America and EU | Medium term (2-4 years) |
| Growing demand for organic, clean-label ingredients | +1.5% | North America and EU core, expanding to Asia-Pacific | Long term (≥ 4 years) |
| Rise of on-the-go nutrition for busy lifestyles | +1.2% | Global urban centers, strongest in Asia-Pacific | Short term (≤ 2 years) |
| Expansion of e-commerce grocery and DTC channels | + 1.0% | Global, with accelerated adoption in Asia-Pacific | Medium term (2-4 years) |
| Up-cycling of surplus nuts/fruit lowering input costs | +0.6% | North America and EU production regions | Long term (≥ 4 years) |
| Closed-loop recyclable pouches boost brand appeal | +0.4% | EU regulatory-driven, expanding globally | Long term (≥ 4 years) |
| Source: Mordor Intelligence | |||
Shift Toward Reduced-Sugar and Healthier Snacking
As 48% of global consumers now snack more than twice a day, scrutiny on added sugars has intensified. The World Health Organization recommends keeping free sugars below 10% of daily energy intake to promote better health outcomes and reduce risks associated with excessive sugar consumption. Meanwhile, the FDA's updated definition of "healthy" tightens these limits even further, emphasizing the importance of nutrient-dense options. Trail mix producers, opting for natural sweetness from dates, raisins, or cranberries instead of refined sugar, bask in an enhanced health reputation, as these ingredients align with consumer demand for cleaner labels and minimally processed foods. Retail data reveals that in the first half of 2025, SKUs flaunting the FDA's "healthy" label saw a 19% boost on shelves, reflecting the growing influence of health-conscious purchasing decisions. Claims of reduced sugar content, paired with protein fortification, empower manufacturers to upsell while maintaining a sense of indulgence, striking a balance between health and taste preferences.
Growing Demand for Organic, Clean-Label Ingredients
Despite the costs of USDA Organic certification ranging from USD 2,000 to 10,000 per facility based on throughput, producers remained undeterred[2]Source: United States Department of Agriculture," Becoming a Certified Operation", www.ams.usda.gov. In fact, between 2023 and 2025, the certification rate for U.S. trail mix facilities surged by 11 percentage points, reflecting the growing demand for organic products. Organic trail mixes, fetching retail premiums of 20-40%, have found a niche in higher-income households, particularly those conscious of allergies and seeking healthier snack options. Furthermore, the organic label not only appeals to these households but also meets the demands of European buyers prioritizing pesticide transparency, fostering a sense of cross-border harmonization, and expanding market opportunities for U.S. producers. However, challenges loom: limited acreage for organic nuts and climate volatility are testing the resilience of smaller operators, especially those tied to single-source contracts. These operators face heightened risks due to supply chain disruptions and fluctuating yields, which could impact their ability to meet growing demand consistently.
Rise of On-the-Go Nutrition for Busy Lifestyles
Urban density and the rise of hybrid work models have given birth to the trend of "snackification." Single-serve 35 g pouches of trail mixes, offering 200-240 kcal and 6–8 g of protein, are now being embraced as convenient meal replacements. These products cater to the growing demand for on-the-go nutrition, aligning with the busy lifestyles of urban consumers. The portability, portion-controlled packaging, and nutritional benefits make them an appealing choice for individuals seeking healthier and more practical snacking options. Millennials and Gen Z, driven by social media's emphasis on energy-boosting benefits, keto-friendly macros, and the convenience of portable snacks, now dominate the scene, accounting for 57% of the global trail mix volume. This demographic's preference for functional and trendy food options continues to shape the market dynamics, further fueling the growth of the trail mix segment.
Expansion of E-Commerce Grocery and DTC Channels
By late 2024, USDA metrics reveal that 19.3% of U.S. grocery shoppers made at least one online order in the past month, highlighting the growing adoption of e-commerce in the grocery market[3]Source: United States Department of Agriculture," Nearly 20 percent of U.S. shoppers bought groceries online", www.ers.usda.gov. This trend reflects the increasing convenience and accessibility of online platforms for grocery shopping. Additionally, with permanent SNAP e-commerce availability in 49 states, the online reach now extends to lower-income segments, enabling broader access to online grocery shopping for underserved communities and driving inclusivity in the market. Brands introducing quarterly subscription-box models in 2024 boast a retention churn rate below 8% over a year, showcasing the effectiveness of curated offerings in maintaining customer loyalty and ensuring consistent revenue streams. Furthermore, personalized mix builders, which let consumers adjust nut, seed, and fruit ratios to their preferences, are bolstering profit margins by catering to individual tastes, enhancing customer satisfaction, and encouraging repeat purchases.
Restraint Impact Analysis*
| Restraint | (~)% Impact on CAGR Forecast | Geographic Relevance | Impact Timeline |
|---|---|---|---|
| Cheaper indulgent snack substitutes | -1.4% | Global, most pronounced in price-sensitive markets | Short term (≤ 2 years) |
| Price volatility of nuts and dried-fruit inputs | -1.1% | Global production regions, affecting all markets | Medium term (2-4 years) |
| Stricter allergen-control compliance costs | -0.8% | EU and North America regulatory regions | Medium term (2-4 years) |
| Climate-induced crop-yield disruptions | -0.7% | Primary production regions: California, Mediterranean | Long term (≥ 4 years) |
| Source: Mordor Intelligence | |||
Cheaper Indulgent Snack Substitutes
In 2024-2025, inflationary pressures significantly widened the price disparity between trail mixes and high-salt chips, making affordability a key concern for consumers. Private-label baked snacks capitalized on this trend by offering a 30-50% discount compared to branded trail mixes, thereby gaining traction among price-sensitive buyers. Retail promotions further intensified this dynamic by re-centering consumer attention on price comparisons, creating a highly competitive market environment. This shift forced premium trail mix brands to adopt a more strategic approach to defend their shelf presence. They emphasized their functional benefits, such as fiber density, plant protein, and low glycemic load, through targeted marketing campaigns and product labeling. These efforts aimed to justify their higher price points while appealing to health-conscious consumers seeking added nutritional value and long-term health benefits beyond cost considerations.
Price Volatility of Nuts and Dried-Fruit Inputs
California, the sole producer of U.S. almonds and pistachios, finds its supply chain highly vulnerable to drought conditions, given the state's critical role in meeting domestic demand. In 2024, walnut yields dropped by 19% due to ongoing water shortages, significantly impacting the market's supply dynamics and creating ripple effects across the industry. Meanwhile, Hurricane Helene caused pecan orchards in Georgia to suffer a USD 138 million loss, further straining the nut supply chain and highlighting the susceptibility of agricultural markets to extreme weather events. These challenges have underscored the importance of risk mitigation strategies for stakeholders in the nut industry. In response, manufacturers secured multi-year supply contracts to mitigate risks and ensure consistent availability. However, despite these measures, they encountered a 6% increase in average costs by early 2025, reflecting the broader challenges in maintaining supply chain stability, managing rising operational expenses, and adapting to climate-related disruptions.
*Our forecasts treat driver/restraint impacts as directional, not additive. The impact forecasts reflect baseline growth, mix effects, and variable interactions.
Segment Analysis
By Ingredient Type: Fruit and Nut Dominance Faces Flavor Innovation
In 2025, fruit and nut blends commanded a dominant 50.72% share of the trail mixes market, thanks to their universal taste appeal and balanced nutritional profile. These blends, trusted by consumers for their familiar ingredients, enjoy high repeat purchase rates in both retail and online platforms. Responding to this momentum, brands have begun incorporating functional additives, such as collagen peptides and fortified fibers, enhancing their value proposition and setting themselves apart on shelves. The versatility and extended shelf life of fruit and nut mixes make them a go-to choice for various snacking occasions, from fitness routines to travel kits. With increasing regulatory scrutiny on health claims, these blends are now emphasizing substantiated benefits, like flaxseed-derived ALA omega-3, to bolster brand credibility and ensure compliance. Even with a slight moderation in growth rates, fruit and nut blends continue to be the primary revenue driver in the global trail mixes market.
Forecasted to grow at a CAGR of 7.18% from 2026 to 2031, the nuts and seeds segment is emerging as the fastest-growing ingredient group in trail mixes. This surge is driven by a growing consumer preference for protein-rich, plant-based snacks that provide sustained energy, catering especially to active lifestyles and outdoor enthusiasts. Urban professionals and fitness buffs, always on the move, are gravitating towards these nutrient-dense yet convenient snacking options. Brands are not just sticking to traditional mixes; they're innovating by using sunflower seeds as budget-friendly protein alternatives, shielding themselves from nut price fluctuations. Additionally, they're experimenting with spiced and savory profiles, appealing to adventurous younger demographics, particularly Gen Z in the Asia-Pacific region. With a heightened demand for clean-label and organic products, the nuts and seeds segment is poised to eclipse traditional blends and broaden its global market presence.


By Flavor: Sweet-Savory Balance Drives Premium Positioning
In 2025, salted trail mix variants dominated the market, securing 32.18% of the global revenue share. Their widespread appeal, rooted in a savory taste and universal acceptance, has cemented their status as a go-to snack across diverse cultures and retail platforms. These salted blends, typically a mix of nuts and seeds with a hint of seasoning, draw in repeat customers seeking a balanced and guilt-free treat. Their straightforward flavors resonate with both active lifestyles and casual snacking moments, propelling sales in supermarkets, convenience stores, and travel outlets. Beyond their standalone appeal, salted trail mixes enhance beverages and complement other foods, broadening their consumption occasions. The sustained demand from health-conscious consumers fuels innovations, like lower-sodium options and clean-label blends, ensuring the segment's continued leadership.
Chocolate-coated trail mix blends are set to emerge as the fastest-growing flavor segment, with a projected CAGR of 6.6% through 2031. These blends cater to consumers desiring a treat that's both indulgent and functional, melding traditional trail mix components with chocolate chips, cocoa-dusted nuts, or chocolate-covered fruits. Their sweet flavor profile resonates with both kids and adults, broadening their market reach and driving impulse purchases. By incorporating dark chocolate or healthier sweeteners, these mixes tap into the wellness trend. Brands are also experimenting with premium, regionally-inspired chocolate variants, like single-origin cocoa and artisanal blends, catering to the dual demand for indulgence and quality. With the rise of experiential snacking, chocolate-coated trail mixes are carving out a larger market share, buoyed by their unique flavors and premium branding.
By Category: Free From Acceleration Signals Premium Opportunity
In 2025, conventional trail mix products dominated category sales, accounting for 80.86% of the total market size. This dominance is driven by wide consumer familiarity, cost-effectiveness, and broad availability through major retail formats, including supermarkets and convenience stores. Conventional mixes typically blend non-organic nuts, seeds, dried fruits, and flavor additives aimed at mass-market appeal. Standardized production and sourcing processes enable consistent quality and longer shelf life, satisfying demand for affordable and practical snacks across geographies. Competitive pricing ensures strong adoption among value-oriented consumers, who favor accessible and trusted brands for everyday snacking. As trail mixes continue to expand into diverse consumption occasions, conventional offerings remain the primary growth anchor for the industry.
The “Free From” trail mix category, encompassing allergen-free, gluten-free, and clean-label products, is advancing at a robust 10.11% CAGR between 2026 and 2031. Health-conscious consumers are driving demand for these products, prioritizing transparency, minimal additives, and ingredient traceability. Free From options increasingly feature non-GMO sources, organic credentials, and certifications that appeal to niche dietary needs and wellness lifestyles. Specialty retail channels and online platforms are amplifying the visibility of innovative Free From blends, often commanding premium pricing. As regulatory pressures on health claims and food safety intensify, brands are substantiating claims with credible certifications and testing protocols, further enhancing consumer trust. The segment’s dynamic growth reflects shifting snacking behavior toward better-for-you choices and a higher willingness to pay for perceived health benefits and ingredient purity.
By Packaging: Sustainability Meets Portion Control
In 2025, glass jars dominated the trail mix packaging landscape, claiming a 58.97% share. These jars not only highlight premium blends but also emphasize ingredient transparency. Both brands and consumers cherish glass jars for their ability to communicate freshness, quality, and an upscale image on retail shelves. Notably, 42% of U.S. shoppers reuse these jars for pantry storage, underscoring their post-purchase utility and ensuring the brand's continued presence in homes. The durability and resealability of glass jars safeguard product integrity, prevent flavor loss, and encourage repeat purchases. Brands frequently utilize jar packaging for limited-edition and functional SKUs, bolstering loyalty among health-conscious and eco-aware consumers. Given their high perceived value and reusability, glass jars are pivotal in driving the expansion of the premium segment.
Pouches and sachets are rapidly gaining traction as the preferred packaging for trail mixes, largely due to eco-conscious millennials' preference for recyclable materials and the convenience of lightweight options. Their adaptable design caters to precise portion control and calorie moderation, making them attractive to both active consumers and those seeking impulse snacks. Additionally, shipper-ready pouch cases not only reduce breakage rates but also enhance fulfillment efficiency for e-grocery and direct-to-consumer channels. This has propelled the segment to grow at a 6.5% CAGR, projected through 2031. Material innovations, including biodegradable films and resealable zippers, amplify the appeal of pouches while aligning with sustainability objectives. Furthermore, pouches present brands with cost advantages, thanks to diminished transport expenses and simplified merchandising, positioning them favorably for widespread distribution. With brands increasingly focusing on marketing and flavor diversity in pouch formats, their market share is poised to rise, challenging the dominance of glass jars and rigid packaging.
By Distribution Channel: Digital Disruption Accelerates Direct Relationships
In 2025, supermarkets and hypermarkets captured 62.45% of the trail mix market share, fueled by consumers' habitual basket building and a strong preference for one-stop shopping. These retail formats leverage broad product visibility, in-store sampling, and promotional discounts, driving high-frequency purchases. Their established infrastructure, coupled with a focus on convenience and trust, solidifies their market dominance. This is further enhanced by expanding categories into health, organic, and family-size pack formats. Strategic product positioning on shelves and cross-merchandising with related snack categories bolsters the performance of these outlets. The allure of bulk buying and immediate access tempts shoppers to explore new flavors and premium blends, fostering category innovation. The expansive scale and reach of supermarkets and hypermarkets play a pivotal role in maintaining top-of-mind awareness for both established and emerging trail mix brands.
Online sales of trail mixes are surging at an impressive 7.15% CAGR, buoyed by algorithm-driven product recommendations and enticing offers like free shipping. E-commerce platforms enhance the shopping experience with features like customization, subscription services, and direct feedback, all of which drive repeat purchases. In China, the power of social-commerce is evident, with live streams reshaping consumer interactions. During the 2025 Lunar New Year week, these platforms raked in an impressive USD 82 million in trail mix sales, underscoring their immediate influence and scalability for food brands. Promotions on social media, collaborations with influencers, and engaging content—like trail mix recipes and wellness advice—create an experiential shopping journey, boosting trial rates. Furthermore, mobile applications and specialized snack delivery services provide the convenience of doorstep delivery and varied payment options, broadening consumer access in both established and developing markets. With the digital landscape evolving, online and social-commerce channels are poised to redefine benchmarks in trail mix distribution and foster deeper consumer loyalty.

Geography Analysis
In 2025, North America commanded a dominant 36.22% share of the trail mixes market. While regional brands capitalized on California's nut supply chain, water restrictions are pushing them to strategically diversify into Arizona's almond groves and pecan acreage in Mexico. This diversification is aimed at mitigating risks associated with water scarcity and ensuring a stable supply chain. Major grocers, including Walmart and Kroger, have broadened their shelf space for organic and allergen-free products, reflecting growing consumer demand for healthier and more inclusive options. These efforts contributed to a consistent 5.7% value increase for the region in 2025.
Asia-Pacific emerged as the fastest-growing region, registering a robust 7.05% CAGR through 2031, driven by urban snacking trends and increasing household incomes. In 2024, India saw an impressive 18% annual volume surge in protein-enriched mixes, fueled by collaborations with fitness clubs and government initiatives promoting plant protein. These initiatives have not only raised awareness about the health benefits of plant-based diets but also encouraged consumers to incorporate such products into their daily routines. Meanwhile, Japanese convenience stores introduced 20 g sachets priced below JPY 150 (USD 1.02), spurring adoption among office-goers by offering affordable and convenient snacking options tailored to busy lifestyles.
In Europe, stringent food-label regulations are influencing supplier strategies. Following the EU's directive for recyclable pouches by 2025/40, adoption rates have surged as companies align with sustainability goals and consumer preferences for eco-friendly packaging. Additionally, while Mediterranean crops face vulnerabilities due to climate change, Eastern European nut processors are capitalizing on these challenges, given their resilience to climate fluctuations. This shift is creating supply-arbitrage opportunities, enabling Eastern European suppliers to strengthen their market position.
Though smaller in scale, Latin America and the Middle East are witnessing double-digit growth in consumption. However, they're grappling with price sensitivity, which limits the market's potential for premium products. To counter this, local co-packing collaborations and 50-g entry packs are being introduced, aiming to ease the price perception and pave the way for premium transitions in the future. These strategies are designed to build consumer trust and gradually shift preferences toward higher-value offerings.

Competitive Landscape
The trail mixes market shows moderate fragmentation. This score hints at potential opportunities for both consolidation and the rise of niche players. While large food conglomerates utilize their expansive distribution networks and robust marketing resources to assert their market presence, specialized brands carve out premium segments. They achieve this through innovative ingredients, a strong emphasis on sustainability, and fostering direct relationships with consumers. A notable trend is the strategic focus on supply chain control. Vertical integration emerges as a key strategy, allowing players to ensure quality and manage costs, especially in the face of fluctuating prices for nuts and dried fruits.
On the technology front, there's a pronounced emphasis on optimizing the supply chain. AI-driven demand forecasting and automated packaging systems are at the forefront, slashing operational costs and enhancing product consistency. In a nod to sustainability, the USDA has allocated a significant USD 11.5 million in 2024 towards composting projects. This move bolsters circular economy initiatives, empowering manufacturers to transform production waste into valuable outputs. The result? Reduced disposal costs and a strengthened sustainability image.
As the industry grapples with tightening allergen control mandates and more rigorous organic certification processes, regulatory compliance emerges as a pivotal competitive edge. These heightened standards pose challenges, especially for smaller manufacturers. Without dedicated quality systems and testing facilities, these players find themselves at a distinct disadvantage.
Trail Mix Industry Leaders
-
PepsiCo, Inc.
-
Second Nature Brands
-
General Mills, Inc.
-
Mars, Incorporated
-
Kellanova
- *Disclaimer: Major Players sorted in no particular order

Recent Industry Developments
- April 2025: Dunkin's signature flavors inspired Kar's to unveil the Caramel Cold Brew & Frosted Donut Trail Mixes – a unique peanut blend crafted to bring the essence of Dunkin's popular drinks and donuts into a convenient snack format.
- September 2024: Forest Feast introduced three bold flavors: two sweet and one savory, designed for active lifestyles. These protein-rich mixes were crafted to provide both taste and energy boosts, catering to consumers seeking flavorful yet functional snacks.
- August 2024: Kar's Nuts debuted its Kar's Favorites Mix, featuring a blend of M&M'S milk chocolate, peanut butter, peanut candies, roasted peanuts, and dried cranberries. This mix was created to offer a balance of indulgence and nutrition, appealing to a wide range of snack enthusiasts.
- March 2024: Foods Alive launched its Bar Trail Mix, an organic blend of nuts, seeds, and dried fruits. This product was specifically designed to cater to health-conscious consumers, providing a wholesome and nutrient-dense snacking option.


Global Trail Mix Market Report Scope
A trail mix is a combination of seeds, nuts, and dried fruits that consumers prefer to consume as a snack.
The market studied has been segmented by distribution channel, & geography. By distribution channel, the market is segmented into hypermarkets/supermarkets, convenience stores, specialty stores, online retail stores, and other distribution channels. By geography, the market is segmented into North America, Europe, Asia-Pacific, South America, and the Middle East & Africa.
The market sizing has been done in value terms in USD for all the abovementioned segments.
| Nuts and Seeds |
| Dried Fruits |
| Fruit and Nut |
| Others |
| Salted |
| Plain |
| Chocolate Coated |
| Savory/Spicy |
| Others |
| Conventional |
| Free From |
| Pouches and Sachets |
| Bottles and Jars |
| Others(if any) |
| Supermarkets/Hypermarkets |
| Convenience Stores |
| Online Retail Stores |
| Other Distribution Channels |
| North America | United States |
| Canada | |
| Mexico | |
| Rest of North America | |
| Europe | Germany |
| United Kingdom | |
| France | |
| Italy | |
| Spain | |
| Russia | |
| Netherlands | |
| Poland | |
| Belgium | |
| Sweden | |
| Rest of Europe | |
| Asia-Pacific | China |
| India | |
| Japan | |
| South Korea | |
| Australia | |
| Indonesia | |
| Thailand | |
| Singapore | |
| Rest of Asia-Pacific | |
| South America | Brazil |
| Argentina | |
| Colombia | |
| Chile | |
| Peru | |
| Rest of South America | |
| Middle East and Africa | Saudi Arabia |
| United Arab Emirates | |
| Nigeria | |
| Egypt | |
| Morocco | |
| Turkey | |
| South Africa | |
| Rest of Middle East and Africa |
| By Ingredient Type | Nuts and Seeds | |
| Dried Fruits | ||
| Fruit and Nut | ||
| Others | ||
| Flavor | Salted | |
| Plain | ||
| Chocolate Coated | ||
| Savory/Spicy | ||
| Others | ||
| By Category | Conventional | |
| Free From | ||
| By Packaging | Pouches and Sachets | |
| Bottles and Jars | ||
| Others(if any) | ||
| By Distribution Channel | Supermarkets/Hypermarkets | |
| Convenience Stores | ||
| Online Retail Stores | ||
| Other Distribution Channels | ||
| By Geography | North America | United States |
| Canada | ||
| Mexico | ||
| Rest of North America | ||
| Europe | Germany | |
| United Kingdom | ||
| France | ||
| Italy | ||
| Spain | ||
| Russia | ||
| Netherlands | ||
| Poland | ||
| Belgium | ||
| Sweden | ||
| Rest of Europe | ||
| Asia-Pacific | China | |
| India | ||
| Japan | ||
| South Korea | ||
| Australia | ||
| Indonesia | ||
| Thailand | ||
| Singapore | ||
| Rest of Asia-Pacific | ||
| South America | Brazil | |
| Argentina | ||
| Colombia | ||
| Chile | ||
| Peru | ||
| Rest of South America | ||
| Middle East and Africa | Saudi Arabia | |
| United Arab Emirates | ||
| Nigeria | ||
| Egypt | ||
| Morocco | ||
| Turkey | ||
| South Africa | ||
| Rest of Middle East and Africa | ||


Key Questions Answered in the Report
How large is the trail mixes market in 2026?
The trail mixes market size is USD 10.91 billion in 2026.
What is the projected CAGR for trail mixes through 2031?
The market is forecast to grow at a 6.24% CAGR from 2026 to 2031.
Which ingredient segment commands the biggest share?
Fruit and Nut blends lead with a 50.72% trail mixes market share in 2025.
Which region grows fastest through 2031?
Asia-Pacific records the highest 7.05% CAGR across the forecast span.
Page last updated on:


