Cellular M2M Market Size and Share
Market Overview
| Study Period | 2019 - 2030 |
|---|---|
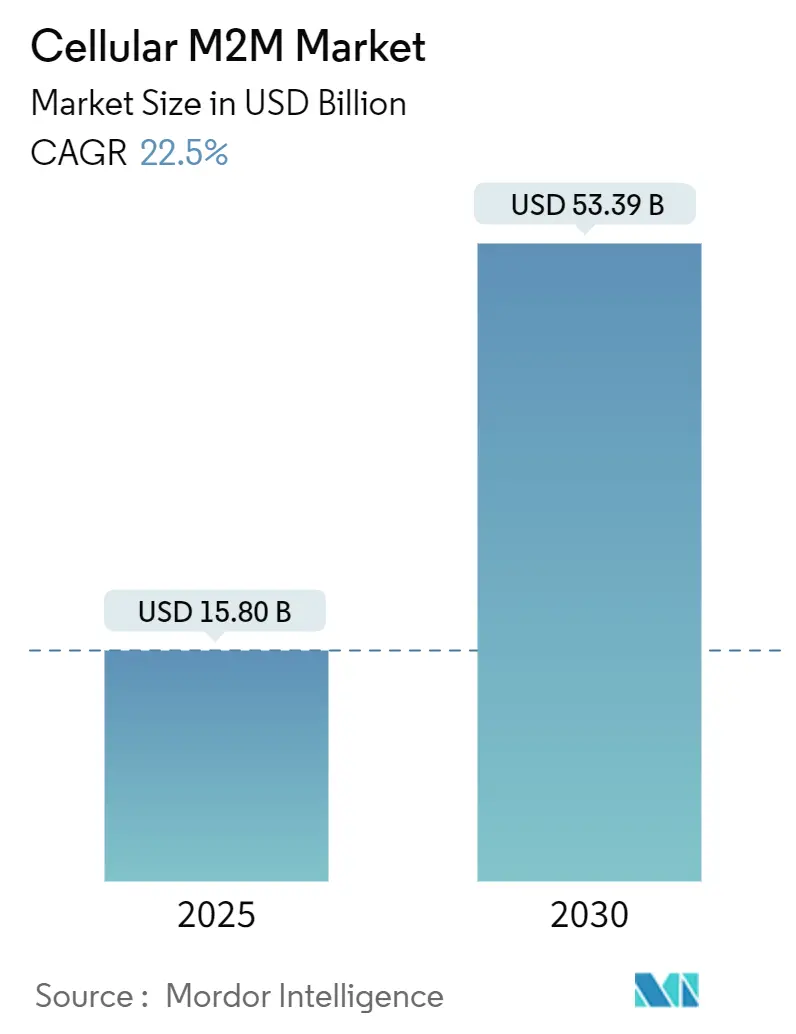
| Market Size (2025) | USD 15.80 Billion |
| Market Size (2030) | USD 53.39 Billion |
| Growth Rate (2025 - 2030) | 22.50% CAGR |
| Fastest Growing Market | Asia Pacific |
| Largest Market | North America |
| Market Concentration | Medium |
Major Players *Disclaimer: Major Players sorted in no particular order Image © Mordor Intelligence. Reuse requires attribution under CC BY 4.0. | |
Cellular M2M Market Analysis by Mordor Intelligence
The cellular M2M market size stood at USD 15.80 billion in 2025 and is forecast to reach USD 53.39 billion by 2030, advancing at a 22.50% CAGR. Strong momentum comes from falling IoT module prices, the global roll-out of LTE-M and NB-IoT, and the first wave of 5G mMTC deployments that can support 1 million devices per square kilometre. North American operators continue to anchor early revenues, while Asia-Pacific accelerates on the back of China’s multi-billion-dollar 5G-A build-out and aggressive manufacturing digitalisation targets.[1]GSMA, “eSIM for M2M,” gsma.com Across all regions, public-sector smart-infrastructure funding, eSIM remote provisioning, and direct-to-device satellite links widen addressable use cases and temper the risk of coverage gaps. Competitive intensity remains moderate as network operators, module makers, and platform vendors pivot toward integrated offerings that bundle connectivity, device management, cybersecurity, and analytics under a single commercial model.
Key Report Takeaways
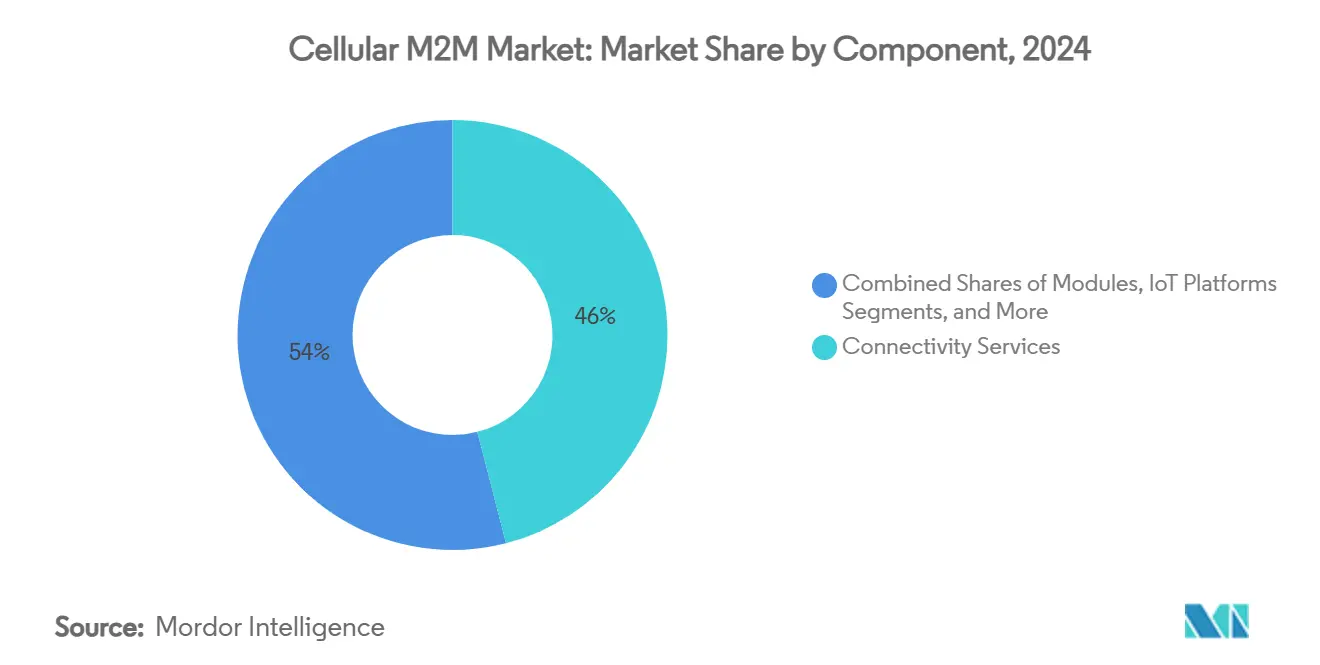
- By component, connectivity services led with 46% revenue share in 2024; IoT platforms are projected to expand at a 23.50% CAGR to 2030.
- By application, asset tracking and logistics captured 28% of the cellular M2M market share in 2024; smart utilities and metering is advancing at a 24.24% CAGR through 2030.
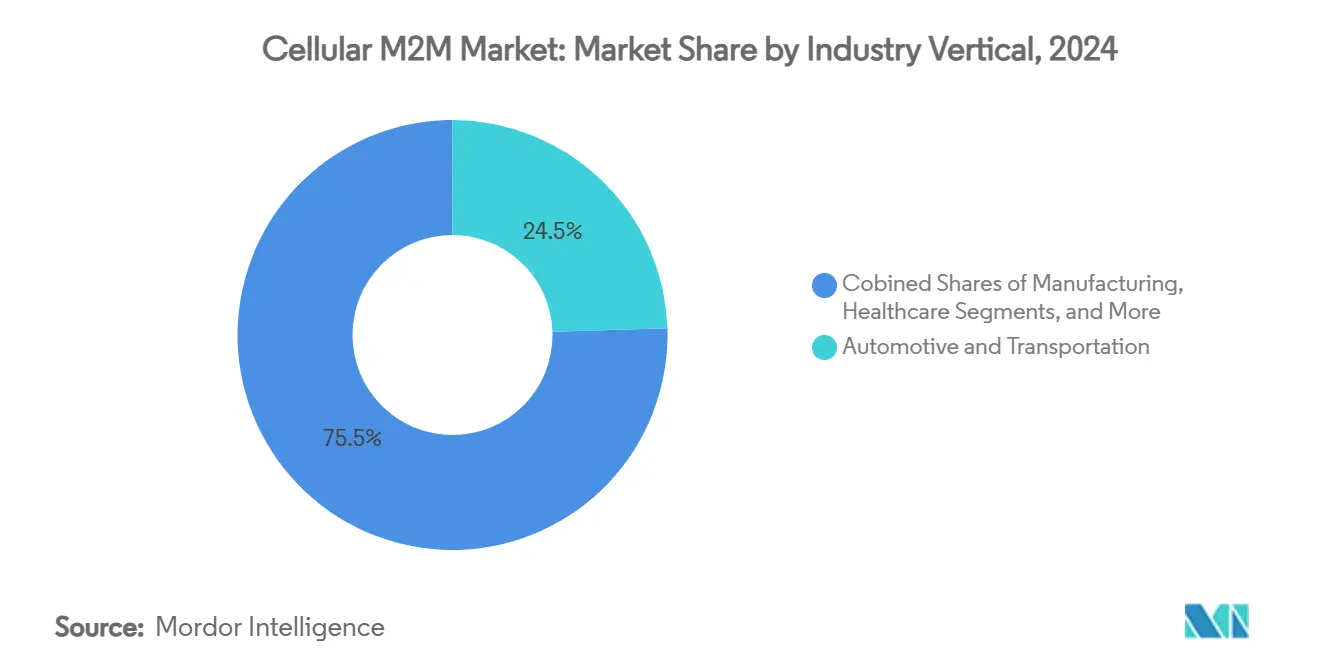
- By industry vertical, automotive and transportation accounted for 24.50% of the cellular M2M market size in 2024, while smart cities and infrastructure is growing at a 24.18% CAGR to 2030.
- By network technology, LTE-M and NB-IoT combined for a 38% share of the cellular M2M market in 2024; 5G climbs fastest at a 23.75% CAGR.
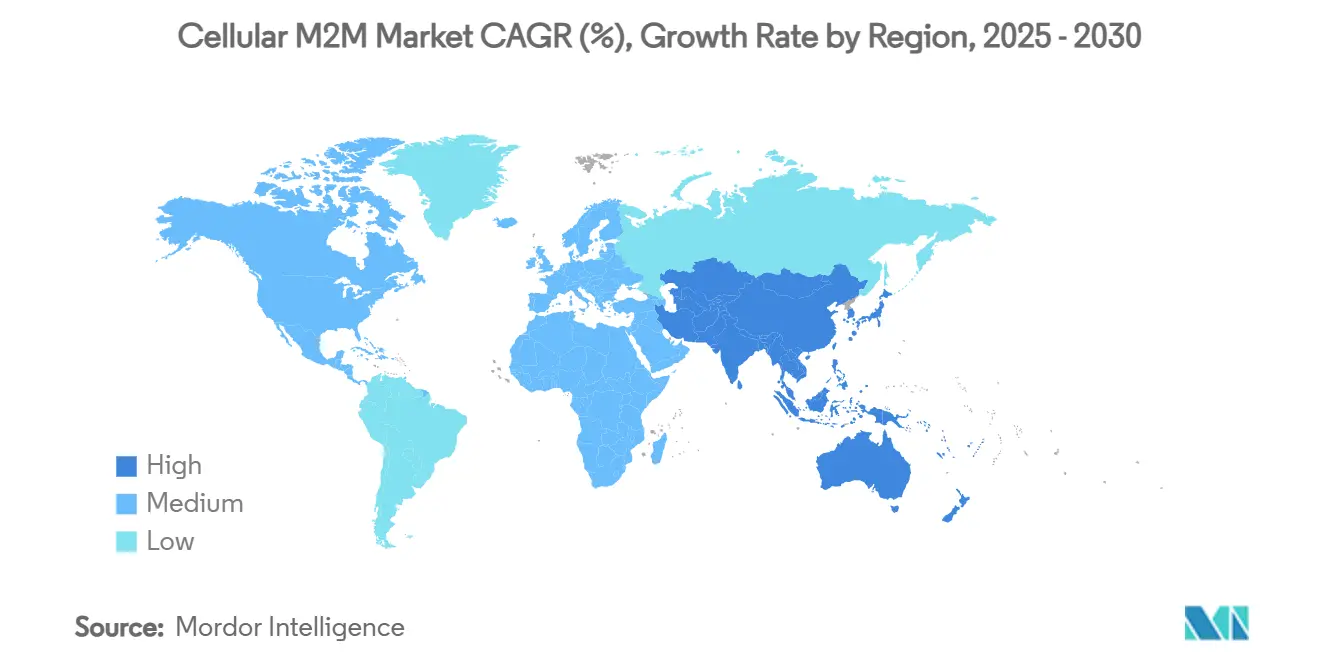
- By geography, North America held 28% market share in 2024; Asia-Pacific is poised to grow at a 23.05% CAGR between 2025 and 2030.
Global Cellular M2M Market Trends and Insights
Drivers Impact Analysis*
| Driver | (~) % Impact on CAGR Forecast | Geographic Relevance | Impact Timeline |
|---|---|---|---|
| Rapid decline in IoT module prices | +3.2% | Global (strongest in APAC) | Medium term (2–4 years) |
| Expansion of 4G LTE-M and NB-IoT networks | +4.1% | North America and Europe lead | Short term (≤ 2 years) |
| Government smart-infrastructure initiatives | +2.8% | North America and EU | Long term (≥ 4 years) |
| Emergence of 5G mMTC capability | +5.3% | China leads | Medium term (2–4 years) |
| eSIM remote-provisioning unlocks multi-carrier M2M | +3.7% | Global developed markets | Short term (≤ 2 years) |
| Direct-to-device satellite–cellular convergence | +2.9% | Remote and maritime zones | Long term (≥ 4 years) |
| Source: Mordor Intelligence | |||
Rapid decline in IoT module prices
Sustained price compression for LTE and 5G hardware lowers entry costs across price-sensitive tasks such as mass-deployed smart meters and asset tags, enabling deployments that previously failed to clear budget hurdles. Module makers achieve scale efficiencies through consolidated manufacturing and 3GPP standardisation, while the move from physical SIMs to eSIM cuts logistics costs and permits mid-life operator switching. Enterprises increasingly lock connectivity and hardware into multiyear service bundles that stabilise total cost of ownership and support roll-outs running into millions of end points. The continuing fall in bill-of-materials therefore enlarges the cellular M2M market and pushes it deeper into utilities, agriculture, and smart building niches.
Expansion of 4G LTE-M and NB-IoT networks
More than 120 commercial LPWAN deployments now span 85 NB-IoT and 36 LTE-M footprints, giving solution providers guaranteed international roaming coverage at battery lives of up to 10 years. Operators differentiate tariffs by bandwidth, latency, and mobility profiles so customers can match service levels to use-case needs without over-spending. Dense urban coverage allows city projects to approach the theoretical mMTC limit of 1 million connections per square kilometre, while deep-indoor signal penetration supports smart-meter installations in basements. Roaming agreements exceeding 600 partner networks, such as those managed by Deutsche Telekom, neutralise the historic complexity of shipping connected goods across border.[2]Deutsche Telekom, “Expands Global IoT Business,” telekom.com
Government smart-infrastructure initiatives
National and municipal grants convert long-term urban modernisation goals into near-term procurement budgets, ensuring anchor volumes for carriers and module makers. The U.S. SMART grants back connected traffic systems that feed real-time data into city dashboards. In Europe, the UK’s Smart Infrastructure Pilots Programme finances multifunction lamp-posts that double as 5G small cells and EV charging points. China’s top-down targets for 10,000 5G-ready factories by 2027 push ministries and city governments to subsidise private cellular networks. Public tenders mandate open standards, which in turn accelerate solution interoperability and encourage ecosystem investment across the cellular M2M market.
Emergence of 5G mMTC capability
3GPP Release 17 introduces RedCap devices that reduce cost and complexity compared to standard 5G silicon while retaining sufficient throughput for mid-tier IoT tasks, and Release 18 adds even leaner eRedCap profiles. China Mobile has already upgraded hundreds of thousands of base stations and signed up millions of 5G-A users, signalling a volume inflection point that drives economy-of-scale into the component chain. Network slicing lets operators dedicate partitions to low-latency factory automation or high-density sensor swarms, insulating service-level agreements from public traffic surges. Edge compute nodes trim backhaul costs and allow closed-loop control in under 10 milliseconds, broadening the cellular M2M market beyond non-critical telemetry.
Restraints Impact Analysis*
| Restraint | (~) % Impact on CAGR Forecast | Geographic Relevance | Impact Timeline |
|---|---|---|---|
| Cyber-security and data-privacy concerns | –2.4% | Global, with stricter impact in EU and developed markets | Short term (≤ 2 years) |
| Sunsetting of 2G/3G networks raises capex burden | –3.1% | Global, with varying timelines by region | Medium term (2–4 years) |
| Fragmented global permanent-roaming regulations | –1.8% | Global, with particular complexity in cross-border deployments | Long term (≥ 4 years) |
| Scarcity of skilled cellular-IoT integration talent | –2.2% | North America and EU primarily, emerging in APAC | Medium term (2–4 years) |
| Source: Mordor Intelligence | |||
Cyber-security and data-privacy concerns
High-profile modem flaws, such as vulnerabilities found in Cinterion chipsets, raise board-level anxiety about IoT attack surfaces. Europe’s GDPR and upcoming Cyber Resilience Act impose heavy fines for breaches, pushing enterprises to demand zero-trust architectures and hardware-rooted security. Manufacturers Alliance guidance calls for threat modelling that treats operational technology and information technology as a single security domain. Smaller organisations struggle to fund the necessary skill sets, leading many to outsource to managed security service providers bundled with connectivity. The resulting due-diligence cycles elongate sales funnels and can delay large roll-outs, especially in utilities and healthcare.
Sunsetting of 2G/3G networks raises capex burden
More than 50 legacy networks will shut by 2025, forcing device refreshes long before originally budgeted end-of-life dates. AT&T’s imminent NB-IoT shutdown illustrates how even relatively new LPWAN services can be retired in favour of LTE-M or 5G RedCap. Utilities with meter fleets designed for 15-year lifespans face truck-roll costs and inventory write-downs, while global brands must navigate different sunset calendars in each country. The GSMA NG.121 guideline helps operators coordinate migration but cannot erase capex already sunk into retiring technology. Although the transition ultimately boosts performance, near-term budget reallocations can freeze new project approvals and shrink the cellular M2M market during migration windows.
*Our forecasts treat driver/restraint impacts as directional, not additive. The impact forecasts reflect baseline growth, mix effects, and variable interactions.
Segment Analysis
By Component: Connectivity Services Drive Revenue Growth
Connectivity services commanded 46% market share in 2024, underscoring the premium that enterprises place on predictable, SLA-backed data links and the ability to scale devices without renegotiating contracts. Deutsche Telekom packages LTE-M, NB-IoT, 4G, and 5G under a single management portal that spans more than 600 roaming partners, bringing enterprise billing and policy enforcement into one pane of glass. Recurring service charges smooth carrier cash flows, while APIs expose billing, diagnostics, and security controls for integration into customer back-ends. The cellular M2M market benefits when operators pair these controls with tiered service levels that match application latency and power budgets.
IoT platforms post the fastest component growth at a 23.50% CAGR as buyers look for lifecycle portals that ingest data, run analytics, and push over-the-air firmware in one workflow. Pay-as-you-grow pricing attracts start-ups with a handful of proof-of-concept devices and then scales to millions of endpoints without forklift upgrades. Professional and managed services ride this wave by filling integration and security skill gaps, especially where customers lack in-house DevOps teams. By contrast, module revenues lag as competition and silicon learning curves continue to compress average selling prices, though cost declines keep the cellular M2M market accessible for price-sensitive applications.


By Application: Asset Tracking Leads Market Penetration
Asset tracking and logistics applications captured 28% of the cellular M2M market size in 2024, driven by e-commerce delivery guarantees, cold-chain monitoring, and supply-chain visibility mandates. The pandemic highlighted the cost of lost or late shipments, prompting shippers to embed multi-mode trackers that switch between cellular, Wi-Fi, and GNSS, as demonstrated by Link Labs’ AirFinder Everywhere solution. For global containers and aviation pallets, cellular roaming ensures live location updates without manual re-configuration, reducing demurrage charges and theft risk. Analytics engines combine geofencing and climate data to flag excursions, while APIs feed ERP systems that trigger automated claims processing.
Smart utilities and metering is the fastest-growing application, advancing at a 24.24% CAGR as regulators push for time-of-use tariffs and outage automation. Honeywell’s decision to embed Verizon 5G connectivity in its next-generation electric meters illustrates a broader shift toward higher bandwidth devices that deliver firmware updates and predictive analytics to utilities.[3]Honeywell, “Modernises Energy Grid With Verizon 5G,” honeywell.com Lifetime data plans, secured boot, and network-slicing options reassure utility boards that new meters will remain operational through technology refresh cycles. Industrial automation, vehicle telematics, and consumer wearables add further momentum, allowing vendors to cross-sell connectivity layers that bundle SIM management, cybersecurity, and data lakes into one bill—a model that continues to widen the cellular M2M market.
By Industry Vertical: Automotive Maintains Leadership Position
Automotive and transportation accounted for 24.50% of the cellular M2M market share in 2024, reflecting mandatory e-call regulations, fleet management ROI, and the march toward autonomous driving. Tier-one OEMs increasingly negotiate multi-country eSIM contracts so vehicles never roam out of coverage, protecting safety-critical services such as remote diagnostics and over-the-air software updates. The cellular M2M market gains further lift from insurance telematics programmes that reward safe driving, sharing anonymised data streams with underwriters after driver opt-in.
Smart cities and infrastructure outpace all other verticals with a 24.18% CAGR through 2030, buoyed by stimulus packages for sustainable street lighting, dynamic parking, and environmental sensing. City authorities turn to cellular connectivity because budget cycles align better with service subscriptions than with capital-heavy fibre builds. Private-public partnerships allow operators to frontload network densification in return for anchor tenancy, accelerating 5G small-cell roll-outs. Manufacturing, healthcare, and energy each contribute steady gains by embedding private LTE or 5G into plant floors, hospitals, and substations, further diversifying the cellular M2M industry revenue base.
By Network Technology: LTE-M and NB-IoT Dominate Current Deployments
LPWAN technologies—specifically LTE-M and NB-IoT—held 38% market share in 2024 by offering multi-year battery life, resilient indoor coverage, and module prices under USD 5 in high volumes. Operators pitch a smooth migration to 5G RedCap, which keeps RF front-ends and antennas largely unchanged yet unlocks burst rates up to 85 Mbps when firmware downloads or video feeds require extra bandwidth. This tiered roadmap reassures buyers that devices deployed today will not be stranded by spectrum re-farming.
5G mMTC records the steepest climb at a 23.75% CAGR, riding on guaranteed quality-of-service slices that satisfy stringent jitter budgets in robotics, AR/VR maintenance, and smart grids. Early adopters leverage device-twin models at the edge to close control loops under 10 milliseconds, impossible on best-effort public networks. Satellite-cellular hybrids fill rural and maritime gaps without duplicating modems, thanks to Release-17 NTN support. As a result, technology choice is less a fork in the road and more a spectrum of service tiers within one converged cellular M2M market.
Geography Analysis
North America retained 28% market share in 2024 on the back of dense LTE-M and NB-IoT footprints, spectrum policies that favour low-band 5G for coverage, and federal grants that de-risk smart-infrastructure pilots. Rogers Communications recently launched a satellite-to-mobile text service covering over 5.4 million km², proving that hybrid networks can reach Canada’s sparsely populated provinces without prohibitive tower deployments.[4]Rogers Communications, “Satellite-to-Mobile Service,” rogers.com Private CBRS networks give factories and utilities a self-managed alternative to public slices, often coupled with edge compute nodes that host latency-sensitive analytics.
Asia-Pacific is the fastest-growing region at a 23.05% CAGR through 2030. China leads with a USD 3 billion 5G-A expansion that spans 300 cities and aims for 10,000 smart factories by 2027. Japan’s NTT Docomo and South Korea’s SK Telecom jointly test in-network AI that accelerates video analytics for upcoming 6G services, setting performance benchmarks for industrial robotics. India follows with Digital India incentives and partnerships such as Airtel–Ericsson 5G Core, bringing Standalone architecture to populous manufacturing clusters. The regional push for industrial automation, coupled with low module prices, enlarges the cellular M2M market far beyond consumer handset connectivity.
Europe enjoys steady, policy-led growth anchored by rigorous data-protection laws and climate goals. Deutsche Telekom maintains 99% LTE-M and NB-IoT coverage in Germany and extends reach to 35 partner networks via the Bridge Alliance. The UK backs smart street-lamps that host 5G small cells and EV chargers under its Smart Infrastructure Pilots Programme. Cross-border truck telematics benefit from tariff-free roaming within the EU and harmonised eCall mandates. Strong privacy regulation raises compliance costs but also creates a premium segment for secure-by-design solutions, reinforcing Europe’s role as a quality benchmark in the cellular M2M industry.

Competitive Landscape
The cellular M2M market is moderately concentrated: global operators control spectrum assets, yet hardware makers and platform vendors introduce differentiation through satellite support, API exposure, and cybersecurity certifications. Telit Cinterion’s partnership with floLIVE and Skylo fuses NTN and terrestrial coverage into one profile, chasing customers that cannot stomach downtime in mining, maritime, or defence. u-blox collaborates with Wireless Logic to roll out cloud-based eSIM orchestration, signalling that connectivity decisions are shifting from hardware-locked to software-driven.
Incumbent vendors such as Ericsson, Nokia, and Huawei emphasise network APIs that expose quality-of-service controls and location insights to developers. Ericsson predicts network programmability could open USD 10–30 billion in direct API revenue plus up to USD 300 billion in value-added connectivity by 2030. For enterprises, the draw lies in automating SIM swaps, traffic pacing, and anomaly detection through familiar cloud toolchains. The competition therefore moves from raw bandwidth to developer experience and ecosystem lock-in.
The looming 2G/3G sunset triggers both churn and consolidation. Operators that can shepherd customers onto LTE-M or 5G RedCap without truck rolls win share; those that retire services abruptly face backlash, as seen with AT&T’s NB-IoT exit. Private network integrators target factories, ports, and campuses that need deterministic latency and on-premise data sovereignty. In parallel, hyperscalers position edge nodes inside telco facilities, blurring the line between cloud and network and reshaping the cellular M2M market’s competitive map.
Cellular M2M Industry Leaders
AT&T Inc.
Verizon Communications Inc.
Vodafone Group Plc
Deutsche Telekom AG
Telefónica, S.A.
- *Disclaimer: Major Players sorted in no particular order

Recent Industry Developments
- July 2025: Rogers Communications launched Canada’s first satellite-to-mobile text service, extending emergency and messaging coverage to 5.4 million km² of remote territory.
- July 2025: Ericsson posted Q2 2025 results with 2% sales growth and record 13.2% adjusted EBITA margin, citing 160 million fixed-wireless access users as evidence of soaring IoT traffic.
- June 2025: Rogers Communications activated Ericsson 5G Advanced equipment, the first commercial deployment in Canada, improving throughput and latency for industrial IoT clients.
- June 2025: China’s three national operators invested USD 3 billion in 5G-A expansion across 300 cities, adding more than 400,000 upgraded base stations.


Global Cellular M2M Market Report Scope
| Modules (2G/3G, 4G LTE, 5G, LPWA) |
| Connectivity Services |
| IoT Platforms (CMP, AEP) |
| Professional and Managed Services |
| Asset Tracking and Logistics |
| Smart Utilities and Metering |
| Industrial Automation |
| Vehicle Telematics and Fleet Management |
| Safety and Surveillance |
| Consumer Electronics and Wearables |
| Other Applications |
| Automotive and Transportation |
| Energy and Utilities |
| Manufacturing |
| Healthcare |
| Retail and POS |
| Agriculture |
| Smart Cities and Infrastructure |
| Other Industry Verticals |
| 2G/3G |
| 4G LTE |
| LTE-M and NB-IoT (LPWAN) |
| 5G (eMBB and mMTC) |
| Satellite-Cellular Hybrid (NTN) |
| North America | United States |
| Canada | |
| Mexico | |
| South America | Brazil |
| Argentina | |
| Rest of South America | |
| Europe | Germany |
| United Kingdom | |
| France | |
| Italy | |
| Russia | |
| Rest of Europe | |
| Asia-Pacific | China |
| Japan | |
| India | |
| South Korea | |
| Australia | |
| Rest of Asia-Pacific | |
| Middle East and Africa | GCC Countries |
| Turkey | |
| Rest of Middle East | |
| Africa | South Africa |
| Rest of Africa |
| By Component | Modules (2G/3G, 4G LTE, 5G, LPWA) | |
| Connectivity Services | ||
| IoT Platforms (CMP, AEP) | ||
| Professional and Managed Services | ||
| By Application | Asset Tracking and Logistics | |
| Smart Utilities and Metering | ||
| Industrial Automation | ||
| Vehicle Telematics and Fleet Management | ||
| Safety and Surveillance | ||
| Consumer Electronics and Wearables | ||
| Other Applications | ||
| By Industry Vertical | Automotive and Transportation | |
| Energy and Utilities | ||
| Manufacturing | ||
| Healthcare | ||
| Retail and POS | ||
| Agriculture | ||
| Smart Cities and Infrastructure | ||
| Other Industry Verticals | ||
| By Network Technology | 2G/3G | |
| 4G LTE | ||
| LTE-M and NB-IoT (LPWAN) | ||
| 5G (eMBB and mMTC) | ||
| Satellite-Cellular Hybrid (NTN) | ||
| By Geography | North America | United States |
| Canada | ||
| Mexico | ||
| South America | Brazil | |
| Argentina | ||
| Rest of South America | ||
| Europe | Germany | |
| United Kingdom | ||
| France | ||
| Italy | ||
| Russia | ||
| Rest of Europe | ||
| Asia-Pacific | China | |
| Japan | ||
| India | ||
| South Korea | ||
| Australia | ||
| Rest of Asia-Pacific | ||
| Middle East and Africa | GCC Countries | |
| Turkey | ||
| Rest of Middle East | ||
| Africa | South Africa | |
| Rest of Africa | ||


Key Questions Answered in the Report
What is the projected value of the cellular M2M market by 2030?
The market is forecast to reach USD 53.39 billion by 2030, growing at a 22.50% CAGR.
Which region is expanding fastest in cellular M2M deployments?
Asia-Pacific records the highest growth, posting a 23.05% CAGR on the back of China’s large-scale 5G-A roll-out and manufacturing digitalisation.
Why are LTE-M and NB-IoT still dominant despite 5G availability?
Their long battery life, low module cost, and extensive roaming coverage keep them ideal for mass-deployed sensors, while 5G targets ultra-low-latency or high-density applications.
How does eSIM benefit multinational IoT projects?
GSMA SGP.32 eSIM lets devices switch carriers over the air, removing the need for physical SIM swaps and harmonising connectivity contracts across regions.
What challenges arise from shutting down 2G and 3G networks?
Enterprises must replace or retrofit legacy devices sooner than planned, incurring unexpected capex and navigating different sunset timelines in each country.
Which vertical is set to grow quickest through 2030?
Smart cities and infrastructure leads with a forecast 24.18% CAGR as governments fund connected lighting, EV charging, and environmental monitoring initiatives.
Page last updated on:


