Small Cell Networks Market Size and Share
Market Overview
| Study Period | 2020 - 2031 |
|---|---|
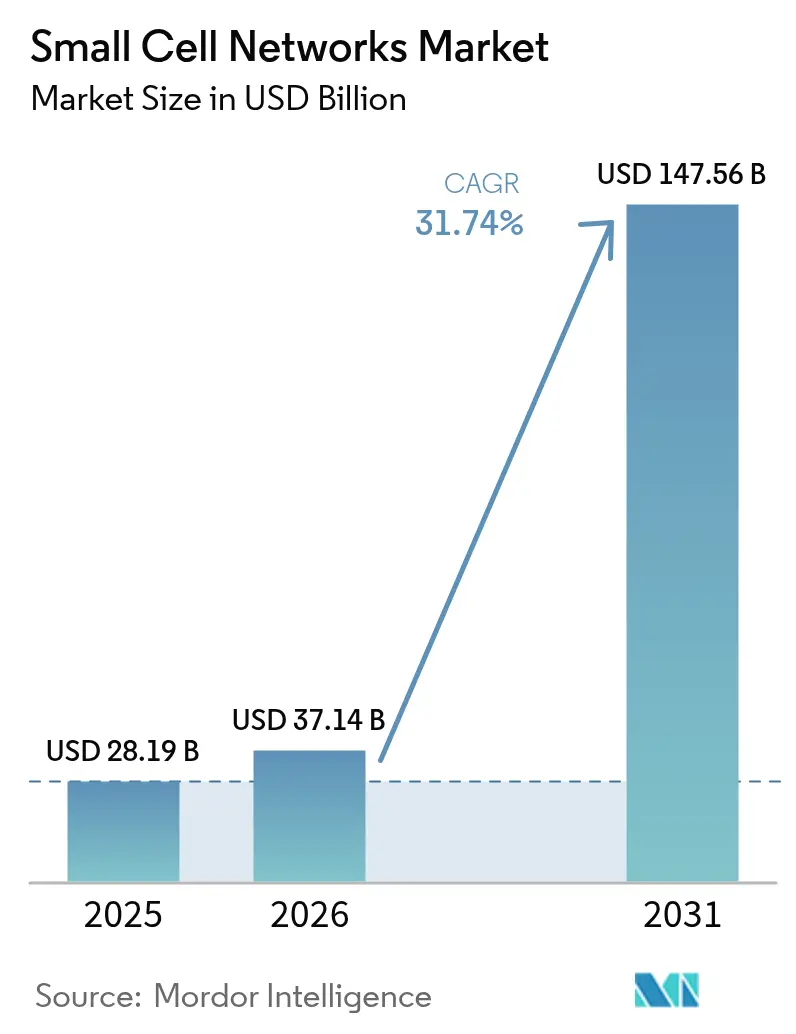
| Market Size (2026) | USD 37.14 Billion |
| Market Size (2031) | USD 147.56 Billion |
| Growth Rate (2026 - 2031) | 31.74% CAGR |
| Fastest Growing Market | Asia-Pacific |
| Largest Market | North America |
| Market Concentration | Medium |
Major Players *Disclaimer: Major Players sorted in no particular order Image © Mordor Intelligence. Reuse requires attribution under CC BY 4.0. | |
Small Cell Networks Market Analysis by Mordor Intelligence
Small cell networks market size in 2026 is estimated at USD 37.14 billion, growing from 2025 value of USD 28.19 billion with 2031 projections showing USD 147.56 billion, growing at 31.74% CAGR over 2026-2031. Rising mobile-data volumes, the transition to higher-frequency 5G bands, and supportive spectrum policies have moved small cells from niche solutions to core network assets. Carriers now treat densification as a necessity because millimeter-wave and mid-band signals attenuate rapidly, especially indoors, where more than 80% of traffic originates.[1]Ericsson, “5G Indoor Coverage – Small Cell Solutions,” ericsson.com Early wins with shared and neutral-host models are lowering ownership costs, while AI-enabled self-optimizing features are cutting energy use by up to 45% relative to traditional distributed antenna systems. Consolidation is intensifying as incumbents seek scale advantages ahead of the AWS-3 auction mandated for completion by June 2026, a sale projected to redirect USD 3 billion–4.5 billion of mid-band spectrum into commercial hands.
Key Report Takeaways
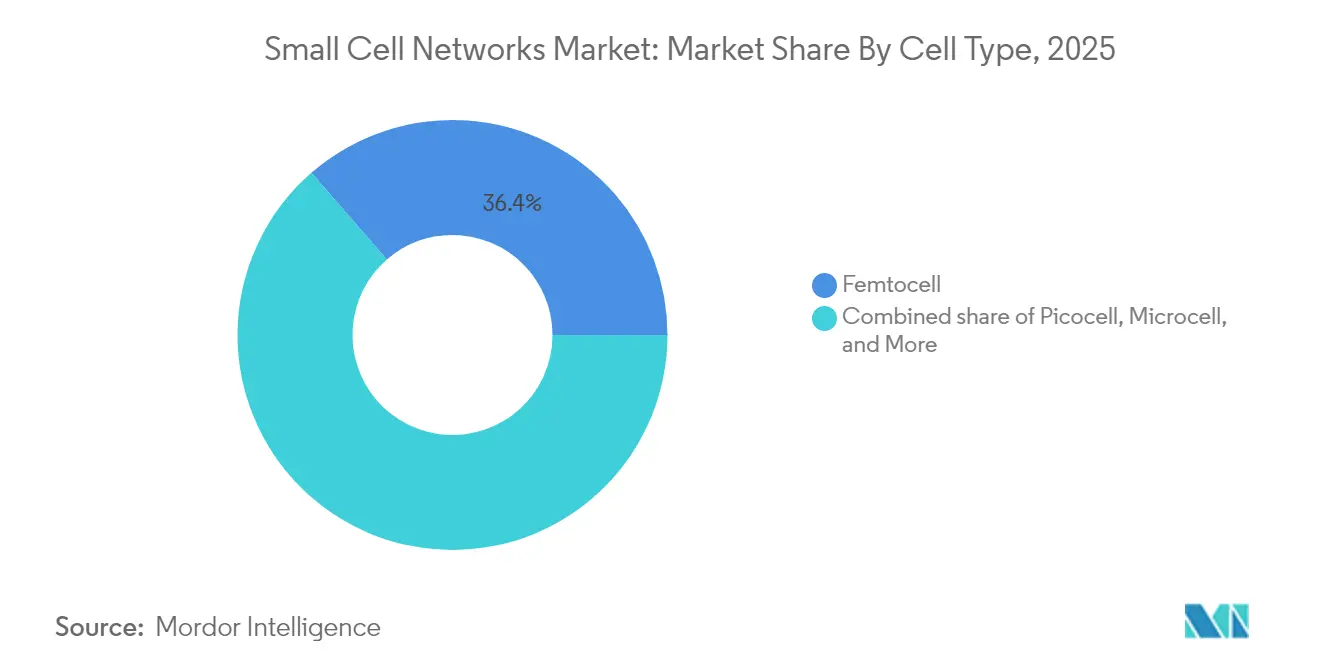
- By cell type, femtocells led with 36.40% of small cell networks market share in 2025; microcells are set to post the fastest 33.75% CAGR through 2031.
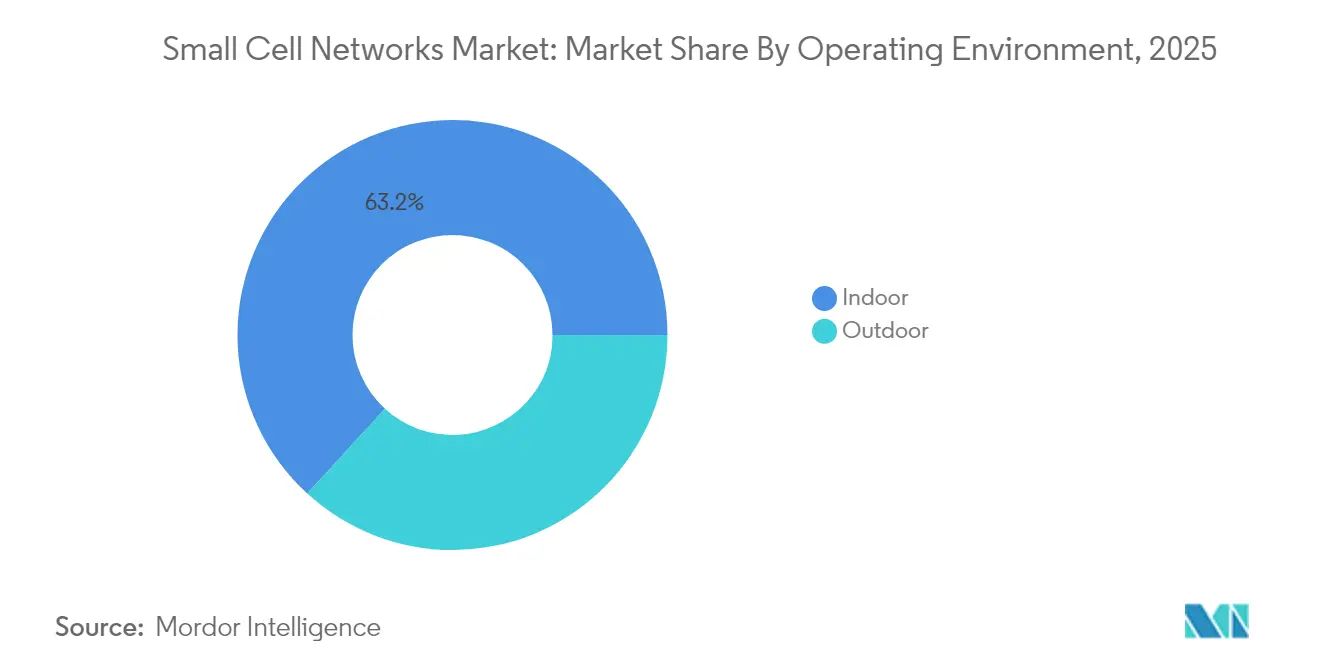
- By operating environment, indoor deployments accounted for 63.20% share of the small cell networks market in 2025, whereas outdoor sites are projected to advance at 36.20% CAGR up to 2031.
- By end-user vertical, IT & telecom held 31.60% share of the small cell networks market in 2025; smart city & government applications are primed for a 34.85% CAGR to 2031.
- By geography, North America commanded 34.20% of the small cell networks market share in 2025, while Asia Pacific is on track for a 36.95% CAGR to 2031.
Note: Market size and forecast figures in this report are generated using Mordor Intelligence’s proprietary estimation framework, updated with the latest available data and insights as of 2026.
Global Small Cell Networks Market Trends and Insights
Drivers Impact Analysis*
| Restraint | (~) % Impact on CAGR Forecast | Geographic Relevance | Impact Timeline |
|---|---|---|---|
| Complex site-acquisition and municipal permitting | -3.7% | Global dense cities | Short term (≤ 2 years) |
| Backhaul fibre / power availability gaps | -2.9% | Emerging markets & rural zones | Medium term (2-4 years) |
| RF front-end chipset export controls and supply risk | -2.1% | Cross-border supply chains | Medium term (2-4 years) |
| Rising energy-efficiency compliance costs | -1.8% | Europe, North America, advanced APAC | Long term (≥ 4 years) |
| Source: Mordor Intelligence | |||


5G spectrum auctions accelerate network densification
Mid-band allocations are unlocking the spectral headroom needed for 5G. Independent economic modelling shows that every extra 100 MHz could add USD 264 billion to GDP.[2]CTIA, “The Economic Impact of Allocating Mid-Band Spectrum to Mobile,” ctia.org The forthcoming AWS-3 sale will reinforce this effect. Faster permitting has trimmed U.S. approval cycles from several years to months, enabling operators to scale from macro sites to thousands of street-level nodes per city. Because millimeter-wave signals decay sharply, achieving contiguous coverage can demand up to 10 times more small cells than legacy macrocells, driving orders for compact radios and integrated antennas.
Mobile-data explosion drives adoption
Annual traffic is rising 20%, and 5G will carry 75% of bits by 2029, according to Ericsson. Streaming UHD video, XR content, and cloud gaming create hotspot demand profiles that strain sectorized macros. Targeted clusters of small cells deliver localized capacity without full-scale overlays, enabling operators to throttle capex while preserving user experience. Deployments have already quadrupled over the past decade; industry associations expect an eight-fold increase in the next ten years.[3]5G Americas, “Small Cell Siting Challenges & Recommendations,” 5gamericas.org
Enterprise private networks create new growth vectors
Industrial sites, hospitals and logistics hubs are adopting spectrum-sharing regimes such as CBRS to spin up private 5G. Early U.S. proofs of concept are now entering production, with brands in retail, automotive and aviation citing deterministic latency and improved security as decisive advantages. Small cells—often integrated with on-premise edge platforms—form the radio underpinning for AGV control, real-time analytics and immersive training.
Neutral-host models transform deployment economics
Shared infrastructure lets property owners host one grid of radios that supports multiple carriers, trimming total cost of ownership by up to 80% compared with separate in-building systems, according to Ericsson. Financing momentum is evident: a leading neutral-host provider secured USD 1.2 billion to scale U.S. venues in 2025.[4]Boldyn Networks, “Neutral Host Providers,” boldyn.com The concept is spreading to transport hubs, stadiums, and high-rise complexes where single-operator economics rarely work.
Restraints Impact Analysis*
| Restraint | (~) % Impact on CAGR Forecast | Geographic Relevance | Impact Timeline |
|---|---|---|---|
| Complex site-acquisition and municipal permitting | -3.7% | Global dense cities | Short term (≤ 2 years) |
| Backhaul fibre / power availability gaps | -2.9% | Emerging markets & rural zones | Medium term (2-4 years) |
| RF front-end chipset export controls and supply risk | -2.1% | Cross-border supply chains | Medium term (2-4 years) |
| Rising energy-efficiency compliance costs | -1.8% | Europe, North America, advanced APAC | Long term (≥ 4 years) |
| Source: Mordor Intelligence | |||
Regulatory hurdles impede deployment velocity
Even after federal streamlining, local rules vary widely. Historic districts often impose design reviews, stretching approvals to 12-24 months and inflating construction budgets. Roughly 20 U.S. states now have small-cell statutes, yet inconsistent interpretation complicates multi-state builds. Operators are standardizing pole-top enclosures and leveraging street furniture leases to shorten cycles, but friction remains a brake on outdoor rollout.
Semiconductor supply constraints threaten scaling
Lead times for RF front-end parts remain 26–52 weeks, according to a major electronics manufacturer, according to Jabil. Export controls have tightened access to advanced chipsets, pushing vendors to diversify foundry partners. Component scarcity lifted radio unit prices nearly 30% between 2023 and 2024, forcing carriers to phase projects and prioritize high-revenue zones while waiting for domestic fab capacity funded under the U.S. CHIPS Act to come online.
*Our forecasts treat driver/restraint impacts as directional, not additive. The impact forecasts reflect baseline growth, mix effects, and variable interactions.
Segment Analysis
By Cell Type: Microcells redefine urban coverage
Femtocells captured 36.40% of 2025 revenue, reflecting their affordability for homes and small offices. They handle up to six users within roughly 60 feet, making them the go-to for spot indoor remediation. Yet microcells are slated to grow fastest at 33.75% CAGR, benefiting from an ability to serve 200 users across 1,000 feet—ideal for dense shopping streets and transit stations. The small cell networks market size for the microcell tier is expected to expand swiftly as carriers combine these nodes with edge compute to support latency-sensitive use cases. Radio designs are also converging with Open RAN standards, enabling multi-vendor ecosystems that reduce lock-in and accelerate innovation.
Compatibility upgrades in picocells—covering 750 feet for mid-sized venues—are unlocking new enterprise contracts, while metrocells are rolling out along arterial roads to smooth hand-offs at pedestrian level. Indoor radio-dot architectures have passed 120 operators and deliver macro-parity speeds with minimal on-site equipment. Collectively, these trends underscore how the small cell networks market is becoming a multi-layered ecosystem rather than a single-device proposition.


By Operating Environment: Outdoor densification gains pace
Indoor systems held 63.20% of 2025 revenue as energy-efficient construction materials hinder macro penetration. Low-E glass and reinforced concrete create Faraday-like enclosures, compelling property owners to deploy dedicated radios that support enterprise mobility, IoT sensors and emergency services. Because more than four-fifths of data sessions start indoors, operators prioritize offices, hospitals and transportation hubs for early builds.
Outdoor deployments, however, will outstrip 36.20% CAGR through 2031 as mid-band 5G migrates from central business districts to suburbs. Forward-looking municipalities are integrating radios into smart streetlights, traffic signals and bus shelters—reducing both visual clutter and permitting obstacles. The small cell networks market size tied to outdoor infrastructure is projected to benefit from autonomous vehicle trials and citywide XR applications that need uniform millisecond latency. As spectrum auctions open additional bands, carriers are seizing the opportunity to overlay macro grids with tight canopies of outdoor nodes, ensuring seamless hand-offs and raising average downlink speeds.
By End-user Vertical: Smart cities set the innovation agenda
IT & telecom operators accounted for 31.60% revenue in 2025 as they race to unlock 5G monetization. Tier-1 carriers are targeting 70% of traffic to traverse open-capable platforms by 2026, a strategy that favors modular small cells for agile upgrades. Integration with massive-MIMO macrocells creates a layered architecture where capacity is dynamically steered to hotspots.
Municipal smart-city initiatives will post the fastest 34.85% CAGR. Cities deploy curbside radios to underpin intelligent transport systems that reduce congestion and emissions. Case studies show adaptive signal timing can cut travel times and lower particulate pollution. Regulatory frameworks in Japan, Singapore, and Hong Kong already encourage mounting on lampposts and traffic lights, accelerating the rollout . Parallel momentum in healthcare, retail, and utilities illustrates how the small cell networks market is broadening far beyond its telecom origins.
Geography Analysis
North America held 34.20% revenue in 2025, anchored by early C-band auctions and federal siting reforms. The United States alone counted more than 452,000 outdoor nodes by 2022 and is budgeted to invest USD 9 billion via the 5G Fund for Rural America to expand beyond metro cores. A landmark USD 14 billion modernization project is replacing legacy basebands with open-architecture radios, illustrating carrier commitment to vendor diversity.
Asia Pacific is projected to deliver a 36.95% CAGR, the steepest regional trajectory. China has deployed more than 500,000 5G base stations, and India’s Digital Communications Policy is easing right-of-way barriers nationwide. The regional mobile ecosystem added USD 880 billion to GDP in 2023, underscoring economic stakes. Flagship indoor small-cell implementations—such as KT’s Radio Dot roll-out for smart offices—demonstrate the business case for enterprise-grade indoor coverage.
Europe emphasizes sustainability, pursuing solutions that cut site energy by up to 45%. National roadmaps—Germany’s 5G Strategy being an example—prioritize tight-grid small cells to support automated driving and Industry 4.0. Operators in the region routinely embed compact radios on streetlamps; one London pilot added 80 cells across Westminster with minimal visual impact.
The Middle East and parts of Africa are scaling 5G for pilgrimage sites and smart-city corridors, as seen in Saudi Arabia’s multi-vendor program that combines macro and small-cell layers.
Competitive Landscape
Innovation and Adaptability Drive Market Success
Success in the small cell networks market increasingly depends on companies' ability to develop cost-effective, easily deployable solutions that address the growing demand for network densification and 5G capabilities. Incumbent players must focus on continuous innovation in areas such as network automation, integrated backhaul solutions, and multi-operator support to maintain their market positions. Companies need to establish strong partnerships with property owners, local authorities, and system integrators to overcome deployment challenges and accelerate market penetration. The ability to provide end-to-end solutions, including planning, deployment, and management services, has become crucial for maintaining competitive advantage.
New entrants and challenger companies can gain market share by focusing on specialized solutions for specific industry verticals or addressing particular technical challenges in small cell deployment. The market presents opportunities for companies that can effectively address issues such as cellular backhaul development, network management complexity, and integration with existing infrastructure. Regulatory frameworks regarding spectrum allocation, site acquisition, and deployment permissions significantly influence market dynamics and competitive strategies. Companies must also consider the increasing demand for private networks and enterprise solutions while developing their market approach.
Small Cell Networks Industry Leaders
Qualcomm Technologies Inc.
Huawei Technologies Co. Ltd.
Nokia Networks
Verizon
ZTE Corporation
- *Disclaimer: Major Players sorted in no particular order

Recent Industry Developments
- May 2025: Ericsson and Taiwanese operators validated a multi-operator 5G Radio Dot system at Taipei City Mall, recording >1 Gbps downlink and 45% lower energy use relative to DAS
- May 2025: A U.S. House committee removed lower 3 GHz and 6 GHz bands from auction plans while instructing the FCC to free 600 MHz for licensed use, influencing mid-band supply for small cell operators
- March 2025: Crown Castle agreed to sell its fibre and small-cell business to EQT and Zayo for USD 8.5 billion, sharpening focus on tower assets
- February 2025: The GSMA Mobile Economy 2025 report counted 60 standalone 5G launches and flagged energy efficiency as a top operator priority


Research Methodology Framework and Report Scope
Market Definitions and Key Coverage
Mordor Intelligence defines the small cell network market as revenues generated from purpose-built femto, pico, micro, and metro radio units that operate in licensed or shared spectrum and are deployed by operators, neutral hosts, or enterprises to enhance 4G and 5G coverage or capacity in indoor and outdoor settings.
Scope exclusion: stand-alone Wi-Fi access points are outside the study.
Segmentation Overview
- By Cell Type
- Femtocell
- Picocell
- Microcell
- Metrocell
- Radio Dot Systems
- By Operating Environment
- Indoor
- Outdoor
- By End-user Vertical
- BFSI
- IT and Telecom
- Healthcare
- Retail
- Power and Energy
- Smart City and Government
- By Geography
- North America
- South America
- Europe
- Asia-Pacific
- Middle East and Africa
Detailed Research Methodology and Data Validation
Primary Research
To close data gaps, we interviewed network planners at mobile operators, neutral-host integrators, component suppliers, and enterprise IT heads across North America, Europe, and Asia Pacific. These conversations tested deployment run-rates, indoor-versus-outdoor cost differentials, and spectrum-pricing pass-throughs, enabling us to calibrate assumptions that desk sources could not quantify.
Desk Research
Our analysts compiled foundational inputs from tier-1 sources such as the International Telecommunication Union, GSMA Intelligence, the Small Cell Forum, national spectrum-auction filings, and import-export data published by UN Comtrade. Company 10-Ks, network rollout presentations, and reputable trade press added recent deployment counts and unit average selling prices. Paid databases, including D&B Hoovers for vendor financials and Dow Jones Factiva for transaction news, supplemented the public record. This list is illustrative; many other authoritative documents were referenced during data gathering and verification.
Market-Sizing & Forecasting
A blended top-down and bottom-up model was built. Global mobile-data traffic projections and subscriber penetration rates established the demand pool, which was then converted to required small-cell density using site-per-gigabyte norms. Supplier shipment tallies, sampled ASP × volume checks, and neutral-host tenancy ratios provided bottom-up validation. Key variables include mid-band spectrum allocations, fiber backhaul availability, urban population density, typical site CAPEX, and enterprise private-network adoption curves. Forecasts to 2030 rely on multivariate regression and scenario analysis, with coefficient ranges vetted in expert calls. Missing regional shipment data were interpolated from customs records and installation permits.
Data Validation & Update Cycle
Outputs pass variance checks against historical deployment curves, peer benchmarks, and prior Mordor editions. Senior analysts review anomalies before sign-off. The report is refreshed annually, and substantive market events trigger interim updates. A final accuracy sweep occurs just before client delivery.
Why Mordor's Small Cell Networks Baseline Earns Trust
Published estimates often diverge because firms pick different device mixes, spectrum bands, and refresh cadences.
Key gap drivers include: some studies count only public-operator deployments, others blend Wi-Fi or DAS nodes, and many uplift 2024 volumes using uniform growth factors without cross-checking spectrum-auction delays or enterprise neutral-host rollouts that Mordor models explicitly.
Benchmark comparison
| Market Size | Anonymized source | Primary gap driver |
|---|---|---|
| USD 28.19 B (2025) | Mordor Intelligence | - |
| USD 2.4 B (2024) | Global Consultancy A | excludes private and neutral-host sites; uses limited vendor disclosures |
| USD 5.46 B (2024) | Industry Publisher B | counts only 5G units; applies fixed indoor/outdoor split without regional nuance |
| USD 7.41 B (2024) | Trade Journal C | mixes small cells with distributed antenna systems and Wi-Fi 6 nodes |
In sum, because Mordor triangulates shipment data with traffic-driven demand signals and refreshes its model yearly, our baseline offers a balanced, transparent starting point for strategic decisions.


Key Questions Answered in the Report
What is the current value of the small cell networks market?
The market is worth USD 37.14 billion in 2026 and is projected to reach USD 147.56 billion by 2031, reflecting a 31.74% CAGR.
Which segment is growing fastest within the small cell networks market?
Microcells are expanding at a 33.75% CAGR because they balance coverage and capacity for dense urban deployments.
Why are small cells essential for 5G rollouts?
Higher-frequency 5G bands attenuate quickly, so operators must deploy many low-power sites to maintain continuous coverage, especially indoors where over 80% of traffic originates.
How does a neutral-host model lower costs?
A single shared small-cell grid can serve multiple carriers, reducing total ownership expenses by up to 80% compared with separate in-building systems.
What are the main barriers to faster deployment?
Municipal permitting delays, fibre backhaul availability and semiconductor supply constraints are the chief factors holding back scale-out, collectively trimming forecast CAGR by about 10 percentage points.
Which region will account for the largest future growth?
Asia Pacific is forecast to post the highest regional CAGR at 36.95% through 2031, driven by large-scale densification in China, India and Southeast Asian economies.
Page last updated on:


