Foliar Fertilizer Market Size and Share
Market Overview
| Study Period | 2021 - 2031 |
|---|---|
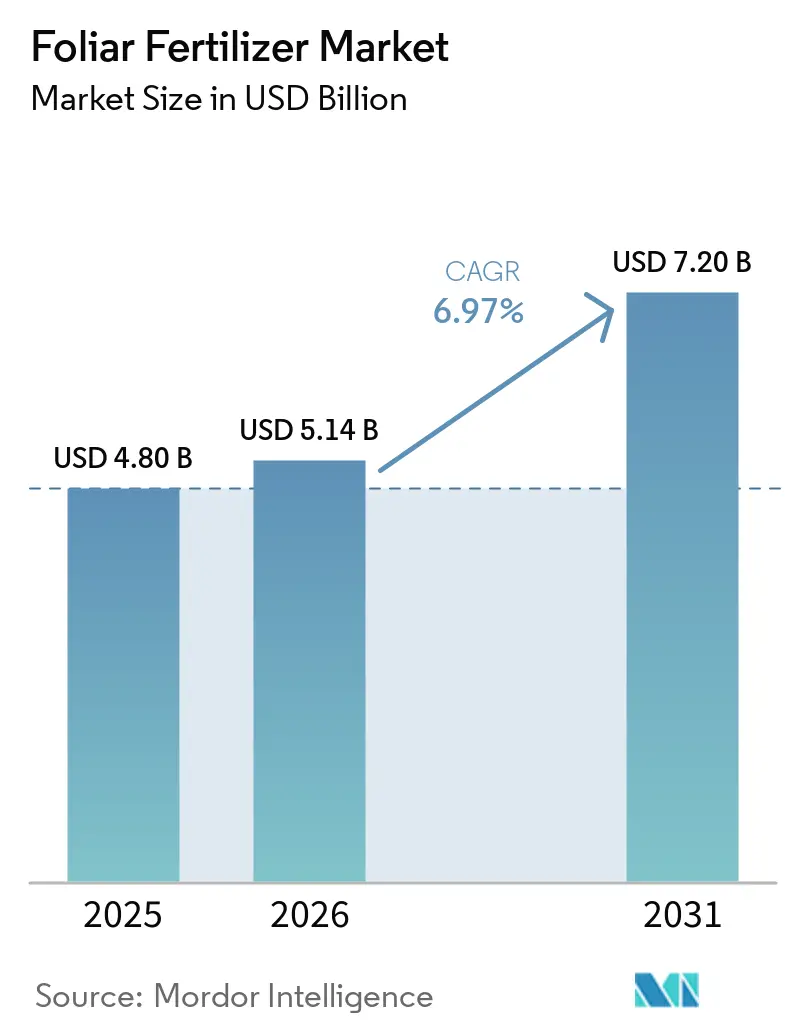
| Market Size (2026) | USD 5.14 Billion |
| Market Size (2031) | USD 7.20 Billion |
| Growth Rate (2026 - 2031) | 6.97% CAGR |
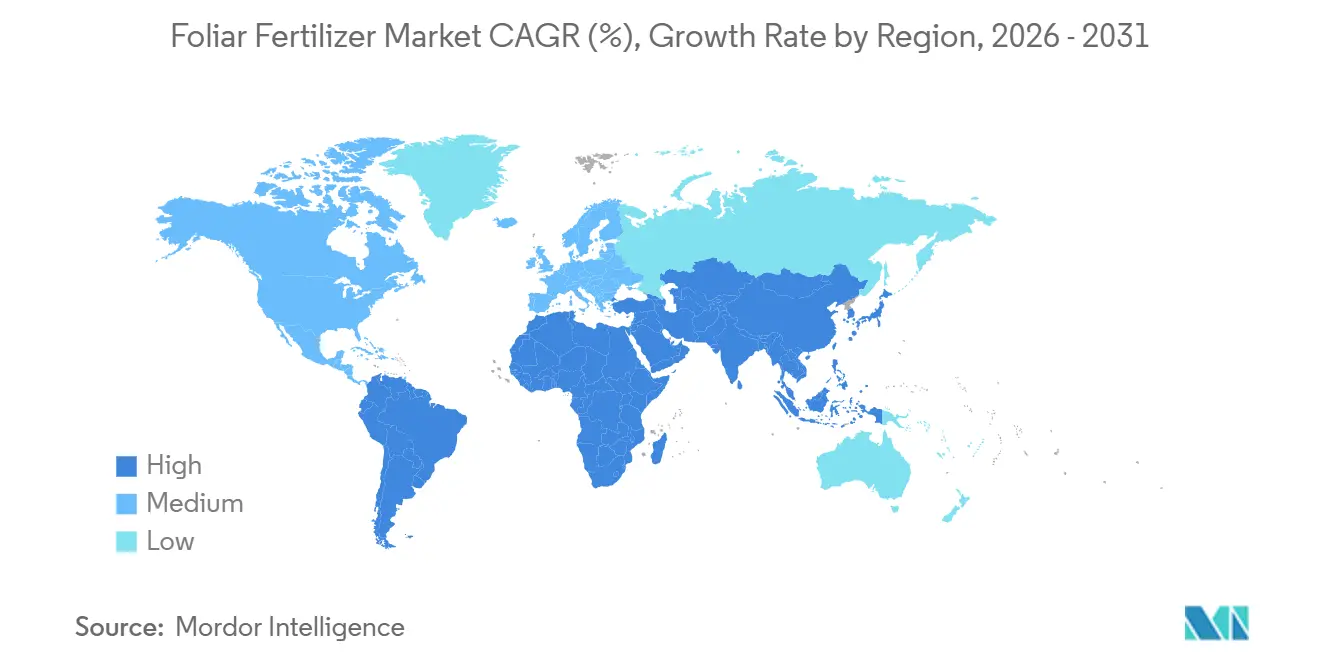
| Fastest Growing Market | Middle East |
| Largest Market | Asia Pacific |
| Market Concentration | Low |
Major Players *Disclaimer: Major Players sorted in no particular order Image © Mordor Intelligence. Reuse requires attribution under CC BY 4.0. | |
Foliar Fertilizer Market Analysis by Mordor Intelligence
The foliar fertilizer market size was valued at USD 4.80 billion in 2025, is estimated at USD 5.14 billion in 2026, and is projected to reach USD 7.20 billion by 2031, expanding at a CAGR of 6.47% during the forecast period (2026–2031). Rapid modernization of crop nutrition, integration of precision-ag platforms, and government incentives that reward balanced fertilization underpin this growth. Asia-Pacific dominates because subsidy programs in China and India accelerate adoption. At the same time, the Middle East and Africa are the fastest-growing regions as desert farming pivots toward water-efficient nutrient delivery. Complex, multi-nutrient blends gain traction as growers look for single-pass solutions, and carbon-credit schemes that reward foliar protocols create new income streams for early adopters. Competitive intensity remains moderate; the top five suppliers command only one-third of sales, so product innovation and regional partnerships remain pivotal.
Key Report Takeaways
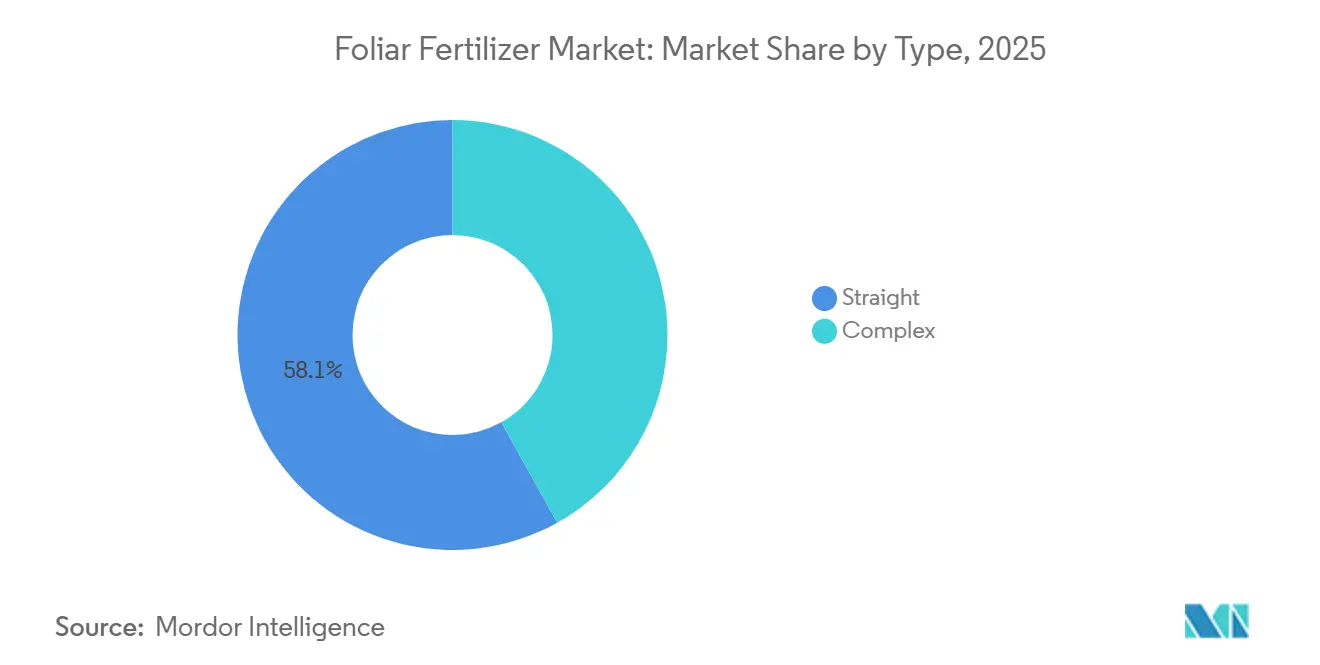
- By Type, straight formulations led with 58.1% of the foliar fertilizer market share in 2025, while complex blends are projected to expand at a 8.6% CAGR during 2026 to 2031.
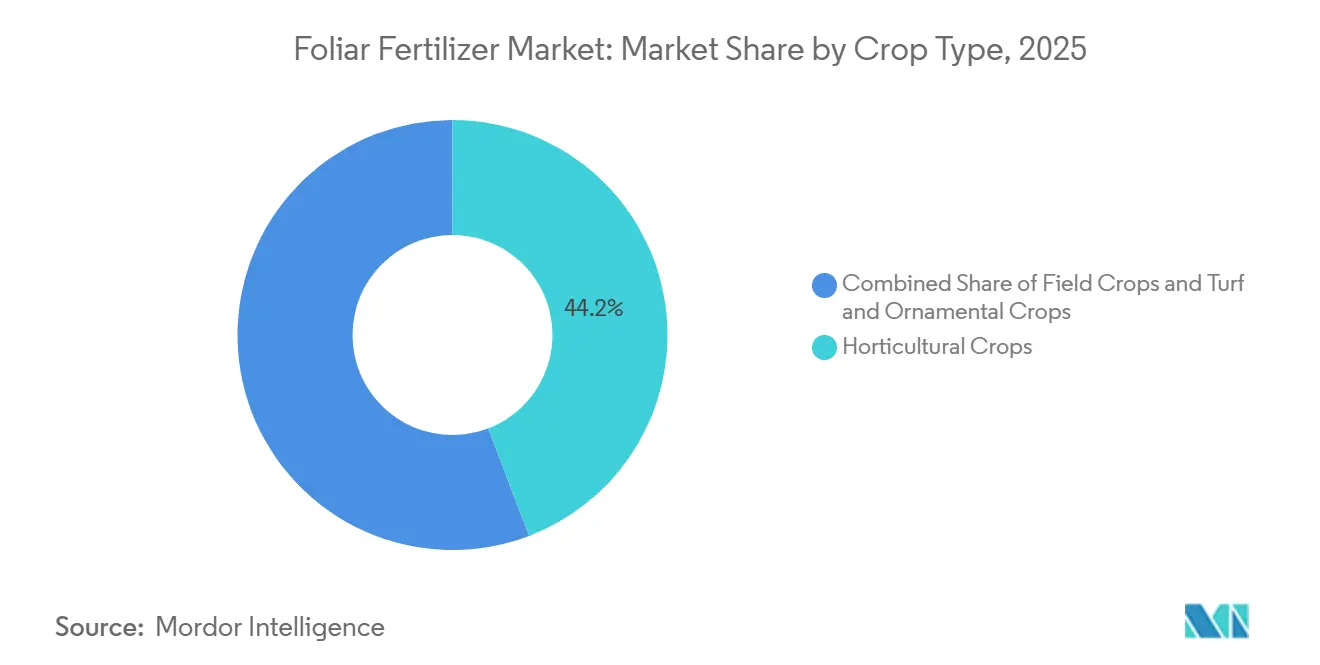
- By Crop, horticultural crops accounted for the largest share, 44.2% of the foliar fertilizer market size in 2025, yet turf and ornamentals are forecast to grow fastest at a 8.9% CAGR during 2026 to 2031.
- By region, Asia-Pacific held the largest share at 39.7% in 2025, while the Middle East is projected to grow fastest at a CAGR of 9.4% through 2031.
Note: Market size and forecast figures in this report are generated using Mordor Intelligence’s proprietary estimation framework, updated with the latest available data and insights as of 2026.
Global Foliar Fertilizer Market Trends and Insights
Drivers Impact Analysis*
| Driver | (~) % Impact on CAGR Forecast | Geographic Relevance | Impact Timeline |
|---|---|---|---|
| Rising push toward balanced fertilization programs | +1.2% | Global, with early adoption in North America and Europe | Medium term (2-4 years) |
| Rapid adoption of precision-ag applications | +0.8% | North America, Europe, Australia, with expansion to Asia-Pacific | Short term (≤ 2 years) |
| Increasing high-value horticultural acreage | +0.7% | Global, concentrated in Mediterranean, California, Netherlands | Long term (≥ 4 years) |
| Growth of carbon-credit linked foliar nutrition schemes | +0.6% | North America, Europe, with pilot programs in Brazil | Medium term (2-4 years) |
| On-farm biostimulant blending with foliar fertilizers | +0.5% | Europe, North America, with emerging adoption in Asia-Pacific | Medium term (2-4 years) |
| Nanochelated nutrient formulations lowering application rates | +0.4% | Global, with technology leaders in Israel, Netherlands, US | Long term (≥ 4 years) |
| Source: Mordor Intelligence | |||
Rising push toward balanced fertilization programs
Extension agencies endorse foliar feeding as a targeted method to correct micronutrient shortages without disturbing macronutrient regimes. Yield trials in corn and soybeans show 10-15% gains when foliar zinc and manganese supplement soil-applied nitrogen and phosphorus. Adherence to the 4R (Right Source, Right Rate, Right Time, Right Place) framework reduces leaching, supporting regulatory compliance. Public cost-share programs in the United States reimburse up to 30% of foliar application expenses, motivating faster technology turnover. Suppliers position educational services as part of the sales package, strengthening brand loyalty and raising repeat-purchase rates.
Rapid adoption of precision-ag applications
Variable-rate sprayers, drone scouting, and IoT (Internet of Things) telemetry elevate foliar fertilizer market performance by matching dosage to in-field variability. Data-driven timing cuts over-application by 25% and improves nutrient-use efficiency. Users integrate satellite vegetation indices with weather forecasts to pinpoint the most permeable leaf stages, boosting uptake. Equipment payback periods now average three years, a threshold that persuades medium-sized farms to invest. Hardware vendors partner with fertilizer producers to bundle software licenses with nutrient packages, weaving stronger channel partnerships.
Increasing high-value horticultural acreage
Global greenhouse space has climbed 9% since 2024, lifting demand for specialty foliar blends that enhance fruit finish, color, and shelf life.[1]Source: United States Department of Agriculture, “Organic Certification Rules,” USDA.gov Foliar calcium timing, for example, lowers blossom-end rot incidence in tomatoes by 40% under hydroponics. Organic certification rules curb synthetic soil inputs, so organically approved leaf sprays fill critical nutritional gaps. Growers justify higher input spend because premium produce commands 20–30% price premiums in export markets. Technology transfer programs in Morocco and Mexico disseminate best practices, enlarging the addressable grower base for suppliers.
Growth of carbon-credit linked foliar nutrition schemes
Programs such as the Bayer Carbon Initiative compensate growers for foliar regimes that enhance root biomass and reduce nitrous oxide emissions. Verified projects receive payments of USD 15–20 per metric ton of avoided CO₂, which offsets up to 50% of foliar program costs. Remote sensing verifies protocol adherence, creating transparent audit trails. Multiyear contracts lock in product volumes for suppliers, stabilizing cash flows. Legislative support in the European Union signals potential scale-up, turning voluntary pilots into regulated market mechanisms.
Restraints Impact Analysis*
| Restraint | (~) % Impact on CAGR Forecast | Geographic Relevance | Impact Timeline |
|---|---|---|---|
| Volatility in raw-material prices for nitrates and phosphates | -0.9% | Global, with acute impact in import-dependent regions | Short term (≤ 2 years) |
| Limited crop-leaf absorption beyond critical phenological windows | -0.6% | Global, with seasonal variations by climate zone | Medium term (2-4 years) |
| Residue-limit tightening for foliar micronutrients in export markets | -0.4% | Export-oriented regions, particularly EU and US markets | Long term (≥ 4 years) |
| Logistics bottlenecks for temperature-sensitive liquid products | -0.3% | Regions with inadequate cold-chain infrastructure | Medium term (2-4 years) |
| Source: Mordor Intelligence | |||
Volatility in raw-material prices for nitrates and phosphates
Ammonium nitrate prices climbed 45% in 2024 due to energy-market turmoil, squeezing margins for liquid foliar producers that rely on high-purity inputs.[2]Source: World Bank, “Fertilizer Price Outlook Q4 2024,” WorldBank.org Forward contracts mitigate some risk, yet small manufacturers lack the credit lines to hedge. Spot sourcing forces many to ration production in peak season, disrupting supply. Industry consolidation could accelerate as bigger firms pursue economy-of-scale procurement. Regulatory reviews of phosphate exports from China inject further uncertainty into long-term planning.
Limited crop-leaf absorption beyond critical phenological windows
Cuticle thickness increases rapidly after flowering, reducing foliar nutrient uptake by up to 60% in maize and wheat. Weather swings shorten spray windows, so missed timing leads to yield penalties and wasted product. Field trials show that midday temperatures above 90°F drop uptake efficiency sharply, yet labor constraints often push spraying into those periods. Developers respond with surfactants that extend permeability, but added cost can deter price-sensitive users. Advisory apps that integrate weather alerts have started to improve decision timing, yet adoption remains partial in emerging economies.
*Our forecasts treat driver/restraint impacts as directional, not additive. The impact forecasts reflect baseline growth, mix effects, and variable interactions.
Segment Analysis
By Type: Innovation Shifts Value Toward Complex Blends
Straight products accounted for a 58.1% of the foliar fertilizer market size in 2025 because their single-nutrient focus offers low cost and flexible dosing. Yet complex blends are forecast to grow at a CAGR of 8.6% during 2026–2031, driven by increasing demand from growers for convenient multi-nutrient solutions. Complex nanochelated formulas extend nutrient residence time, lifting uptake by 20% compared with unchelated salts. Their tank-mix compatibility with biostimulants reduces labor, as one pass suffices for both nutrition and stress mitigation. Straight iron or zinc sprays remain vital for acute corrections, such as citrus greening defense, underscoring a complementary rather than exclusive relationship. Regulatory dossiers for complex products require more residue data, creating barriers that deter low-capex entrants.
Suppliers upscale chelation plants in Europe and Israel to match this momentum. Marketing positions focus on “complete crop diets,” and subscription supply contracts are gaining traction in greenhouse hubs. Straight products keep traction in broad-acre cereals where single-deficiency fixes suffice, especially in Argentina and Kazakhstan. Discounting pressure intensifies because commoditized salts face rising raw-material costs without parallel pricing power.


By Crop Type: Horticulture Surges Ahead
Horticultural crops accounted for the largest segment, contributing 44.2% of the foliar fertilizer market share in 2025. Producers of crops such as grapes, berries, greenhouse vegetables, and other high-value varieties depend on foliar nutrient applications to meet quality and export requirements. Foliar potassium and calcium programs are commonly used to enhance crop quality, extend shelf life, and improve marketability, thereby driving consistent demand in intensive horticultural production systems. Field crops also hold a notable share in the foliar fertilizer market, benefiting from widespread adoption through synchronized spray programs and efficient drone-based applications.
Turf and ornamental crops are projected to grow at the fastest pace, with a CAGR of 8.9% from 2026 to 2031. This growth is driven by rising demand for premium turf quality across golf courses, sports facilities, and landscaped urban areas. Customers are willing to pay higher prices for superior visual quality and reliable performance, encouraging the use of specialized foliar nutrient programs. Advances in application technologies and increased knowledge transfer from commercial agriculture are further boosting adoption in turf and ornamental crop systems.
Geography Analysis
Asia-Pacific accounted for 39.7% of global revenue in 2025, driven by government rebate programs in China that covered up to 20% of foliar fertilizer purchase costs. Indian cooperatives, such as the Indian Farmers Fertilizer Cooperative Limited (IFFCO), scaled nano-urea spray production to 3 million liters in 2025, enhancing farmer familiarity with these products. The region's tropical climatic variability supports split applications, making foliar feeding an effective supplement to soil-based nutrient programs during monsoon-induced nutrient leaching. Distribution improvements, such as solar-powered cold-storage facilities in Vietnam, have reduced spoilage of temperature-sensitive solutions. Additionally, research partnerships with state universities support product localization, while e-commerce platforms expand market access for smallholder farming clusters.
North America represents a mature market characterized by innovation. Precision agriculture connectivity and carbon-offset payments provide layered incentives for adoption. Pilot projects in Iowa have demonstrated that combining foliar sulfur with variable-rate nitrogen application can reduce total synthetic fertilizer use by 12%, helping maize growers meet sustainability goals. In Canada, the Clean Fuel Regulations incentivize emission-reducing agricultural practices, with foliar nutrient management contributing to compliance efforts. Market share competition in the region is influenced by advisory services, with companies offering bundled remote-sensing analytics and product supply achieving renewal rates twice as high as input-only vendors.
Europe's market growth is shaped by regulatory frameworks, such as the European Union's Farm to Fork Strategy, which aims for a 20% reduction in fertilizer use by 2030. Investments are directed toward high-efficiency foliar technologies that minimize nutrient losses. Dutch horticulture has led innovations with foliar magnesium nitrate drip-mist systems, which have increased greenhouse cucumber yields by 15% while maintaining low runoff levels. Eastern Europe is emerging as a growth driver, with countries like Poland and Romania modernizing their agricultural machinery fleets to support advanced farming practices.
The Middle East is projected to be the fastest-growing regional market, with a CAGR of 9.4% during 2026–2031. Saudi Vision 2030 is funding hydroponic megafarms that heavily rely on foliar inputs to conserve water resources in arid environments. In Africa, Kenyan avocado exporters are increasingly adopting low-rate copper foliar formulations to meet stringent European residue limits and improve export acceptance rates. While infrastructure gaps remain, mobile cold-chain units are increasingly serving peri-urban hubs, reducing product spoilage. In South Africa, grain producers are trialing drone-based foliar nitrogen applications to mitigate high urea costs, with field trials showing yield improvements of approximately 8%.

Competitive Landscape
Market concentration is moderate with the top five players, Yara International ASA, The Mosaic Company, ICL Group, Sociedad Quimica y Minera de Chile SA, and Indian Farmers Fertiliser Cooperative Limited, holding a lower share of the global sales. Yara leverages its digital farming platform to cross-sell foliar packages, integrating nutrient analytics that boost renewal rates. ICL Group patents nanochelation technologies that extend leaf surface wetting by 30 minutes, a feature marketed aggressively in arid zones.
Mosaic and Nutrien capitalize on existing dealer networks to reach broad-acre growers, yet face uptake ceilings unless they diversify into precision hardware partnerships. The Andersons added liquid manufacturing capacity in Ohio, enhancing cold-chain resilience and trimming lead times in the U.S. Corn Belt.
Technology alliances shape differentiation. Drone makers integrate metering valves attuned to foliar viscosity, co-branding with fertilizer vendors. Blockchain pilots in Brazil track foliar carbon-offset data, simplifying audit compliance for multinational grain buyers. Suppliers that embed advisory apps gain sticky customer relationships; churn drops below 10% when agronomic support accompanies product sale. Despite cost inflation, the sector’s fragmented tail, over 300 regional blenders, retains relevance where localized formulations outperform global brands.
Foliar Fertilizer Industry Leaders
ICL Group Ltd
Indian Farmers Fertiliser Cooperative Limited
Sociedad Quimica y Minera de Chile SA
The Mosaic Company
Yara International ASA
- *Disclaimer: Major Players sorted in no particular order


Recent Industry Developments
- September 2025: UPL is investing in a new foliar fertilizer technology called TReGCN, which combines traditional crop nutrition with advanced biologicals to enhance nutrient uptake and plant resilience. This innovation reflects UPL’s strategy to integrate sustainable, targeted solutions into mainstream agriculture, especially for crops facing abiotic stress and nutrient inefficiency.
- July 2025: Kan Biosys has launched ROFA specialty fertilizers and indigenous neem-based products to promote sustainable crop nutrition and pest management. These innovations aim to enhance soil health and reduce chemical dependency in Indian agriculture.
- January 2025: Haifa Group has announced the establishment of Haifa India, a new subsidiary designed to enhance access to specialty plant nutrition solutions across the country. This initiative aims to support Indian farmers by providing advanced water-soluble and foliar fertilizers, customized to meet local crop requirements and promote sustainable agricultural practices. The launch reinforces Haifa’s presence in South Asia and aligns with India’s focus on precision agriculture.


Global Foliar Fertilizer Market Report Scope
The Foliar Fertilizer Market Report is Segmented by Type (Complex and Straight), Crop Type (Field Crops, Horticultural Crops, and Turf and Ornamental), and Geography (North America, South America, Europe, Asia-Pacific, the Middle East, and Africa). The Market Forecasts are Provided in Terms of Value (USD) and Volume (Metric Tons).
| Complex | ||
| Straight | By Nutrient | Micronutrients |
| Nitrogenous | ||
| Phosphatic | ||
| Potassic | ||
| Secondary Macronutrients | ||
| Field Crops |
| Horticultural Crops |
| Turf and Ornamental |
| Asia-Pacific | Australia |
| Bangladesh | |
| China | |
| India | |
| Indonesia | |
| Japan | |
| Pakistan | |
| Philippines | |
| Thailand | |
| Vietnam | |
| Rest of Asia-Pacific | |
| Europe | France |
| Germany | |
| Italy | |
| Netherlands | |
| Russia | |
| Spain | |
| Ukraine | |
| United Kingdom | |
| Rest of Europe | |
| Middle East | Saudi Arabia |
| Turkey | |
| Rest of Middle East | |
| North America | Canada |
| Mexico | |
| United States | |
| Rest of North America | |
| South America | Argentina |
| Brazil | |
| Rest of South America | |
| Africa | South Africa |
| Nigeria | |
| Rest of Africa |
| Type | Complex | ||
| Straight | By Nutrient | Micronutrients | |
| Nitrogenous | |||
| Phosphatic | |||
| Potassic | |||
| Secondary Macronutrients | |||
| Crop Type | Field Crops | ||
| Horticultural Crops | |||
| Turf and Ornamental | |||
| Region | Asia-Pacific | Australia | |
| Bangladesh | |||
| China | |||
| India | |||
| Indonesia | |||
| Japan | |||
| Pakistan | |||
| Philippines | |||
| Thailand | |||
| Vietnam | |||
| Rest of Asia-Pacific | |||
| Europe | France | ||
| Germany | |||
| Italy | |||
| Netherlands | |||
| Russia | |||
| Spain | |||
| Ukraine | |||
| United Kingdom | |||
| Rest of Europe | |||
| Middle East | Saudi Arabia | ||
| Turkey | |||
| Rest of Middle East | |||
| North America | Canada | ||
| Mexico | |||
| United States | |||
| Rest of North America | |||
| South America | Argentina | ||
| Brazil | |||
| Rest of South America | |||
| Africa | South Africa | ||
| Nigeria | |||
| Rest of Africa | |||


Market Definition
- MARKET ESTIMATION LEVEL - Market Estimations for various types of fertilizers has been done at the product-level and not at the nutrient-level.
- NUTRIENT TYPES COVERED - Primary Nutrients: N, P and K, Secondary Macronutrients: Ca, Mg and S, Micronutients: Zn, Mn, Cu, Fe, Mo, B, and Others
- AVERAGE NUTRIENT APPLICATION RATE - This refers to the average volume of nutrient consumed per hectare of farmland in each country.
- CROP TYPES COVERED - Field Crops: Cereals, Pulses, Oilseeds, and Fiber Crops Horticulture: Fruits, Vegetables, Plantation Crops and Spices, Turf Grass and Ornamentals
| Keyword | Definition |
|---|---|
| Fertilizer | Chemical substance applied to crops to ensure nutritional requirements, available in various forms such as granules, powders, liquid, water soluble, etc. |
| Specialty Fertilizer | Used for enhanced efficiency and nutrient availability applied through soil, foliar, and fertigation. Includes CRF, SRF, liquid fertilizer, and water soluble fertilizers. |
| Controlled-Release Fertilizers (CRF) | Coated with materials such as polymer, polymer-sulfur, and other materials such as resins to ensure nutrient availability to the crop for its entire life cycle. |
| Slow-Release Fertilizers (SRF) | Coated with materials such as sulfur, neem, etc., to ensure nutrient availability to the crop for a longer period. |
| Foliar Fertilizers | Consist of both liquid and water soluble fertilizers applied through foliar application. |
| Water-Soluble Fertilizers | Available in various forms including liquid, powder, etc., used in foliar and fertigation mode of fertilizer application. |
| Fertigation | Fertilizers applied through different irrigation systems such as drip irrigation, micro irrigation, sprinkler irrigation, etc. |
| Anhydrous Ammonia | Used as fertilizer, directly injected into the soil, available in gaseous liquid form. |
| Single Super Phosphate (SSP) | Phosphorus fertilizer containing only phosphorus which has lesser than or equal to 35%. |
| Triple Super Phosphate (TSP) | Phosphorus fertilizer containing only phosphorus greater than 35%. |
| Enhanced Efficiency Fertilizers | Fertilizers coated or treated with additional layers of various ingredients to make it more efficient compared to other fertilizers. |
| Conventional Fertilizer | Fertilizers applied to crops through traditional methods including broadcasting, row placement, ploughing soil placement, etc. |
| Chelated Micronutrients | Micronutrient fertilizers coated with chelating agents such as EDTA, EDDHA, DTPA, HEDTA, etc. |
| Liquid Fertilizers | Available in liquid form, majorly used for application of fertilizers to crops through foliar and fertigation. |


Research Methodology
Mordor Intelligence follows a four-step methodology in all our reports.
- Step-1: IDENTIFY KEY VARIABLES: In order to build a robust forecasting methodology, the variables and factors identified in Step-1 are tested against available historical market numbers. Through an iterative process, the variables required for market forecast are set and the model is built on the basis of these variables.
- Step-2: Build a Market Model: Market-size estimations for the forecast years are in nominal terms. Inflation is not a part of the pricing, and the average selling price (ASP) is kept constant throughout the forecast period for each country.
- Step-3: Validate and Finalize: In this important step, all market numbers, variables and analyst calls are validated through an extensive network of primary research experts from the market studied. The respondents are selected across levels and functions to generate a holistic picture of the market studied.
- Step-4: Research Outputs: Syndicated Reports, Custom Consulting Assignments, Databases & Subscription Platforms


