Fertilizer Additives Market Size and Share
Market Overview
| Study Period | 2021 - 2031 |
|---|---|
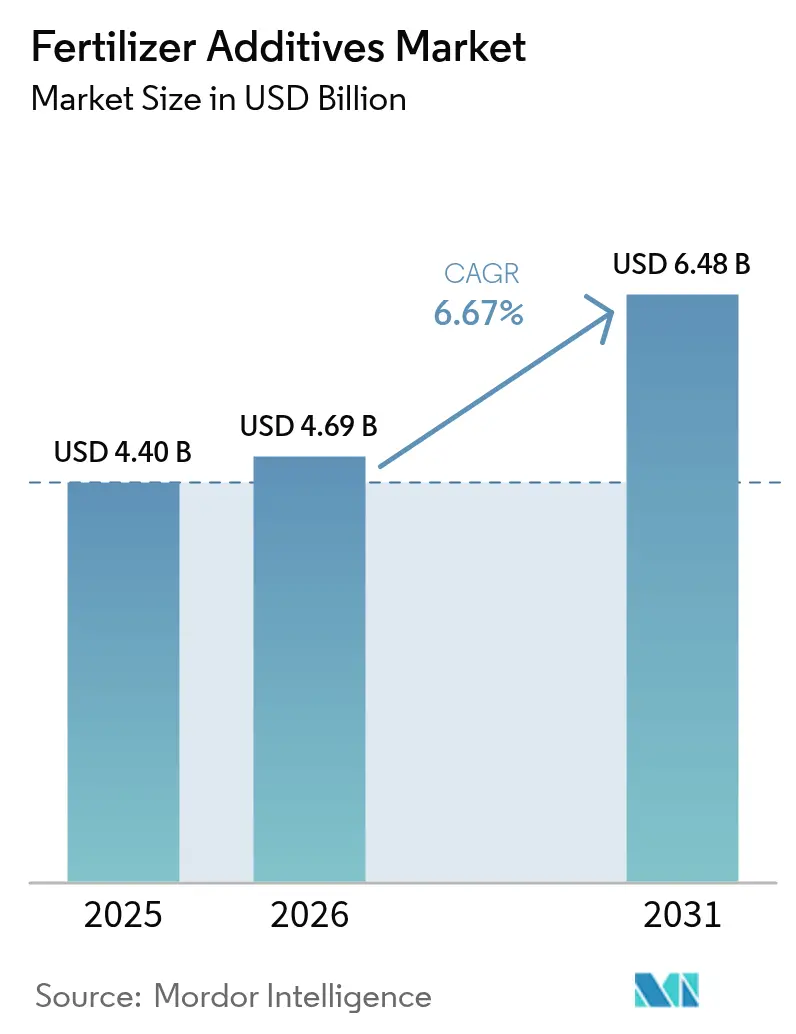
| Market Size (2026) | USD 4.69 Billion |
| Market Size (2031) | USD 6.48 Billion |
| Growth Rate (2026 - 2031) | 6.67% CAGR |
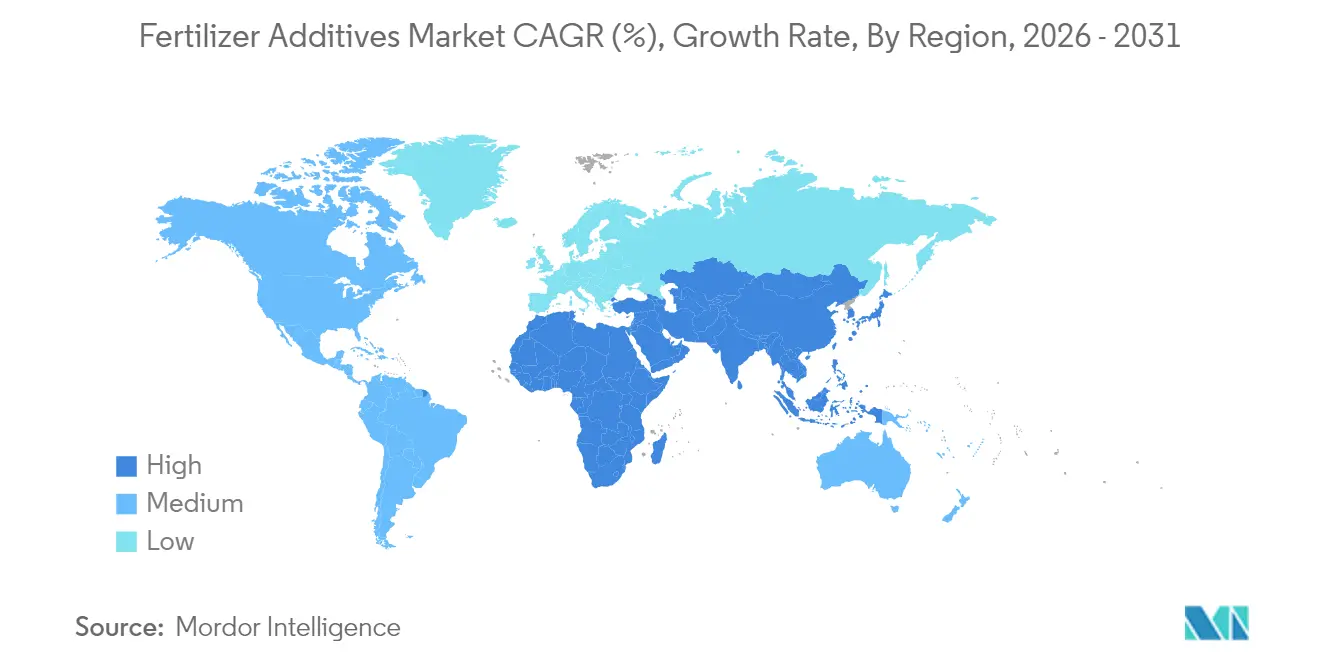
| Fastest Growing Market | Africa |
| Largest Market | Asia Pacific |
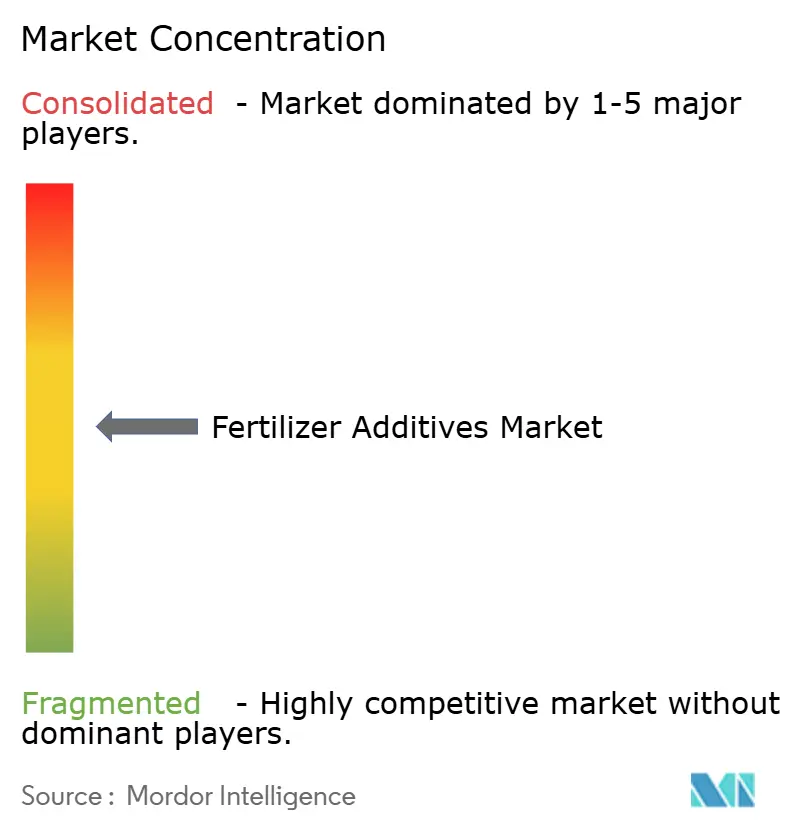
| Market Concentration | Medium |
Major Players *Disclaimer: Major Players sorted in no particular order Image © Mordor Intelligence. Reuse requires attribution under CC BY 4.0. | |
Fertilizer Additives Market Analysis by Mordor Intelligence
The fertilizer additives market size in 2026 is estimated at USD 4.69 billion, growing from 2025 value of USD 4.40 billion with 2031 projections showing USD 6.48 billion, growing at 6.67% CAGR over 2026-2031. Growth rests on stricter nutrient-use rules, the surge of precision agriculture, and rising input costs that push growers toward additives that guard every unit of applied nitrogen or phosphate. Enhanced-efficiency products now pair with variable-rate technology, which already covers 37% of U.S. corn acres, bringing micro-dosing accuracy to fields and irrigation pivots alike. Asia-Pacific supplies the volume base, Africa supplies the pace, and both regions rely on anti-caking and coating chemistries to preserve flowability from the plant gate to the planter box. Demand is also forming around cryogenic ammonia logistics as green ammonia projects multiply, requiring agents that remain active at –33 °C storage temperatures. Moderate concentration among suppliers leaves room for innovators that combine biological stabilizers, biopolymer coatings, and digital dosing support into a single performance package.
Key Report Takeaways
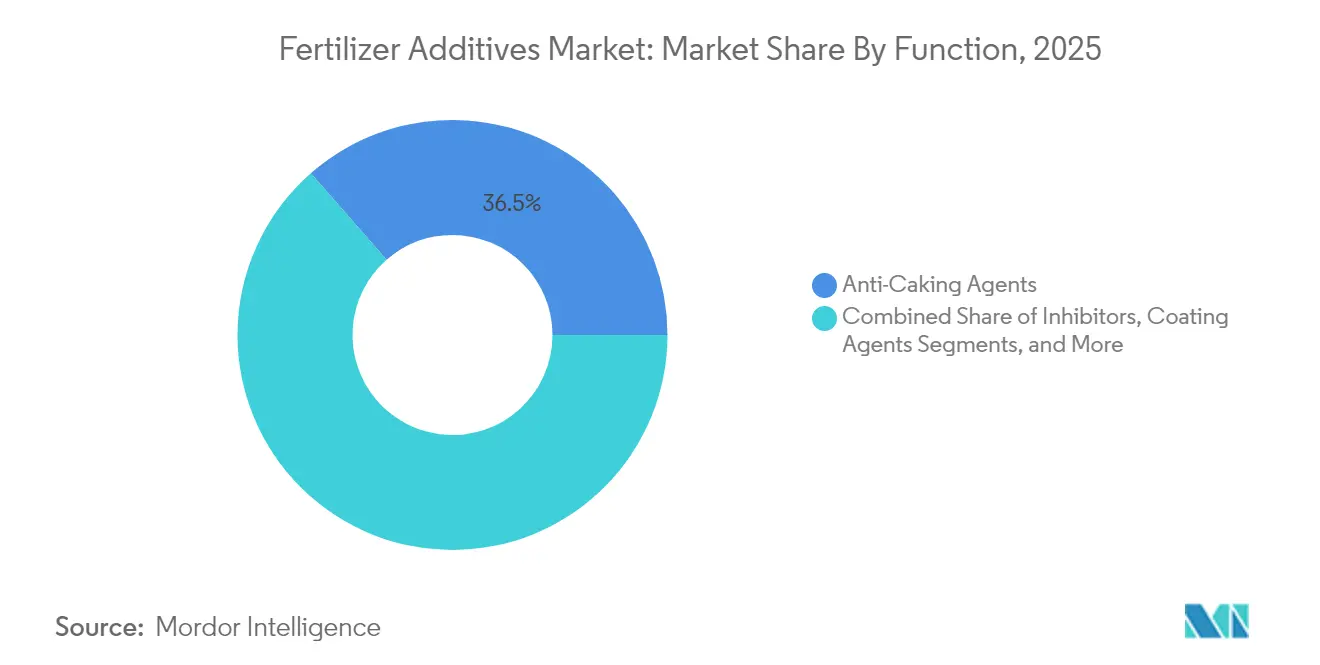
- By function, anti-caking agents held 36.45% of the fertilizer additives market share in 2025, while coating agents will expand at a 9.32% CAGR to 2031.
- By form, solid additives accounted for 67.10% share of the fertilizer additives market size in 2025; liquid formats are projected to grow at 7.98% CAGR over 2026-2031.
- By application, urea captured 41.20% of the fertilizer additives market share in 2025, whereas ammonium sulfate additives will rise at an 10.56% CAGR through 2031.
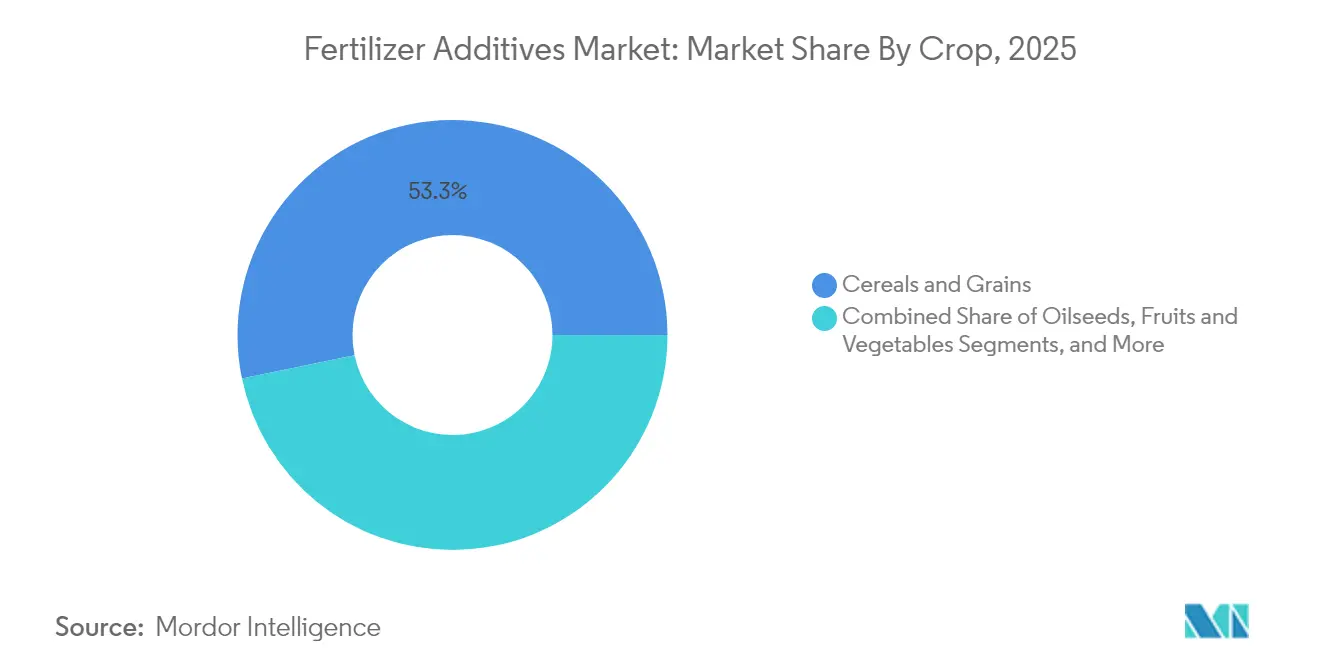
- By crop, cereals and grains accounted for 53.25% of the fertilizer additives market share in 2025; fruits and vegetables are projected to grow at 10.05% CAGR over 2026-2031.
- By region, Asia-Pacific led with a 38.40% revenue share in 2025, while Africa is forecast to post the fastest 10.02% CAGR out to 2031.
- The five largest suppliers controlled 36% of global revenues in 2024, led by Corteva at 13% and BASF at 7%.
Note: Market size and forecast figures in this report are generated using Mordor Intelligence’s proprietary estimation framework, updated with the latest available data and insights as of 2026.
Global Fertilizer Additives Market Trends and Insights
Drivers Impact Analysis*
| Driver | (~) % Impact on CAGR Forecast | Geographic Relevance | Impact Timeline |
|---|---|---|---|
| Rising fertilizer consumption in high-intensity farming regions | +1.2% | Asia-Pacific, North America | Medium term (2-4 years) |
| Demand for enhanced-efficiency fertilizers | +1.8% | Global, especially North America and Europe | Long term (≥ 4 years) |
| Regulatory push for nutrient-use efficiency | +1.1% | Europe, North America | Medium term (2-4 years) |
| Precision-agriculture adoption enables micro-dosing | +0.9% | North America, Europe, Australia | Long term (≥ 4 years) |
| Cryogenic low-carbon ammonia logistics | +0.4% | Japan, Europe, Middle East | Long term (≥ 4 years) |
| Soil-microbiome-friendly biopolymer coatings | +0.7% | Global, early uptake in Europe and North America | Long term (≥ 4 years) |
| Source: Mordor Intelligence | |||
Rising Fertilizer Consumption in High-Intensity Farming Regions
Surging cereal demand lifts additive volumes in zones that already farm at maximum intensity. The OECD-FAO Outlook sees global cereals hitting 3.1 billion tons by 2032, most of it from Asia and Africa[2]Source: OECD and FAO, “Agricultural Outlook 2024-2033,” oecd.org . Additives arrest nutrient losses that climb in humid, irrigated systems, and more than 5 million acres now run on enhanced formulations that cut volatilization during fertigation worldfertilizer.com. Growers using drip and pivot systems achieve nutrient-use efficiency near 90%, propelling further uptake of anti-caking and coating chemistries that keep blends free-flowing under high humidity. Capital inflows toward food security create predictable long-term demand curves for additive suppliers.
Demand for Enhanced-Efficiency Fertilizers (EEF)
Value-added fertilizers worth USD 19.8 billion merge biostimulants, inhibitors, and controlled-release coatings into single granules tailored for timing and crop phase. Urease inhibitors such as NBPT lower ammonia losses by 54% when matched with Duromide stabilizer, helping growers derive higher protein grain without extra passes. U.S. biostimulant sales will triple to USD 1.2 billion by 2026, embedding biologicals into conventional nutrient programs. Polymer-coated controlled-release variants further tighten delivery windows, nudging the fertilizer additives market toward smarter, multi-layer films that synchronize supply and root demand.
Regulatory Push for Nutrient-Use Efficiency
The European Union’s Fertilizer Regulation (EU 2019/1009) unifies labeling and safety rules across all fertilizer categories and bars sales of products cleared under prior statutes, forcing reformulations built on lower-carbon inputs. The U.S. EPA is weaving endangered-species safeguards into pesticide registration, indirectly steering growers toward formulations that curb nitrogen losses and runoff. In livestock-dense regions, nitrification inhibitors such as nitrapyrin are being written into manure management codes to trim nitrous oxide emissions. Taken together, these policies accelerate the adoption of additives that document higher nutrient-use efficiency.
Cryogenic Low-Carbon Ammonia Logistics Creating New Anti-Caking Needs
A pipeline of 180 million tons of low-carbon ammonia projects aims for commissioning by 2035, positioning ammonia as cargo for energy and fertilizer alike. Japan targets 20 million tons of ammonia and hydrogen usage by 2050 and channels subsidies to import terminals and co-firing plants. Storage at –33 °C causes conventional anti-caking waxes to fracture, spurring research into elastomeric agents that maintain film integrity under thermal shock[3]Source: United States Department of Agriculture, “Farm Computer Usage and Ownership Highlights,” usda.gov . This niche stimulates additive makers to tailor products for maritime cold chains.
Restraints Impact Analysis*
| Restraint | (~) % Impact on CAGR Forecast | Geographic Relevance | Impact Timeline |
|---|---|---|---|
| Rising cost of crop inputs | −0.8% | Global, developing regions | Short term (≤ 2 years) |
| Tightening environmental regulations on additives | −0.6% | Europe, North America | Medium term (2-4 years) |
| Petrochemical feedstock volatility for specialty surfactants | −0.5% | Global, emphasis on Asia-Pacific | Short term (≤ 2 years) |
| Rapid emergence of biological substitutes | −0.7% | North America, Europe | Long term (≥ 4 years) |
| Source: Mordor Intelligence | |||
Rising Cost of Crop Inputs
Fertilizer prices rose 11% in early 2025, squeezing farm margins as grain prices lag[4]Source: World Bank, “Commodity Markets Outlook April 2025,” worldbank.org. Delivered UAN28 reached USD 354 per ton, DAP USD 765, and MAP USD 810, making premium additives a harder sell for cash-strapped growers. Rabobank’s affordability index signals demand destruction risk, especially in nitrogen and phosphate categories that already command the bulk of farm spend. Smallholders in Africa and South Asia face the harshest trade-offs, often deferring enhanced-efficiency purchases despite proven payback.
Tightening Environmental Regulations on Additives
The European Chemicals Agency wants stricter workplace exposure limits for amorphous silica, a mainstay of flow conditioners, raising compliance costs for formulators. Microplastics legislation is pushing polymer-coated granule producers toward biodegradable films, spurring expensive reformulation programs. Long-term ecotoxicity of synthetic nitrification inhibitors is under review, and precautionary bans could jolt established product lines in the fertilizer additives market.
*Our forecasts treat driver/restraint impacts as directional, not additive. The impact forecasts reflect baseline growth, mix effects, and variable interactions.
Segment Analysis
By Function: Anti-Caking Dominance Amid Coating Innovation
Anti-caking products generated the largest slice of the fertilizer additives market in 2025, at 36.45% of revenue. This dominance stems from the material’s vital role in preserving particle flow during humid shipping seasons and long warehouse layovers. Fatty amine blends and reduced-surfactant systems now outperform early bio-waxes by creating thinner, more flexible films that withstand compression in rail cars. Coating agents, however, wear the growth crown with a 9.32% CAGR, propelled by polymer and biopolymer films that meter release over 45- to 90-day spans. These twin leaders show how reliability and nutrient timing together move purchasing decisions.
Second-tier categories also evolve. Inhibitors answer regulatory calls to curb nitrous oxide, and granulation aids win converts in precision applicators that demand tight particle tolerances. Emerging hybrid products fuse anti-caking, inhibitor, and coating functions into single additives that cut inclusion rates and simplify supply chains. Corrosion prevention solutions enter liquid fertilizer service while dedusting agents gain momentum where worker exposure standards tighten. The fertilizer additives market continues to gravitate toward multi-purpose chemistries able to solve several pain points with one dose.


By Form: Solid Foundation with Liquid Growth
Granular nutrient blends keep solids on top, translating to 67.10% of revenues and steady cash flows for talc-based conditioners, waxes, and fatty amine powders. Bulk terminals and barge operators rely on solid anti-caking to keep piles free-flowing. Liquids, though smaller, are the climbers, logging an 7.98% CAGR that mirrors rising fertigation acres and drone spray adoption. Liquid dispersions dissolve quickly in nurse tanks, enabling inline injection at variable rates that match yield maps.
Micro-encapsulated formats sit between the two poles. They protect active ingredients, delay the release, and satisfy looming microplastic rules with compostable shells made from polylactic acid or starch. Milliken’s push into microcapsules illustrates capital migration toward next-generation delivery routes. In the fertilizer additives market, form factors are converging; some suppliers now offer kits that include both liquid seed dressing and companion dry coating for top-dress passes, ensuring consistent nutrient control across the season.
By Application: Urea Leadership with Specialty Growth
Urea’s share, 41.20% of total demand, anchors the fertilizer additives market share due to its low cost and high nitrogen density. Unfortunately, urea also volatilizes quickly. NBPT and other urease inhibitors, therefore, remain cornerstones of many additive portfolios, often paired with thin polymer shells that stretch nitrogen availability past three weeks. Specialty niches arise in ammonium sulfate, which gains an 10.56% CAGR, spurred by precision-guided sulfur programs for oilseed and horticulture.
DAP and MAP depend on moisture blockers that stop phosphate cakes from forming during tropical storage. Ammonium nitrate coatings must pull double-duty—block caking yet not alter explosive safety classifications. Triple super-phosphate and potash blend lean on dust suppressants to protect conveyor workers and keep micronutrient coatings intact. Each substrate invites a different additive recipe, prompting suppliers to engineer modular product lines that can be tuned field-side.
By Crop: Cereals Dominance with Horticultural Expansion
Cereals and grains account for 53.25% of additive usage as they occupy most cropland and consume nitrogen and phosphate at an industrial scale. Optimized NPK regimens boost cereal output by more than 55%, a figure that underscores why flowability and inhibitor efficiency sit at the center of grower budgets. Adopters in this segment gravitate toward coatings that combine slow release and anti-dust in one pass.
Fruits and vegetables grow at 10.05% CAGR because their higher market price justifies premium inputs such as nano-chelates and hydrogels that target root zones with minute precision. Oilseeds demand boron and sulfur balancing, which pushes micronutrient additives faster than overall nitrogen stabilizers. Turf and ornamentals rely on polymer-coated prills that feed gradually over 90 days, lowering mowing frequency and labor costs. Crop specificity will keep the fertilizer additives industry agile as suppliers jockey to tailor SKUs by commodity and region.
Geography Analysis
Asia-Pacific retained the sales crown at 38.40% in 2025 thanks to dense small-plot farms in China and India that collectively serve nearly 3 billion people. Domestic additive lines benefit from China’s temporary phosphate export limits, which reshuffle supply into local channels and dampen import reliance. India’s chemicals sector is on track to touch USD 50 billion in specialty revenues by 2025, aided by the Digital Agriculture Mission that funds soil labs and on-farm sensors. Within the fertilizer additives market size, domestic producers leverage integrated supply chains to keep delivered costs low despite volatile freight markets.
Africa showcases the fastest 10.02% CAGR as governments and private capital pour funds into new production hubs. Consumption will jump from 7.6 million to 13.6 million tons of nutrients by decade's end, led by Nigeria’s 1.5 million ton plant and Indorama’s 2.8 million ton expansion. West Africa alone could exceed 4.6 million tons by 2030. Adoption still faces last-mile hurdles such as bagged product costs and rural financing gaps, but additive suppliers see room to package flow conditioners with farmer training to lift acceptance.
North America and Europe register mature yet innovative growth at 5.05% and 4.38% CAGR. Precision agriculture underpins most incremental demand; 28% of U.K. farms adjust fertilizer plans using legume rotations to fix nitrogen and curb synthetic application. The EU Carbon Border Adjustment Mechanism, coming in 2026, will require fertilizer importers to disclose embedded carbon, advantaging local low-emission formulations. Across both continents, biological alternatives gain a share, yet chemical coatings persist because their performance data remain robust under colder climates and tight planting windows.

Regulatory Landscape
Regulation is tightening around both fertilizer product conformity and the chemistry used inside additive packages, with Europe setting much of the global compliance cadence. The EU Fertilising Products Regulation (EU) 2019/1009 continues to steer labeling, safety, and conformity assessment for EU fertilising products. At the same time, related chemical policy pressures are pushing reformulation away from contentious ingredients, including persistent polymer coatings, and toward lower-hazard, biodegradable alternatives.
In June 2025, ECHA proposed stricter occupational exposure limits for silicon dioxide (SiO2), a widely used anti-caking and flow-conditioning ingredient. That step elevates compliance and documentation requirements for formulators and blenders. Outside the EU, national frameworks are increasingly specifying performance and safety evidence for newer additive-enabled formats, particularly nano and biological solutions. In March 2026, India issued the Fertiliser (Inorganic, Organic or Mixed) (Control) (Second) Amendment Order, 2026, adding stricter requirements for nano fertilizers, including biosafety testing and mandatory multi-location agronomic trials, which raises authorization and renewal rigor for suppliers. The United Kingdom is also moving its fertilisers regulatory reform forward through the proposed UK Fertilising Product Regulations (UK FPR), shifting toward conformity assessment while retaining safety controls such as the Ammonium Nitrate Safety Regulations. Together, these changes increase the need for traceable formulations and standardized product dossiers.
Competitive Landscape
The fertilizer additives market remains moderately concentrated, with the top five companies accounting for 36% of 2024 revenue. Corteva Agriscience leads at 13%, buoyed by nitrogen stabilizers that plug directly into its seed and crop-protection platforms. BASF follows at 7%, leveraging a global production footprint and a broad anti-caking and coating portfolio, even as it weighs an agricultural unit IPO to sharpen strategic focus. Arkema’s ArrMaz unit and KAO Corporation each capture 6%, the former through specialty surfactants and the latter via proprietary fatty-amine chemistries used in advanced coatings. Clariant rounds out the top tier at 4%, supplying high-purity surfactants that improve flowability and reduce dust during bulk handling.
The strategy now tilts toward sustainability and geographic diversification. Corteva has expanded its biological arm with the Symborg and Stoller deals, positioning itself to bundle living inoculants with chemical stabilizers. BASF channels R and D into biodegradable films that satisfy European microplastic rules, while Arkema adapts green surfactants for low-temperature ammonia logistics. KAO refines fatty-amine blends to boost coating efficiency at lower inclusion rates, and Clariant pilots sugar-derived dust suppressants designed for warmer, high-humidity supply chains. ICL Group, though outside the top five, underscores the trend by buying Nitro 1000 and launching biological nitrogen-fixation products in Brazil.
White-space opportunities persist because 64% of the market remains open to mid-tier and emerging entrants. Demand is building for anti-caking agents that survive cryogenic storage at –33 °C and for microencapsulated additives that align with drone spraying and fertigation. Patent filings concentrate on biopolymer coatings and controlled-release matrices; Evonik’s work on silica carriers for live bacteria highlights the blending of chemical and biological technologies. Suppliers able to prove field performance, environmental compliance, and scalable production are best placed to win share as regulations tighten and growers adopt precision tools at pace.
Fertilizer Additives Industry Leaders
BASF SE
Corteva Agriscience
Clariant International Ltd
KAO Corporation
Koch Agronomic Services
- *Disclaimer: Major Players sorted in no particular order

Market Opportunities and Future Outlook
Opportunities are clustering around three whitespace areas: (1) additives embedded at the point of fertilizer manufacture (in-line coatings, stabilizers, and suspension aids), (2) compliance-ready, biodegradable or low-hazard formulations that maintain handling performance through hotter and wetter logistics, and (3) additive systems designed for enhanced-efficiency fertilizers linked to conservation and nutrient-management programs. In the United States, alignment to NRCS nutrient management guidance (Practice Code 590) has become a practical adoption channel for enhanced-efficiency products, supporting grower and retailer willingness to pay when additives document measurable nutrient-use outcomes rather than only handling improvements.
Europe is also showing concrete movement toward regionally secured specialty phosphate and value-added formulations that incorporate additive functionality. In April 2026, K+S and Elixir Group commissioned a 50,000 t/a tMAP plant at Industrial ChemPark Prahovo in Serbia, reinforcing demand for anti-caking and coating systems tuned for higher-analysis phosphate products and cross-border distribution. On the product side, Fertiberia commercialized its NSAFE bio-inhibitor into the Netherlands and Germany in March 2026, and BTU and BINFIELD moved microbial coating from development into industrial production with FERTIS ACTIVE NPK in June 2026, indicating a shift from tank-mix biologicals toward factory-applied, stability-managed additive layers.
Recent Industry Developments
- April 2026: Koch Agronomic Services launched CENTURO A-PRO, a high-concentration nitrogen stabilizer positioned for use with anhydrous ammonia and UAN, and highlighted its US EPA registration. The higher active concentration supports lower use rates and logistics efficiency for retailers, while expanding the competitive set in nitrification inhibition where nutrient-loss regulations and emissions programs are tightening.
- April 2025: BASF introduced Ampliqan, a nitrification inhibitor for the fertilizer industry aimed at protecting nitrogen from leaching and reducing nitrous oxide emissions. The launch broadened BASF's inhibitor toolkit alongside urease inhibition offerings, supporting fertilizer producers and blenders that are building enhanced-efficiency portfolios for compliance-led nutrient management.
- October 2024: Coromandel International announced expansion plans and a new facility establishment to increase fertilizer additive production capacity in India, with a focus on anti-caking and coating agents. The move strengthens local supply availability in a high-volume fertilizer market, reducing reliance on imported additive inputs for handling and performance upgrades.


Research Methodology Framework and Report Scope
Market Definition and Coverage
This market covers chemical additives that are added into manufactured fertilizers to improve handling, storage stability, nutrient efficiency, and performance in the field, and it is measured in value terms (USD) across the supply chain.
Scope exclusions: Soil amendments used independently of fertilizer products, process catalysts used inside fertilizer plants, and spray adjuvants used with crop protection products are not counted.
Segmentation Overview
- By Function
- Inhibitors
- Coating Agents
- Granulation Aids
- Anti-Caking Agents
- Dedusting Agents
- Corrosion Inhibitors
- Anti-Foaming Agents
- Other Niche Functions
- By Form
- Solid
- Liquid
- Micro-encapsulated
- By Application
- Urea
- Ammonium Nitrate
- Diammonium Phosphate (DAP)
- Mono-Ammonium Phosphate (MAP)
- Ammonium Sulfate
- Triple Superphosphate (TSP)
- Potash Blends
- Other Specialty Fertilizers
- By Crop
- Cereals and Grains
- Oilseeds
- Fruits and Vegetables
- Turf and Ornamentals
- Others
- By Geography
- North America
- United States
- Canada
- Mexico
- Rest of North America
- Europe
- Germany
- France
- United Kingdom
- Spain
- Italy
- Russia
- Rest of Europe
- Asia-Pacific
- China
- India
- Japan
- Australia
- South Korea
- Rest of Asia-Pacific
- Middle East
- Saudi Arabia
- United Arab Emirates
- Rest of Middle East
- Africa
- South Africa
- Egypt
- Rest of Africa
- North America
Data Sources, Market Sizing, and Validation
Desk Research
Desk research started by aligning the fertilizer-additive definition to how additives are actually sold, shipped, and used, because the same chemistry can show up under different labels. We pulled volume and demand signals from public sources such as FAOSTAT, USDA datasets, and International Fertilizer Association publications, then cross-checked with national agriculture ministries and customs statistics where trade patterns were material.
To convert those signals into a value model, we reviewed company annual reports, investor presentations, and product technical bulletins to understand where additives are applied (for example, urea and ammonium nitrate handling, or inhibitor dosing practices). We also used paid subscription sources for company financials and shipment-level import and export checks to validate directional movements in additives linked to fertilizer production and trade. These desk sources are illustrative only, and many other public documents and datasets were also used for validation and clarification.
Primary Interviews and Surveys
Primary work focused on confirming what is actually counted as an additive sale versus a bundled service, and how inclusion varies by fertilizer type and region. We spoke with a mix of manufacturers, distributors, and downstream blenders, then sanity-checked price and dosage assumptions with technical and commercial roles across APAC, EMEA, and the Americas.
Distribution of primary research fieldwork respondents
| Company type | Respondent position | Region |
|---|---|---|
| Top tier: 37% | CXOs: 15% | APAC: 49% |
| Mid tier: 46% | Functional/Unit leaders: 34% | EMEA: 33% |
| Smaller Players: 17% | Managers: 51% | Americas: 18% |
Market-Sizing & Forecasting
Sizing was built using a top-down approach where fertilizer production and trade data were used to reconstruct the addressable fertilizer base, which was then converted into additive demand using typical treatment and dosing behavior for major fertilizer types. To keep the totals realistic, we corroborated the outputs with selective bottom-up approximations, such as sampled additive pricing multiplied by implied treated volumes, and distributor channel checks in high-consumption countries.
Key inputs in the model included urea and ammonium nitrate production volumes, regional trade flows of key fertilizers, typical additive dosage ranges (by function like anti-caking and inhibitors), average selling price bands by formulation, and the share of fertilizer that is treated or coated before sale. Where bottom-up pricing or dosage inputs were missing for smaller geographies, we used proxy ratios from similar markets and then adjusted them after expert review so the implied spend per ton did not look inflated.
For forecasting, scenario analysis was used so that adoption of inhibitors and coatings could be flexed against agronomic regulation tightening, fertilizer price cycles, and shifts in nutrient-use efficiency programs. The final forecast path was selected after checking that it matched the consensus direction from interviews on treatment rates and expected price movements.
Data Validation & Update Cycle
Outputs were checked against independent signals such as fertilizer output growth, import and export movements, and realistic additive spend per ton for the most treated products. When a country or function showed an unusual jump, we traced it back to the specific variable that moved, and then re-checked the assumption with fresh desk research and follow-up calls.
Before sign-off, the model is reviewed in steps so that unit logic, currency conversions, and year alignment are consistent across regions. Reports are refreshed annually, and interim updates are made when material events change fertilizer production, trade, or additive pricing assumptions. Right before delivery, we do a last pass so clients receive the latest updated view.
Mordor Intelligence's Fertilizer Additive Market Size Versus Other Published Estimates
Published market sizes for fertilizer additives can differ even when the topic name looks identical, because firms mix different product baskets and use different timing for prices and exchange rates. Differences also come from how treated fertilizer volumes are estimated, since adoption for coatings and inhibitors is not uniform across fertilizer types or regions.
The main gap comes from whether slow-release and inhibitor chemistries are counted only when they are blended into finished fertilizer, and Mordor Intelligence applies that rule while also keeping soil amendment products outside the scope, which changes the demand pool used for pricing and penetration assumptions.
Benchmark comparison
| Source | Market Size | Gaps in Research Methodology |
|---|---|---|
| Mordor Intelligence | USD 4.69 B (2026) | |
| Industry Publisher A | USD 3.85 B (2024) | Uses an earlier pricing year and a slower adoption curve for coatings and inhibitors, and it appears to rely more on broad function-level shares rather than fertilizer-type treated volumes. |
| Consultancy B | USD 2.89 B (2024) | Counts a narrower set of functions centered on handling aids and may undercount inhibitor-treated fertilizer, which pulls down both the treated volume base and the blended ASP. |
The spread in values mostly reflects scope and conversion choices rather than a single arithmetic error. When treated fertilizer volumes, dosage logic, and currency timing are aligned, the market size becomes easier to trace back to clear variables and repeatable steps, which helps decision makers compare scenarios consistently.


Key Questions Answered in the Report
What are fertilizer additives, and why are they important?
Fertilizer additives are specialized compounds such as anti-caking agents, coatings, and inhibitors that improve storage stability, handling, and nutrient delivery; the fertilizer additives market reached USD 4.69 billion in 2026, underscoring their value in raising nutrient-use efficiency.
Which functional segment currently leads the fertilizer additives market?
Anti-caking agents hold the top spot with 36.45% revenue share in 2025, although coating agents are projected to rise the fastest at a 9.32% CAGR through 2031.
What region shows the strongest growth outlook for fertilizer additives?
Africa is forecast to post a 10.02% CAGR by 2031 as consumption climbs from 7.6 million to 13.6 million tons on the back of new production hubs and government support.
How are regulations reshaping product development?
Rules such as the European Union Fertilizer Regulation (EU 2019/1009) and the Carbon Border Adjustment Mechanism press suppliers to create low-carbon, biodegradable formulations that still meet performance targets.
What competitive dynamics define the fertilizer additives market?
The market is moderately concentrated; five suppliers control 36% of revenue, yet smaller innovators flourish by focusing on biopolymer films, micro-encapsulated actives, and cryogenic ammonia solutions.
What is the main challenge to near-term demand?
Rising fertilizer prices, up 11% in early 2025, strain farm budgets and may delay the adoption of premium additive technologies, especially among smallholders in developing regions.
Page last updated on:


