Market Overview
| Study Period | 2021 - 2031 |
|---|---|
| Forecast Data Period | 2026 - 2031 |
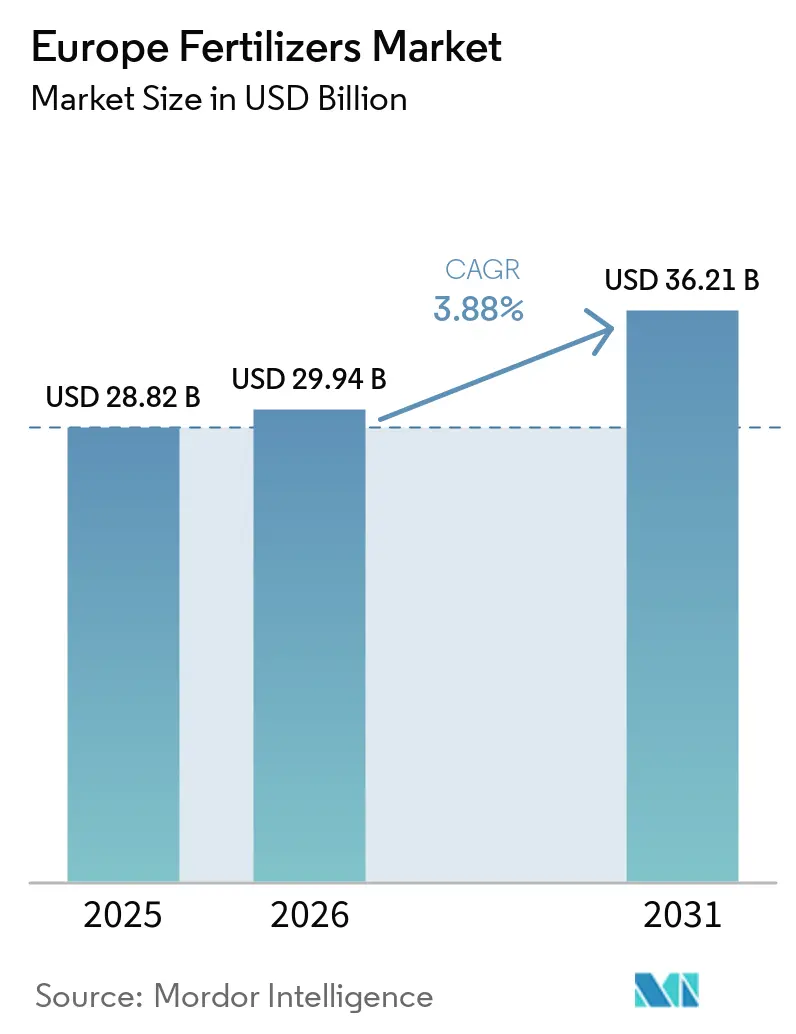
| Base Year Market Size (2025) | USD 28.82 Billion |
| Market Size (2026) | USD 29.94 Billion |
| Market Size (2031) | USD 36.21 Billion |
| Growth Rate (2026 - 2031) | 3.88% CAGR |
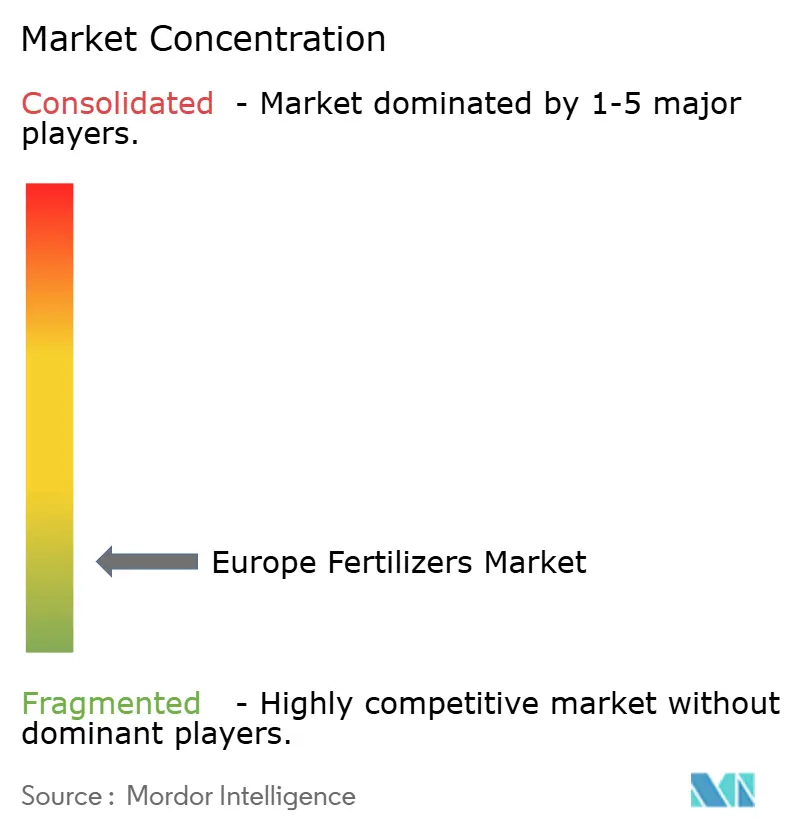
| Market Concentration | Low |
Major Players *Disclaimer: Major Players sorted in no particular order Image © Mordor Intelligence. Reuse requires attribution under CC BY 4.0. | |
Europe Fertilizers Market Analysis by Mordor Intelligence
The Europe fertilizers market size is projected to grow from USD 28.82 billion in 2025 to USD 29.94 billion in 2026 and is forecast to reach USD 36.21 billion by 2031, registering a CAGR of 3.88% during the forecast period (2026–2031). Robust demand stems from the European Union’s Common Agricultural Policy eco-schemes, the Carbon Border Adjustment Mechanism, and investments in announced green-ammonia projects that will reconfigure nitrogen supply. Accelerated adoption of controlled-release and water-soluble products, growing investments in renewable energy–powered production, and the rebound in cereal acreage after the 2024 price rally further support growth. Producers face cost-side headwinds from natural-gas price volatility but are responding through vertical integration and renewable feedstock strategies. The Europe fertilizers market displays a fragmented concentration, with the top five firms controlling a minor share of the market size.
Key Report Takeaways
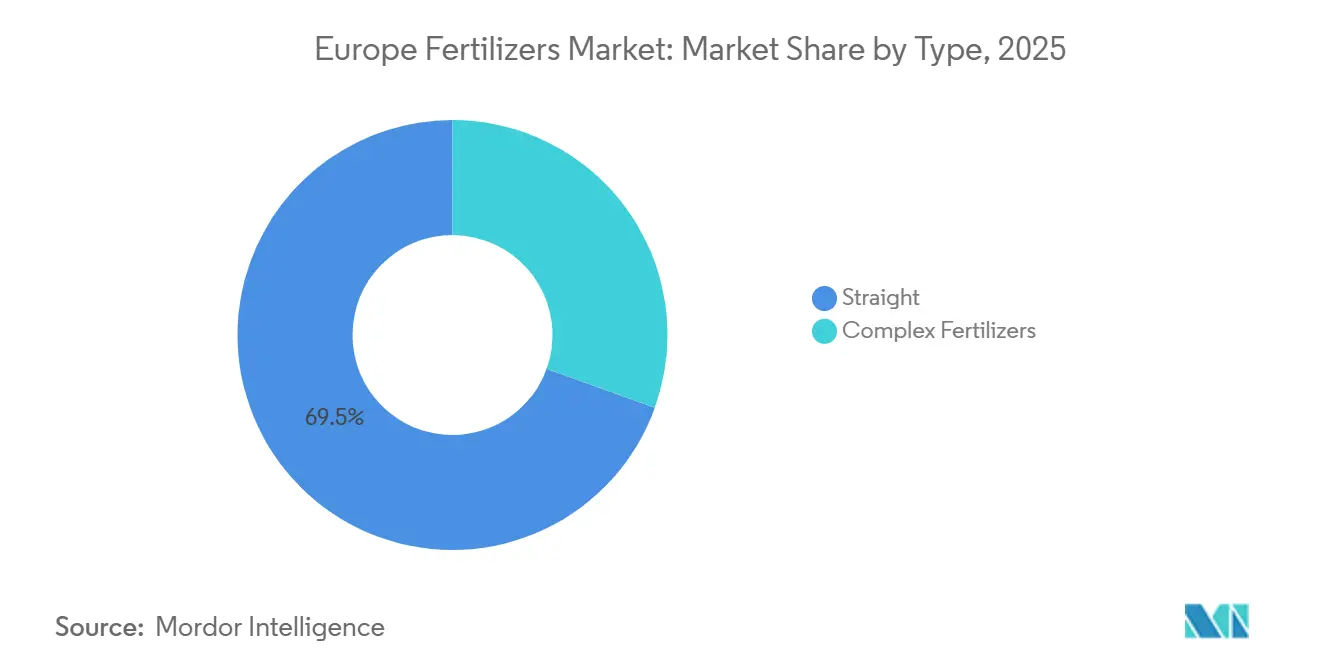
- By type, straight fertilizers accounted for the largest Europe fertilizers market share of 69.5% in 2025, while the complex fertilizers segment is projected to expand at the fastest CAGR of 5.1% through 2031.
- By form, conventional formulations held the largest Europe fertilizers market size in 2025, accounting for an 81.2% share, whereas specialty formulations are forecast to grow at the fastest CAGR of 6.2% from 2026 to 2031.
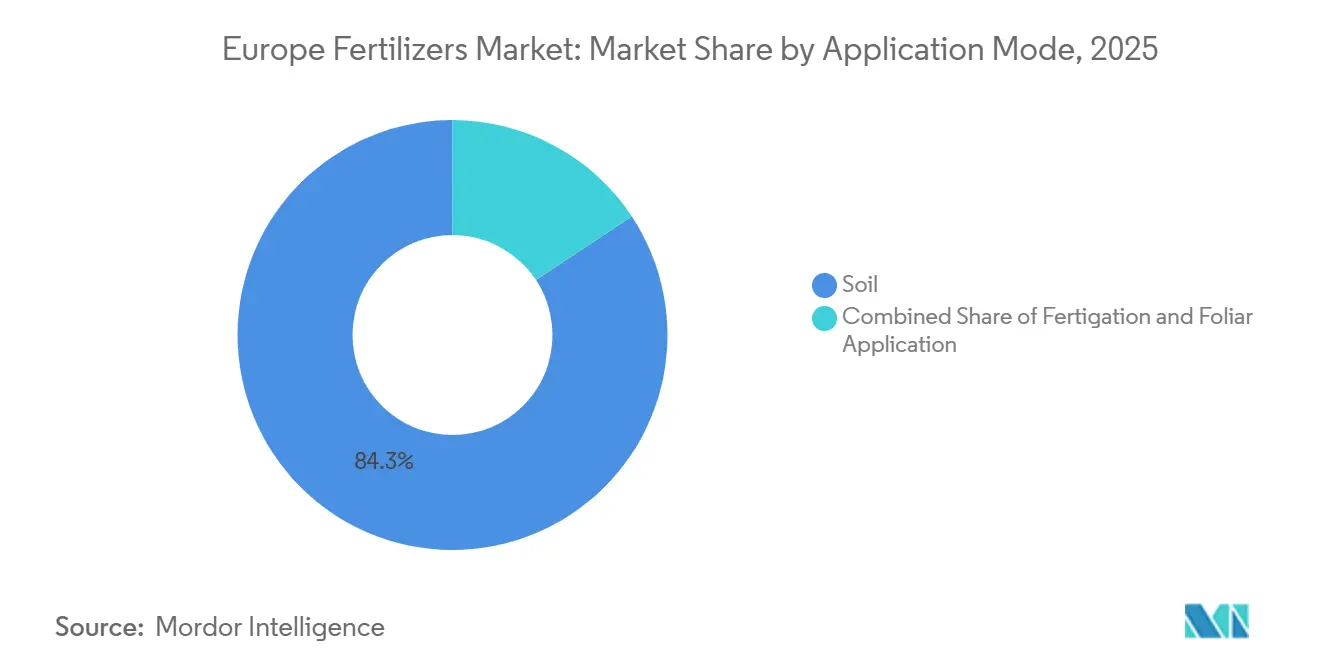
- By application mode, soil application represented the largest share of the market, accounting for 84.3% in 2025, while fertigation is projected to register the highest growth rate at a CAGR of 5.9% during 2026–2031.
- By crop type, field crops captured the largest share of the market in 2025, accounting for 79.6%, whereas horticultural crops are projected to be the fastest-growing segment, advancing at a CAGR of 5.5% through 2031.
- By geography, Germany accounted for the largest market share of 18.4% in 2025, while Russia is projected to be the fastest-growing regional market, expanding at a CAGR of 6.8% from 2026 to 2031
Note: Market size and forecast figures in this report are generated using Mordor Intelligence’s proprietary estimation framework, updated with the latest available data and insights as of 2026.
Europe Fertilizers Market Trends and Insights
Drivers Impact Analysis*
| Driver | (~) % Impact on CAGR Forecast | Geographic Relevance | Impact Timeline |
|---|---|---|---|
| EU (European Union) CAP (Common Agricultural Policy) eco-schemes boosting balanced fertilization | +0.8% | EU-27, strongest in France, Germany, Netherlands | Medium term (2-4 years) |
| Surge in specialty fertilizer adoption for precision farming | +0.9% | Western Europe, Nordic countries | Long term (≥ 4 years) |
| Rebound in cereal acreage after 2024 price rally | +0.7% | Eastern Europe, France, Germany | Short term (≤ 2 years) |
| Green-ammonia investments cutting supply-chain emissions | +0.6% | Netherlands, Germany, Norway | Long term (≥ 4 years) |
| (Carbon Border Adjustment Mechanism) CBAM-driven reshoring of nutrient production | +0.5% | EU-27; particularly Germany, Netherlands | Medium term (2-4 years) |
| Rise of controlled-environment farms in Northern Europe | +0.4% | Nordic countries, Netherlands | Medium term (2-4 years) |
| Source: Mordor Intelligence | |||


EU CAP eco-schemes boosting balanced fertilization
The European Union allocates EUR 31 billion (USD 33.5 billion) each year through Common Agricultural Policy eco-schemes that reward nutrient plans minimizing nitrogen and phosphorus losses [1]European Commission, “CAP Funds,” agriculture.ec.europa.eu. These incentives encourage stabilized nitrogen, controlled-release coatings, and precision-application tools that align with environmental objectives. Large cereal growers in France and Germany are modernizing equipment to meet scheme criteria, driving sales of nitrification and urease inhibitors. Fertilizer firms bundle agronomy services with their products to capture value from compliance support. The program’s performance-based payments reduce payback time on precision machinery, accelerating upgrades. Data-driven application planning also enhances yield consistency, reinforcing adoption momentum.
Surge in specialty fertilizer adoption for precision farming
High-resolution imagery from the Copernicus satellite program and on-farm sensors enable variable-rate applications that maximize nutrient efficiency [2]European Space Agency, “Copernicus Services – Land,” copernicus.eu. Controlled-release, liquid, and water-soluble formulations outperform conventional products under these data-driven regimes. Dutch greenhouse operators use fertigation dashboards that adjust nutrient mixes hourly, while Nordic cereal growers deploy coated urea to synchronize nitrogen release with crop uptake. Regional blending facilities tailor micronutrient profiles to local deficiencies, boosting efficacy. Producers offer subscription-based decision-support platforms, turning fertilizers into bundled agronomic solutions. Premium pricing is accepted because reduced losses offset higher product costs, creating a virtuous cycle for specialty growth.
Rebound in cereal acreage after 2024 price rally
Global supply disruptions lifted wheat to USD 302 per metric ton in late 2024, reversing acreage decline across Eastern and Western Europe. Farmers increased winter wheat and corn plantings by 3.2% in France and 2.8% in Germany, immediately lifting nutrient demand. Eastern European growers reopened marginal land, spurring nitrogen and phosphorus sales. Higher profit margins support greater application intensity and upgrades to precision spreaders. Fertilizer distributors report double-digit volume gains during spring 2025 pre-buy campaigns. Elevated cereal prices are anticipated to sustain planting expansion through 2026, underpinning near-term market growth.
CBAM-driven reshoring of nutrient production
The Carbon Border Adjustment Mechanism phases in levy payments on carbon-intensive fertilizer imports, narrowing delivered-cost differentials and incentivizing regional production. German and Dutch producers are evaluating brownfield retrofits with electrolytic hydrogen to qualify for lower levy rates. Imported urea from North Africa faces cost escalations, prompting buyers to secure European supply. Governments offer tax credits for low-carbon capital expenditures, lowering hurdle rates and accelerating project sanctioning. Rising domestic capacity mitigates supply-chain risk exposed during 2022 geopolitical disruptions, enhancing market resilience. Producers anticipate export opportunities to non-EU neighbors once scale lowers green-premium levels.
Restraints Impact Analysis*
| Restraint | (~) % Impact on CAGR Forecast | Geographic Relevance | Impact Timeline |
|---|---|---|---|
| Tightened nitrate and ammonia emission caps | -0.6% | EU-27; particularly Netherlands, Denmark | Short term (≤ 2 years) |
| Natural-gas price volatility inflating production costs | -0.8% | Germany, Netherlands, United Kingdom | Short term (≤ 2 years) |
| Rapid uptake of biostimulant substitutes | -0.4% | Western Europe, Mediterranean region | Medium term (2-4 years) |
| East-Europe logistics and sanction disruptions | -0.5% | Eastern Europe, Baltic states | Medium term (2-4 years) |
| Source: Mordor Intelligence | |||
Tightened nitrate and ammonia emission caps
The Netherlands caps nitrogen applications at 140 kg per hectare for grassland and 170 kg per hectare for arable crops, a cut of nearly 30% from historical norms. Denmark imposes soil-type quotas with stiff fines reaching USD 10,800 per hectare for exceedance. Farmers respond by reducing bulk urea purchases and increasing stabilized granular blends. The transition period dampens near-term demand because growers delay buying while recalibrating nutrient plans. Conventional broadcast practices face replacement by banded placement, lowering total volumes. Fertilizer companies must pivot to enhanced-efficiency lines and provide compliance advisory services, incurring additional costs yet opening premium sales.
Natural-gas price volatility inflating production costs
European natural-gas prices averaged USD 37.8 per MWh in 2024, more than double 2019 levels [3]International Energy Agency, “Gas Market Report Q4 2024,” iea.org. Spot spikes forced CF Industries to idle the Billingham plant and triggered production throttling at several German ammonia units. High and unpredictable feedstock prices erode margins and impair long-term contract negotiations. Producers counter by importing ammonia from regions with cheaper gas, but freight expenses and CBAM levies erode arbitrage gains. Investment in renewable hydrogen offers a hedge yet requires substantial capital and ramp-up time. Persistent volatility deters capacity expansion based on fossil gas, constraining overall supply growth.
*Our forecasts treat driver/restraint impacts as directional, not additive. The impact forecasts reflect baseline growth, mix effects, and variable interactions.
Segment Analysis
By Type: Straight Fertilizers Maintain Market Leadership as Complex Fertilizers Gain Momentum
Straight fertilizers held the largest market share and accounted for a 69.5% of the European fertilizers market in 2025, driven by the region's extensive cereal, oilseed, and field crop production systems. These systems rely heavily on separate applications of nitrogen, phosphate, and potash. Nitrogenous fertilizers, such as urea, ammonium nitrate, calcium ammonium nitrate, and urea ammonium nitrate, dominate demand, while phosphatic and potassic fertilizers remain critical for crop establishment and yield optimization. However, fertilizer consumption has been impacted by cost pressures. In 2023, European mineral fertilizer use declined by 3.7%, with nitrogen consumption decreasing to 8.3 million metric tons. This decline reflects cautious application practices influenced by elevated energy costs and uncertainties surrounding production economics and regulatory compliance across the region.
Complex fertilizers are anticipated to be the fastest-growing segment, with a projected CAGR of 5.1% from 2026 to 2031. This growth is attributed to increasing demand for balanced nutrient formulations that enhance application efficiency and support precision farming practices. Investments in advanced fertilizer production capacity further bolster this trend. For instance, K+S Aktiengesellschaft and Elixir Group commissioned a USD 38 million technical monoammonium phosphate production facility in Serbia in 2026, adding 50,000 metric tons of annual premium phosphate capacity. This investment underscores the rising confidence in compound fertilizer demand, particularly in Southern and Eastern Europe, where fertigation adoption and high-value crop cultivation are expanding. As growers focus on nutrient-use efficiency and regulatory compliance, demand for complex fertilizers is projected to strengthen throughout the forecast period.


By Form: Specialty Formulations Lead Innovation
Conventional formulations accounted for 81.2% of the Europe fertilizers market size in 2025, and specialty formulations are forecast to grow at the fastest 6.2% CAGR through 2031. The Europe fertilizers market size for controlled-release coatings is expanding as polymer-coated urea demonstrates 10% yield gains in greenhouse tomatoes across Spain. Water-soluble grades serve high-density Dutch greenhouses that feed nutrients via drip systems. Liquid formulations support variable-rate aerial and tractor applications, allowing on-the-go adjustments based on sensor data. Slow-release products thrive in turf management where public green standards favor fewer applications.
Conventional granules still dominate bulk field crops because of price advantage and embedded equipment fleets. Tightening nutrient thresholds pushes growers toward specialty formulations that reduce losses and meet compliance targets. Innovators focus on biodegradable coatings and dual-nutrient release mechanisms to broaden appeal. ESG-conscious food brands prefer produce cultivated with enhanced-efficiency nutrients, influencing input choices across supply chains. Sustained R&D investment underlines the segment’s role as the innovation engine of the Europe fertilizers market.
By Application Mode: Soil Applications Remain Dominant
Soil broadcasting and banding retained a 84.3% share in 2025 because mechanized equipment covers large acreages efficiently. Banded placement rises where phosphorus efficiency matters, particularly in precision-tilled German cornfields. The Europe fertilizers market size for fertigation is accelerating with a CAGR of 5.9% during 2026–2031, as greenhouse acreage grows across the Netherlands and Nordic countries. Integrated systems combine water and nutrients at root-zone intervals, enhancing uptake and reducing leaching. Foliar sprays, while niche, are gaining traction for stress mitigation during heat waves and drought episodes common in Mediterranean orchards.
Advancements in spreader telemetry enable real-time rate adjustments during soil applications, narrowing performance gaps with fertigation. Nonetheless, water-scarce regions favor fertigation because it pairs irrigation conservation with precise nutrient delivery. Suppliers develop formulations compatible with micro-irrigation hardware, including low-clogging liquid products. The rise of drone-based foliar nutrition offers new delivery avenues, although regulatory frameworks remain under development.
By Crop Type: Field Crops Drive Volume Demand
Field crops absorbed 79.6% of Europe fertilizers market volume in 2025, with wheat alone using around significant share of total nutrients. Intensifying corn production in Poland and Hungary boosts phosphorus and potassium consumption. The Europe fertilizers market size for horticultural crops is smaller but expanding at a 5.5% CAGR, owing to high-value returns that justify premium specialty inputs. Protected cultivation systems in Spain and the Netherlands demonstrate nutrient application rates triple those of field crops, supporting water-soluble and liquid fertilizer uptake.
Urbanization drives turf and ornamental demand for slow-release products that minimize maintenance. Berry and orchard growers invest in micronutrient and biostimulant packages to enhance fruit quality, aligning with supermarket specifications. As consumer preferences shift toward fresh produce, horticultural expansion will gradually lift specialty fertilizer penetration and diversify product mixes.
Geography Analysis
Germany accounted for 18.4% of the European fertilizers market in 2025, driven by its extensive cereal and oilseed production, advanced farming practices, and a well-established agricultural input distribution network. France remains a significant fertilizer-consuming market due to its large agricultural sector and substantial nitrogen fertilizer demand. However, elevated input costs in recent years have led to more cautious application rates. Italy, Spain, and Poland also represent key demand centers, supported by field crop cultivation, horticulture, and intensive farming systems. Together, these markets form the core of European fertilizer consumption, shaping regional demand trends across nitrogen, phosphate, and potash products.
The Netherlands stands out as a prominent market for specialty fertilizers, primarily due to its highly developed greenhouse horticulture sector. Here, fertigation and precision nutrient management systems drive demand for water-soluble and liquid fertilizers. In Southern Europe, particularly Spain and Italy, the adoption of fertigation technologies and high-value crop cultivation is increasing, boosting demand for specialty and efficiency-enhanced fertilizer products. Additionally, long-term investments in sustainable fertilizer production are strengthening the regional outlook.
Russia is anticipated to be the fastest-growing geography in the European fertilizers market, registering a projected CAGR of 6.8% from 2026 to 2031. This growth is supported by large-scale agricultural expansion, robust domestic fertilizer production capabilities, and an increasing focus on local nutrient supply. As one of the world's largest producers of ammonia and urea, Russia has a strong foundation for market growth despite evolving regional trade dynamics. Additionally, markets across Turkey, the Balkans, and Eastern Europe are benefiting from investments in fertilizer production and distribution infrastructure, further supporting regional market development and fertilizer consumption growth.
Competitive Landscape
Top Companies in Europe Fertilizers Market
The Europe fertilizers market displays a fragmented concentration with the top five firms controlling a minor share of the market size. Yara International is among the top players in the market owing to vertically integrated production and a dense distribution lattice. OCI Global is expanding via the acquisition of Fertiglobe’s European assets. EuroChem, CF Industries, and ICL Group round out the top bracket, highlighting fragmentation.
Competitive advantage is shifting toward sustainability credentials and digital agronomy services. Companies invest in renewable-energy ammonia plants to secure low-carbon product portfolios and meet retailer supply-chain targets. Patent activity in polymer coatings and nutrient stabilizers doubled in 2024, evidencing innovation pressure.
Digital platforms offering field-specific recommendations help suppliers lock in input sales and collect data for product development. Regulatory compliance costs favor well-capitalized incumbents, yet regional specialists thrive by tailoring blends to local agronomic nuances.
Europe Fertilizers Industry Leaders
CF Industries Holdings, Inc.
EuroChem Group
Yara International ASA
OCI Global N.V.
ICL Group
- *Disclaimer: Major Players sorted in no particular order

Recent Industry Developments
- June 2024: Yara International inaugurated a 24 MW green hydrogen plant at Herøya Industrial Park in Porsgrunn, Norway, developed and built by Linde Engineering. The plant produces around 10,000 kg of renewable hydrogen per day to replace natural gas in ammonia production, reducing approximately 41,000 tons of CO₂ emissions annually. This milestone supports Yara’s transition toward low-carbon fertilizers under its Yara Climate Choice portfolio.
- February 2023: OCI Global and NuStar Energy L.P. have agreed to deliver Ammonia into the Midwest. Through this agreement, OCI Global (“OCI”) to transport ammonia on a new segment of NuStar Pipeline Operating Partnership L.P.’s (“NuStar”) Ammonia Pipeline System. OCI has committed a capital expenditure of USD 30 million to facilitate this project on new ammonia cooling and storage facilities.


Europe Fertilizers Market Report Scope
Complex, Straight are covered as segments by Type. Conventional, Speciality are covered as segments by Form. Fertigation, Foliar, Soil are covered as segments by Application Mode. Field Crops, Horticultural Crops, Turf & Ornamental are covered as segments by Crop Type. France, Germany, Italy, Netherlands, Russia, Spain, Ukraine, United Kingdom are covered as segments by Country.Type
| Complex | ||
| Straight | Micronutrients | Boron |
| Copper | ||
| Iron | ||
| Manganese | ||
| Molybdenum | ||
| Zinc | ||
| Others | ||
| Nitrogenous | Ammonium Nitrate | |
| Anhydrous Ammonia | ||
| Urea | ||
| Others | ||
| Phosphatic | DAP | |
| MAP | ||
| SSP | ||
| TSP | ||
| Others | ||
| Potassic | MoP | |
| SoP | ||
| Others | ||
| Secondary Macronutrients | Calcium | |
| Magnesium | ||
| Sulfur | ||
Form
| Conventional | |
| Specialty | Controlled-Release Fertilizer (CRF) |
| Liquid Fertilizer | |
| Slow-Release Fertilizer (SRF) | |
| Water-Soluble |
Application Mode
| Fertigation |
| Foliar |
| Soil |
Crop Type
| Field Crops |
| Horticultural Crops |
| Turf and Ornamental |
Geography
| France |
| Germany |
| Italy |
| Netherlands |
| Russia |
| Spain |
| Ukraine |
| United Kingdom |
| Rest of Europe |
| Type | Complex | ||
| Straight | Micronutrients | Boron | |
| Copper | |||
| Iron | |||
| Manganese | |||
| Molybdenum | |||
| Zinc | |||
| Others | |||
| Nitrogenous | Ammonium Nitrate | ||
| Anhydrous Ammonia | |||
| Urea | |||
| Others | |||
| Phosphatic | DAP | ||
| MAP | |||
| SSP | |||
| TSP | |||
| Others | |||
| Potassic | MoP | ||
| SoP | |||
| Others | |||
| Secondary Macronutrients | Calcium | ||
| Magnesium | |||
| Sulfur | |||
| Form | Conventional | ||
| Specialty | Controlled-Release Fertilizer (CRF) | ||
| Liquid Fertilizer | |||
| Slow-Release Fertilizer (SRF) | |||
| Water-Soluble | |||
| Application Mode | Fertigation | ||
| Foliar | |||
| Soil | |||
| Crop Type | Field Crops | ||
| Horticultural Crops | |||
| Turf and Ornamental | |||
| Geography | France | ||
| Germany | |||
| Italy | |||
| Netherlands | |||
| Russia | |||
| Spain | |||
| Ukraine | |||
| United Kingdom | |||
| Rest of Europe | |||


Market Definition
- MARKET ESTIMATION LEVEL - Market Estimations for various types of fertilizers has been done at the product-level and not at the nutrient-level.
- NUTRIENT TYPES COVERED - Primary Nutrients: N, P and K, Secondary Macronutrients: Ca, Mg and S, Micronutients: Zn, Mn, Cu, Fe, Mo, B, and Others
- AVERAGE NUTRIENT APPLICATION RATE - This refers to the average volume of nutrient consumed per hectare of farmland in each country.
- CROP TYPES COVERED - Field Crops: Cereals, Pulses, Oilseeds, and Fiber Crops Horticulture: Fruits, Vegetables, Plantation Crops and Spices, Turf Grass and Ornamentals
| Keyword | Definition |
|---|---|
| Fertilizer | Chemical substance applied to crops to ensure nutritional requirements, available in various forms such as granules, powders, liquid, water soluble, etc. |
| Specialty Fertilizer | Used for enhanced efficiency and nutrient availability applied through soil, foliar, and fertigation. Includes CRF, SRF, liquid fertilizer, and water soluble fertilizers. |
| Controlled-Release Fertilizers (CRF) | Coated with materials such as polymer, polymer-sulfur, and other materials such as resins to ensure nutrient availability to the crop for its entire life cycle. |
| Slow-Release Fertilizers (SRF) | Coated with materials such as sulfur, neem, etc., to ensure nutrient availability to the crop for a longer period. |
| Foliar Fertilizers | Consist of both liquid and water soluble fertilizers applied through foliar application. |
| Water-Soluble Fertilizers | Available in various forms including liquid, powder, etc., used in foliar and fertigation mode of fertilizer application. |
| Fertigation | Fertilizers applied through different irrigation systems such as drip irrigation, micro irrigation, sprinkler irrigation, etc. |
| Anhydrous Ammonia | Used as fertilizer, directly injected into the soil, available in gaseous liquid form. |
| Single Super Phosphate (SSP) | Phosphorus fertilizer containing only phosphorus which has lesser than or equal to 35%. |
| Triple Super Phosphate (TSP) | Phosphorus fertilizer containing only phosphorus greater than 35%. |
| Enhanced Efficiency Fertilizers | Fertilizers coated or treated with additional layers of various ingredients to make it more efficient compared to other fertilizers. |
| Conventional Fertilizer | Fertilizers applied to crops through traditional methods including broadcasting, row placement, ploughing soil placement, etc. |
| Chelated Micronutrients | Micronutrient fertilizers coated with chelating agents such as EDTA, EDDHA, DTPA, HEDTA, etc. |
| Liquid Fertilizers | Available in liquid form, majorly used for application of fertilizers to crops through foliar and fertigation. |


Research Methodology
Mordor Intelligence follows a four-step methodology in all our reports.
- Step-1: IDENTIFY KEY VARIABLES: In order to build a robust forecasting methodology, the variables and factors identified in Step-1 are tested against available historical market numbers. Through an iterative process, the variables required for market forecast are set and the model is built on the basis of these variables.
- Step-2: Build a Market Model: Market-size estimations for the forecast years are in nominal terms. Inflation is not a part of the pricing, and the average selling price (ASP) is kept constant throughout the forecast period for each country.
- Step-3: Validate and Finalize: In this important step, all market numbers, variables and analyst calls are validated through an extensive network of primary research experts from the market studied. The respondents are selected across levels and functions to generate a holistic picture of the market studied.
- Step-4: Research Outputs: Syndicated Reports, Custom Consulting Assignments, Databases & Subscription Platforms


